Loading
by BlastRoom
Read bar graphs of classroom investigation results to find values, spot patterns, and judge conclusions.
#science_data#us_grade_3_science
20 questions
One question set, multiple game modes. Tap any game to see it in action. Not sure which to pick?
Answer to place stones and capture territory.
Outrun the snow together.
Earn blasts, then hunt the other team.
Answer to earn energy, then climb.

The class blasts through walls together.
Bid on mystery lots. Most money wins.
Sell tours. Nice, standard, or a total scam.

Answer, restock, and serve the rush.
More correct answers pulls the rope your way.
Answer, then shoot down the alien wave.
Answer, then tap to leap the frozen ridge.
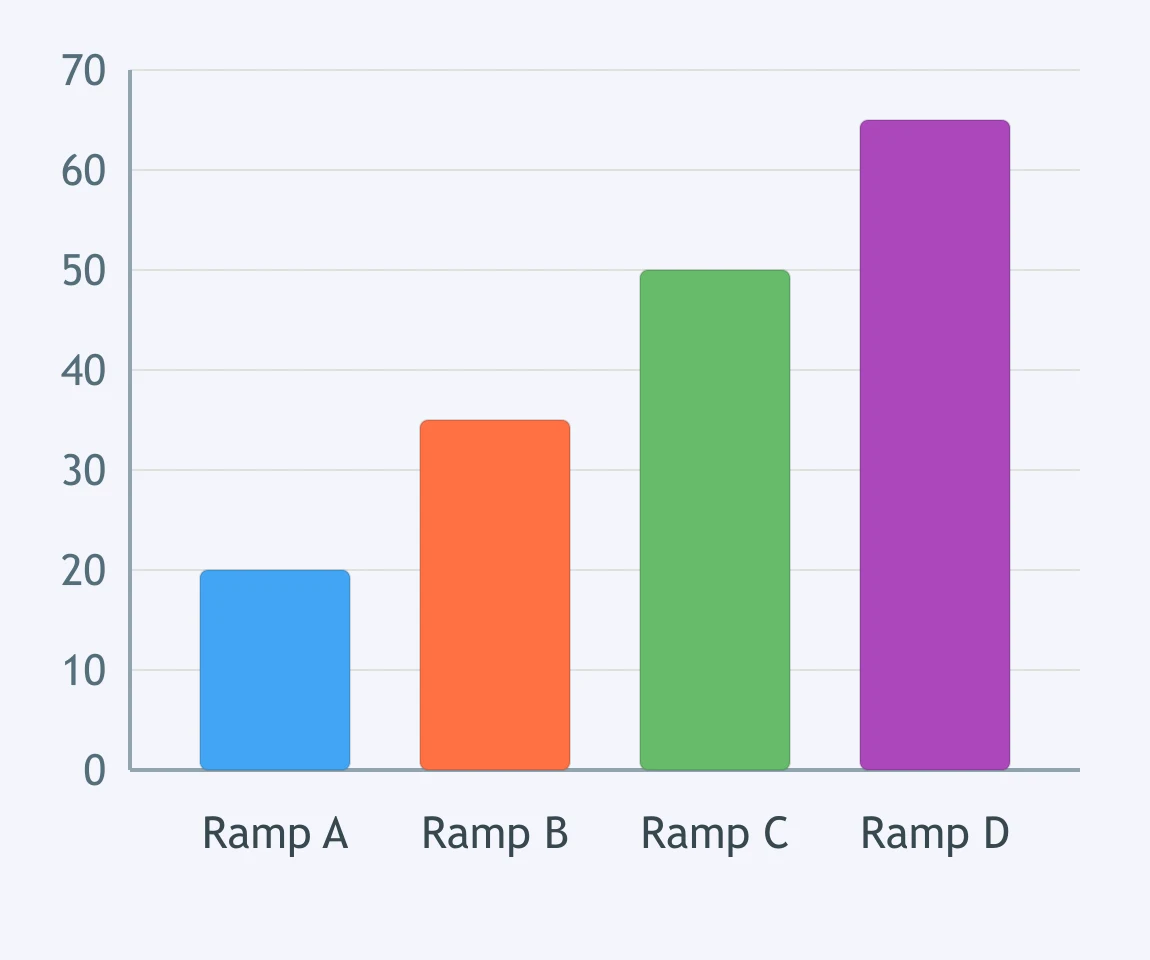
The bar graph shows how far a toy car rolled in centimeters from four ramps the class tested. How far did the car roll from Ramp C?
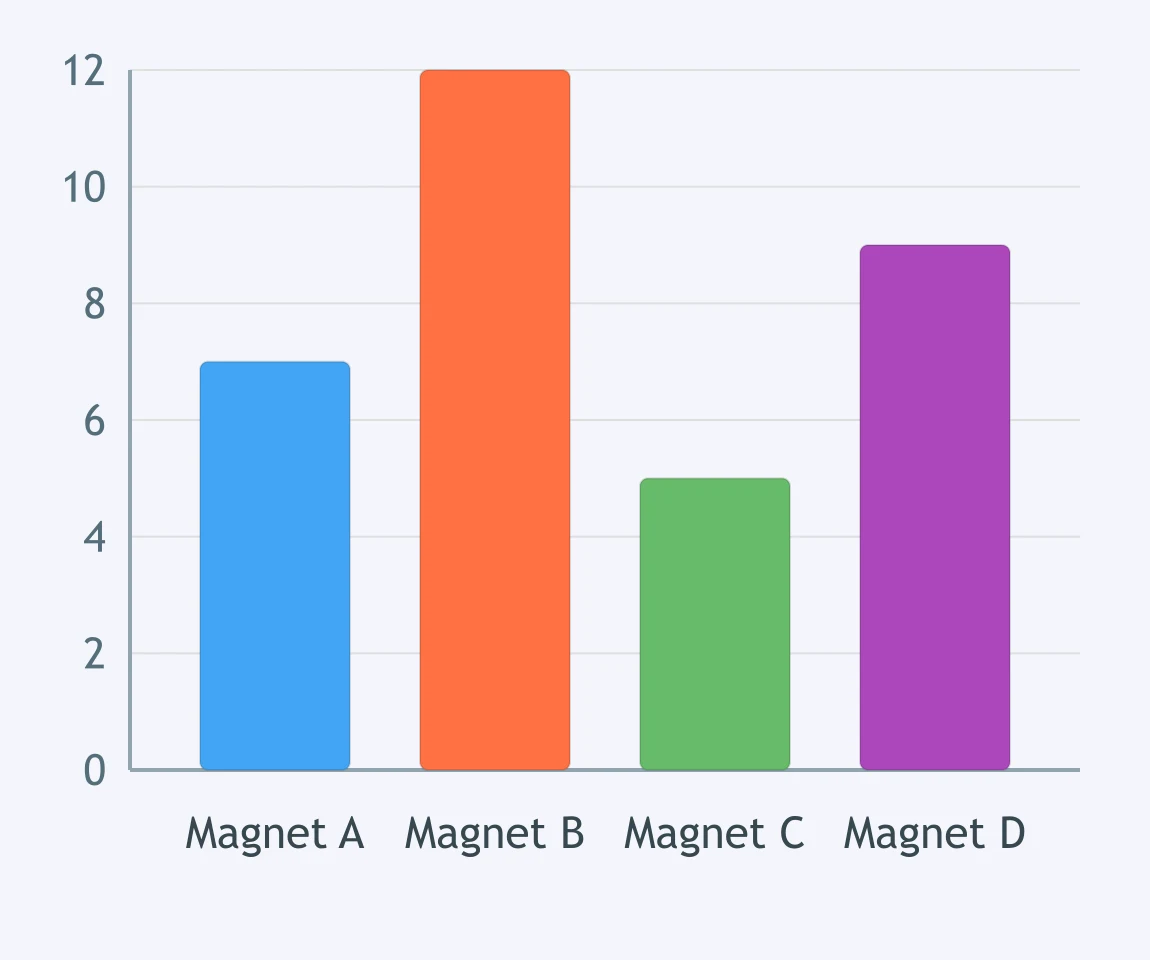
The bar graph shows how many paper clips each of four magnets picked up in the class test. How many paper clips did Magnet B pick up?
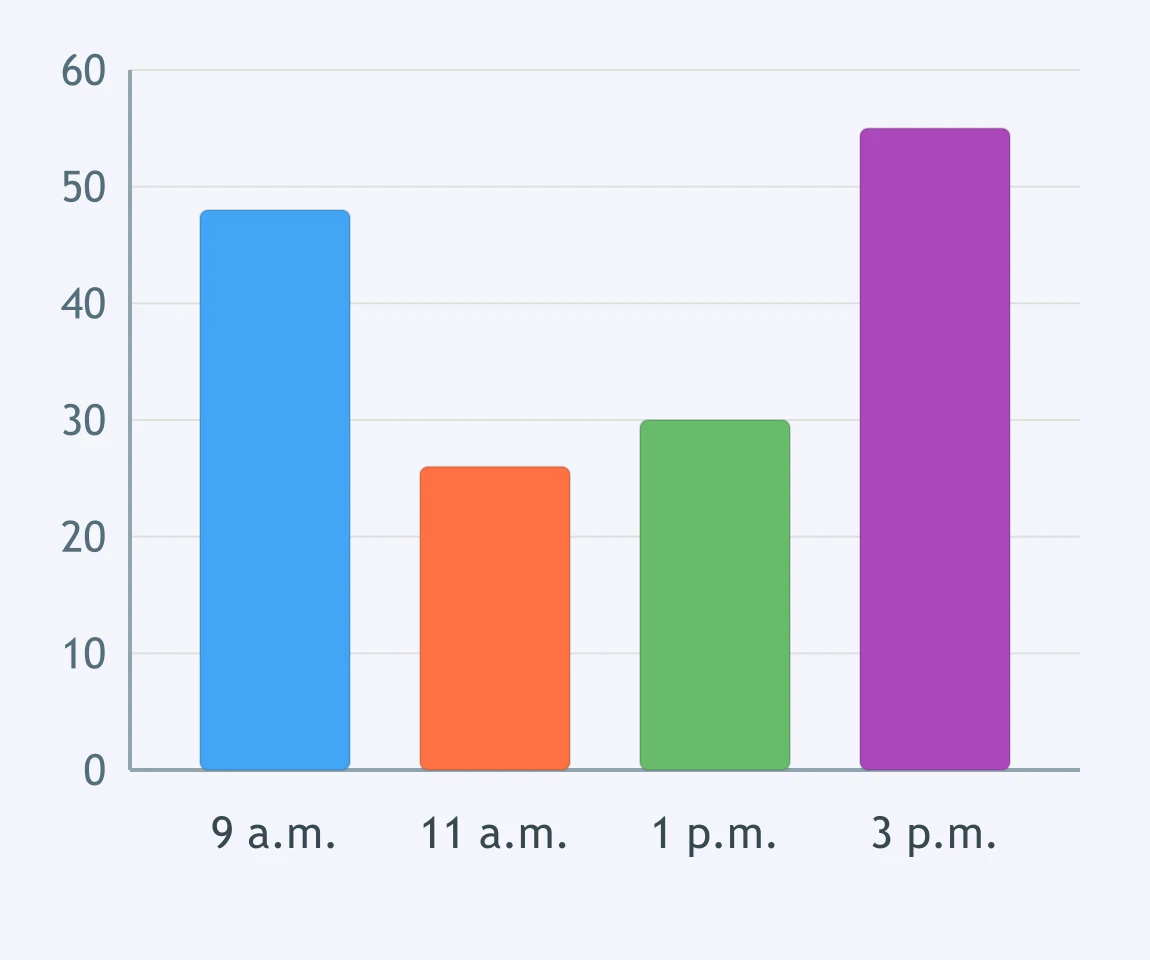
The bar graph shows how long a stick's shadow measured in centimeters at four times of the school day. Which time had the shortest shadow?
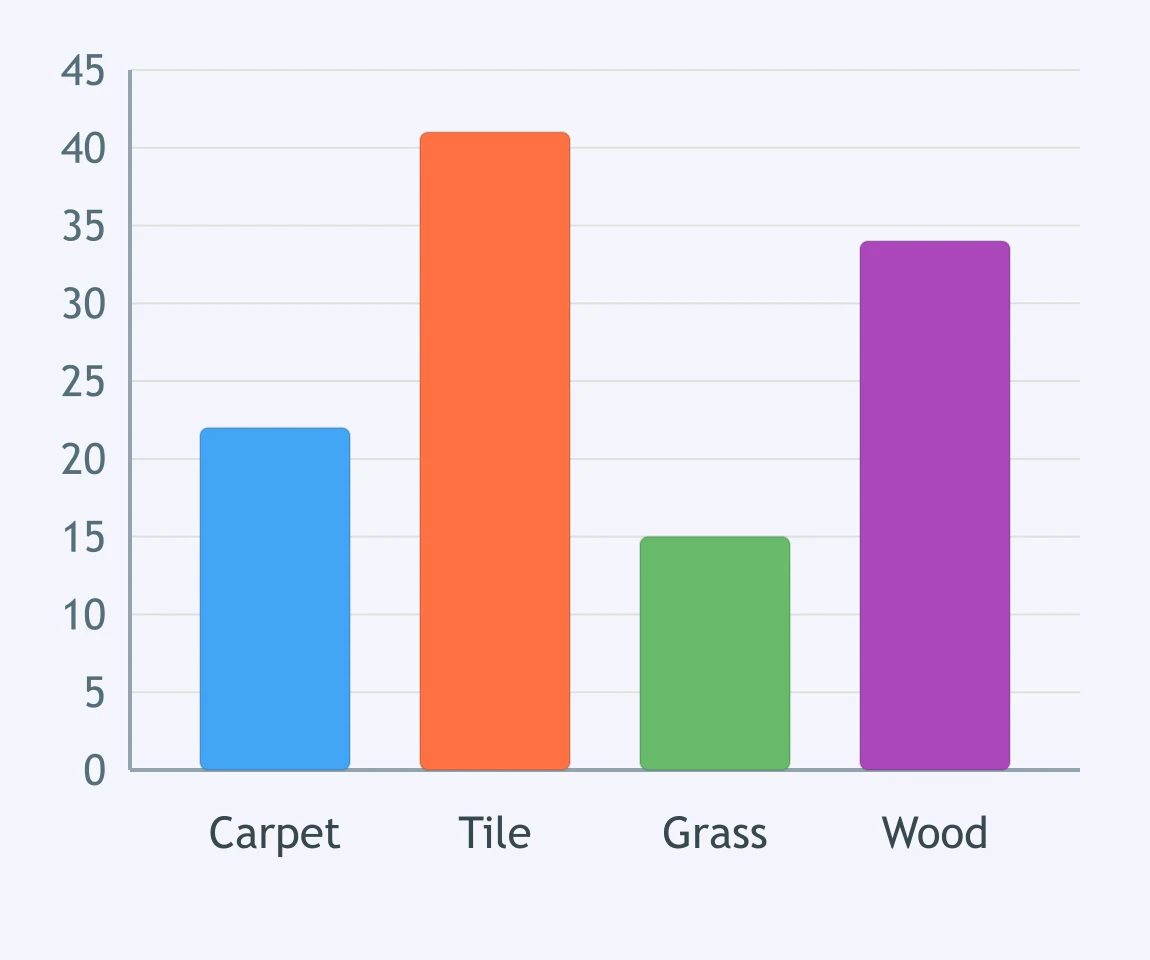
The bar graph shows how high a ball bounced in centimeters on four surfaces. On which surface did the ball bounce the highest?
The bar graph shows how many seeds sprouted in four cups of soil in the class investigation. Which two cups sprouted the same number of seeds?
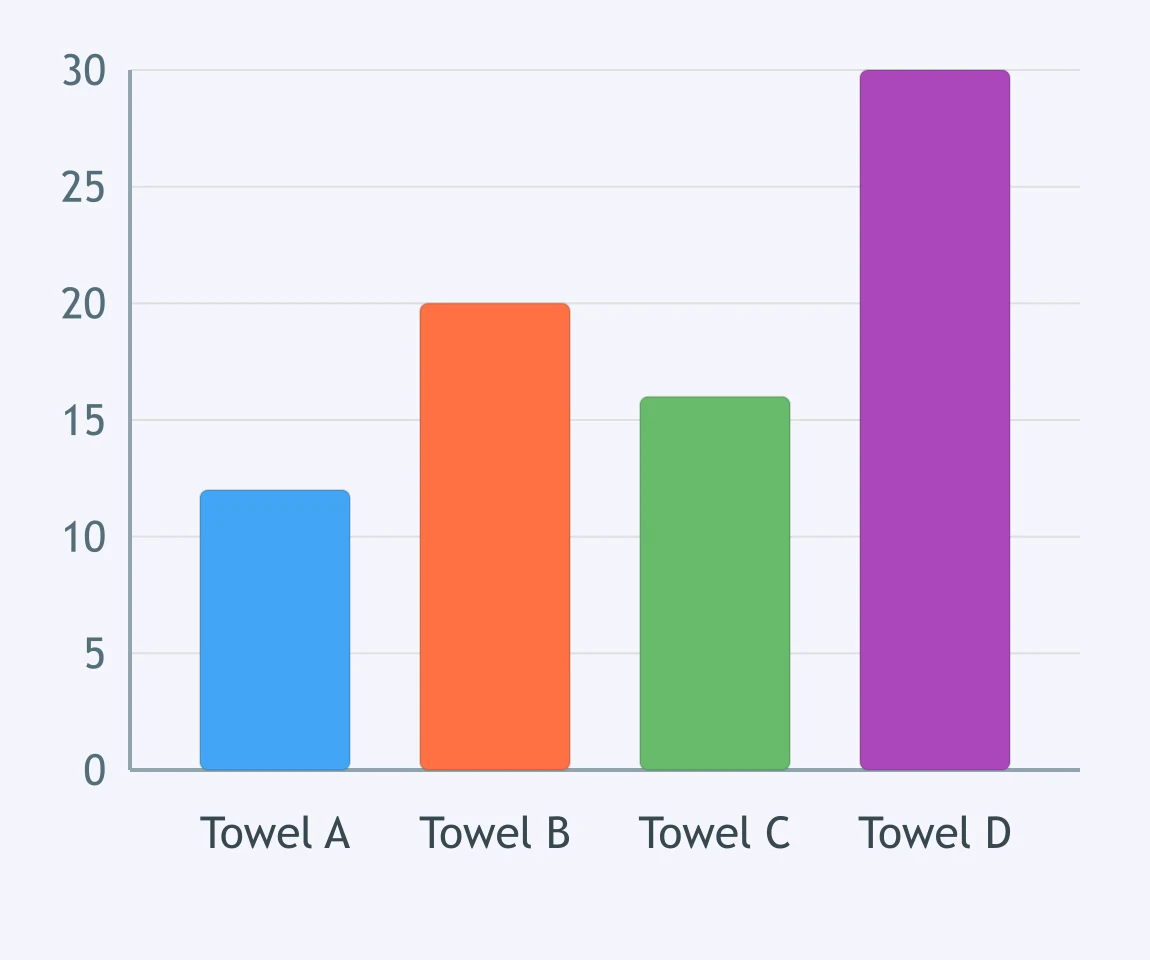
The bar graph shows how many milliliters of water four paper towels soaked up. How many more milliliters did Towel D soak up than Towel A?
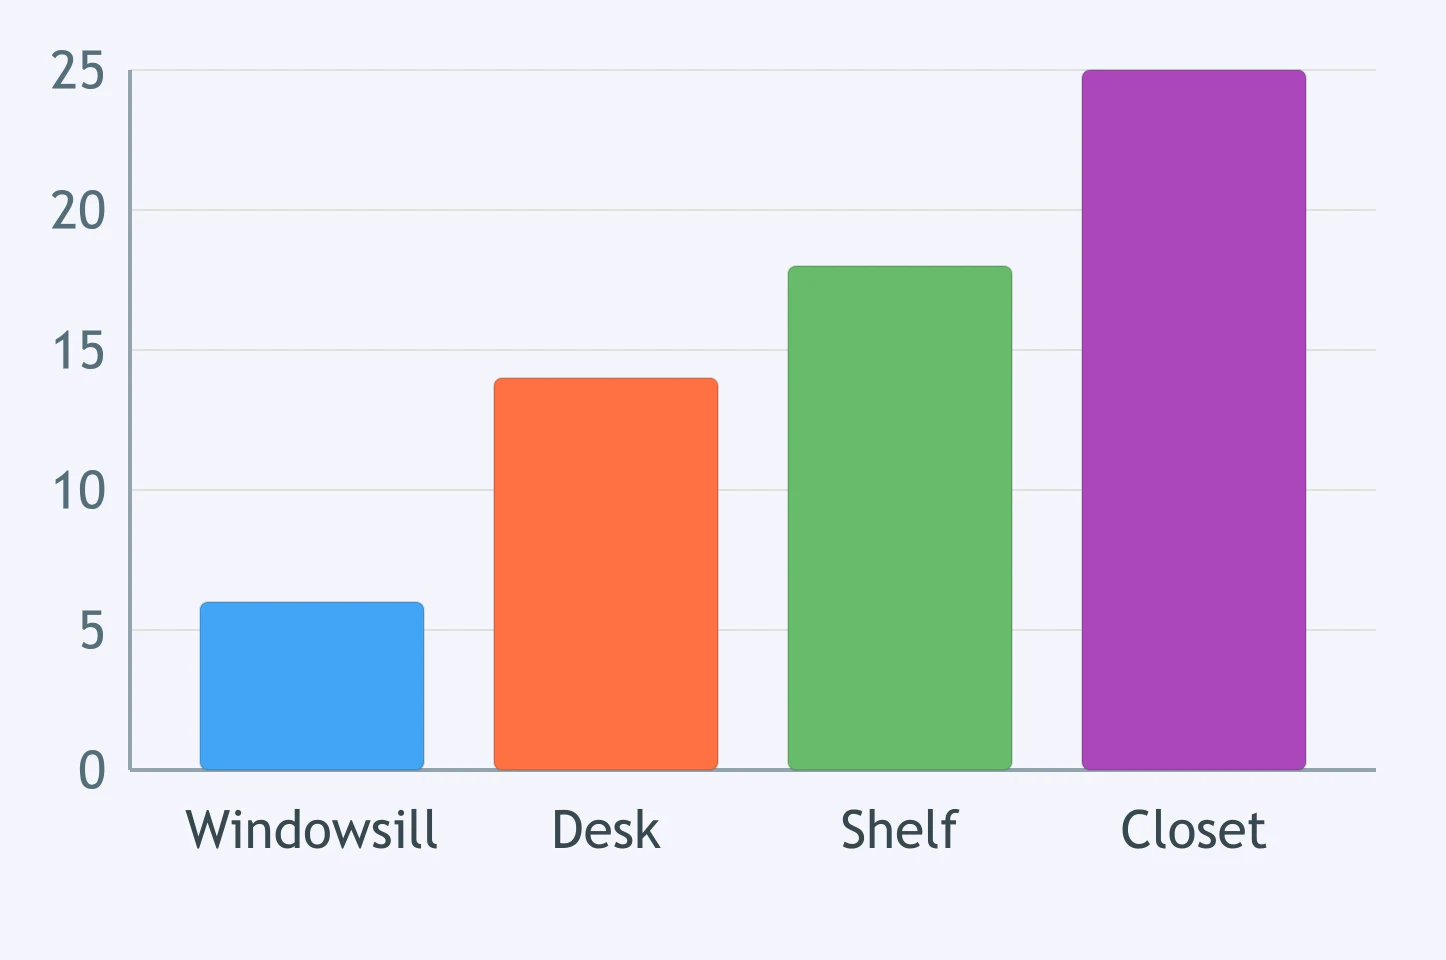
The bar graph shows how many minutes an ice cube took to melt in four places in the classroom. In which place did the ice cube melt fastest?
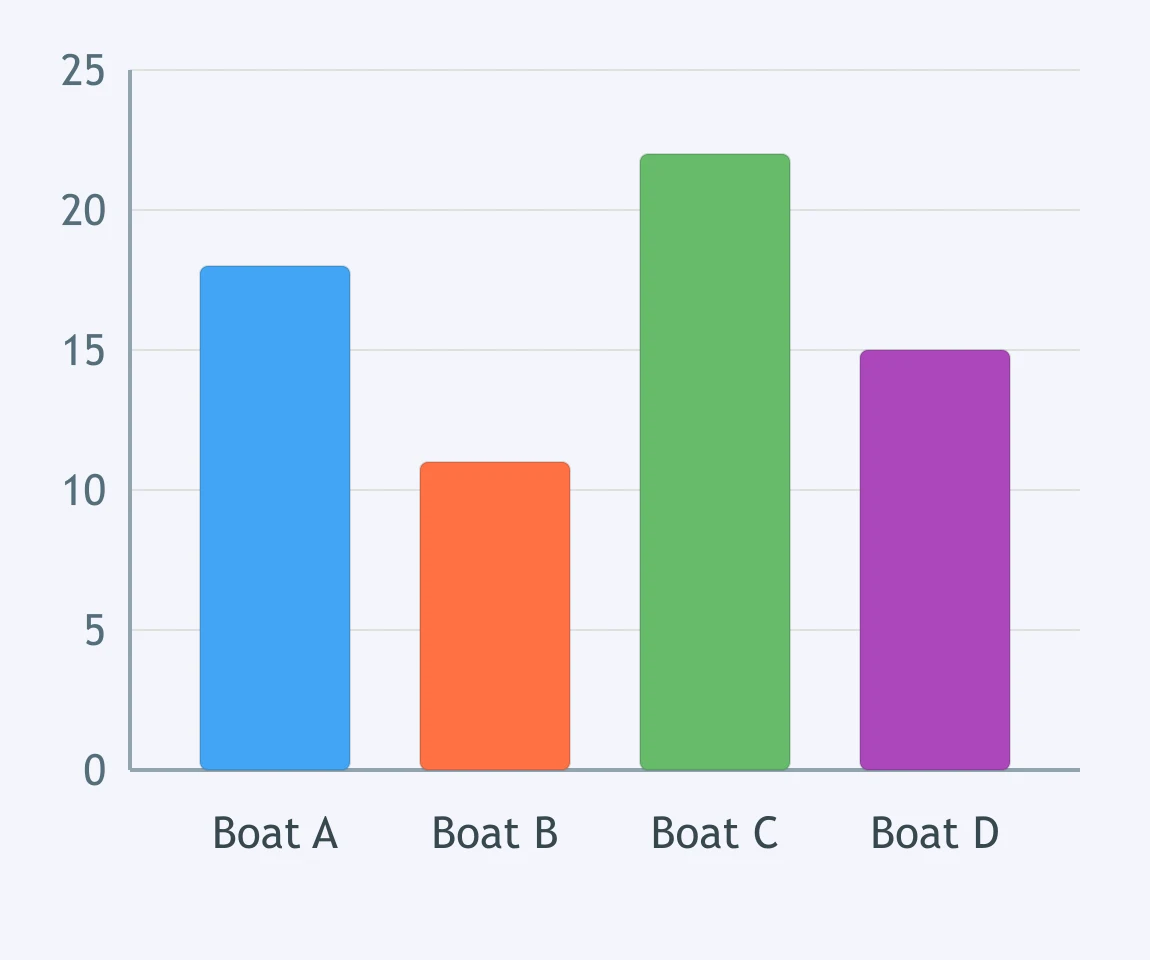
The bar graph shows how many seconds four toy boats took to cross a water tray. Boat B crossed the tray faster than Boat D.
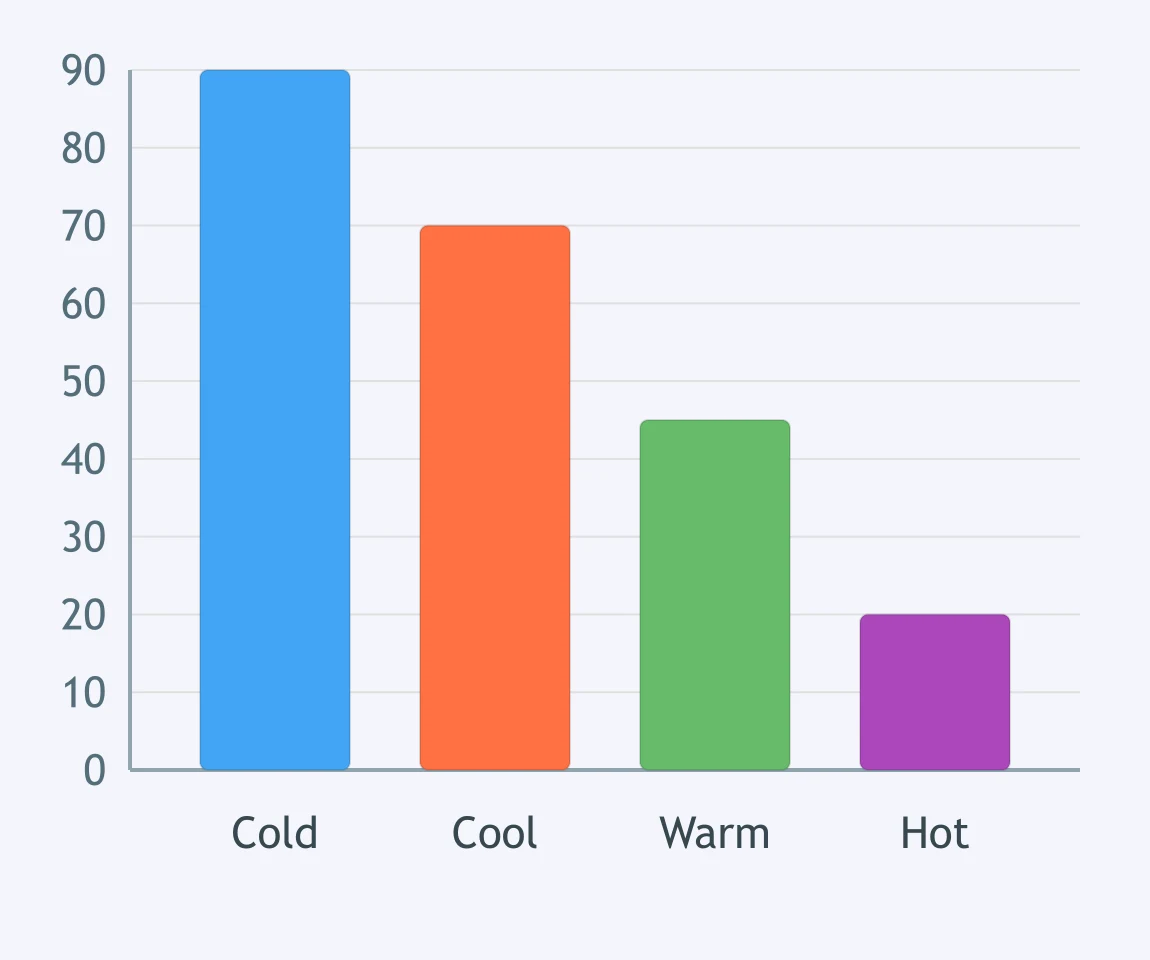
The bar graph shows how many seconds sugar took to dissolve in four cups of water, ordered from coldest to warmest. What pattern does the data show?
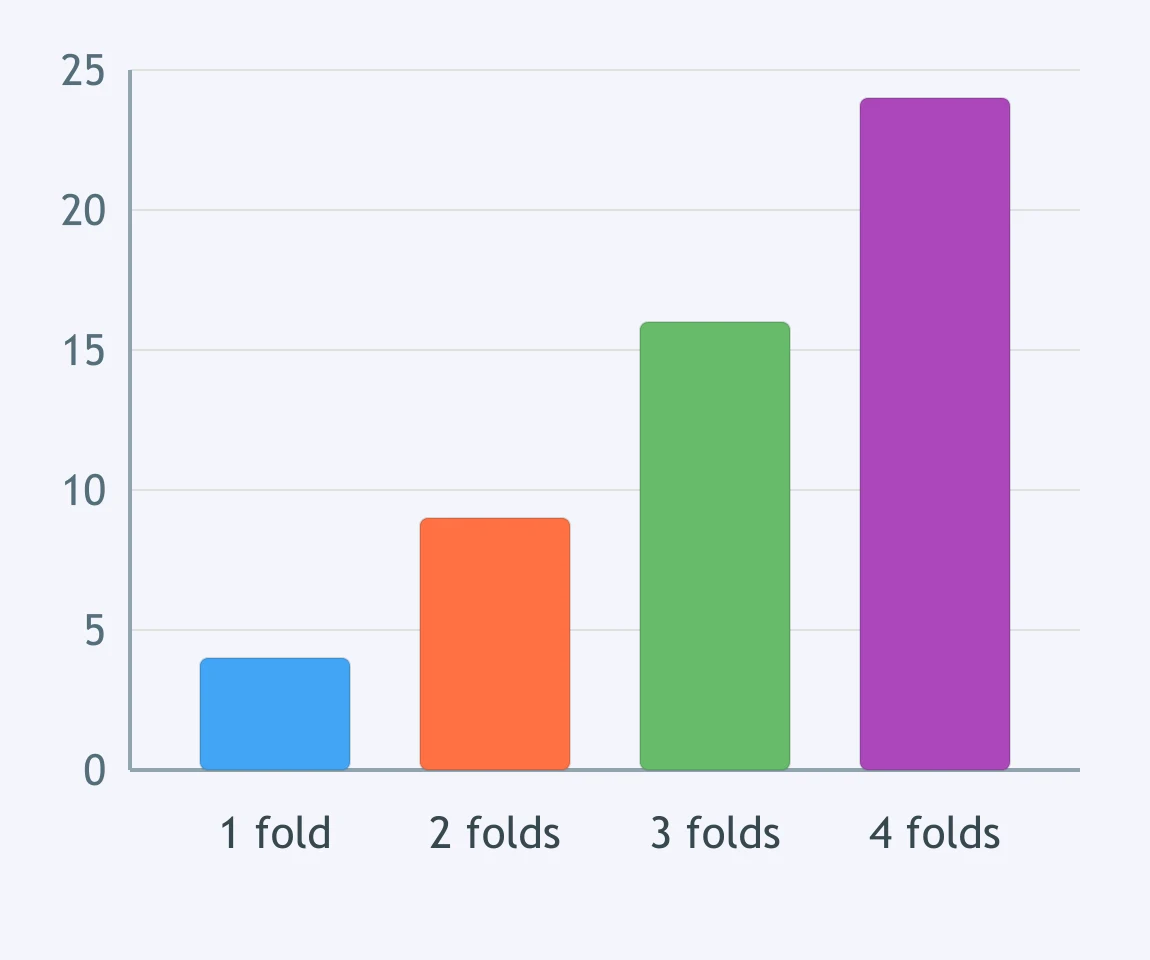
The bar graph shows how many washers a paper bridge held with one, two, three, and four folds. What pattern does the data show?
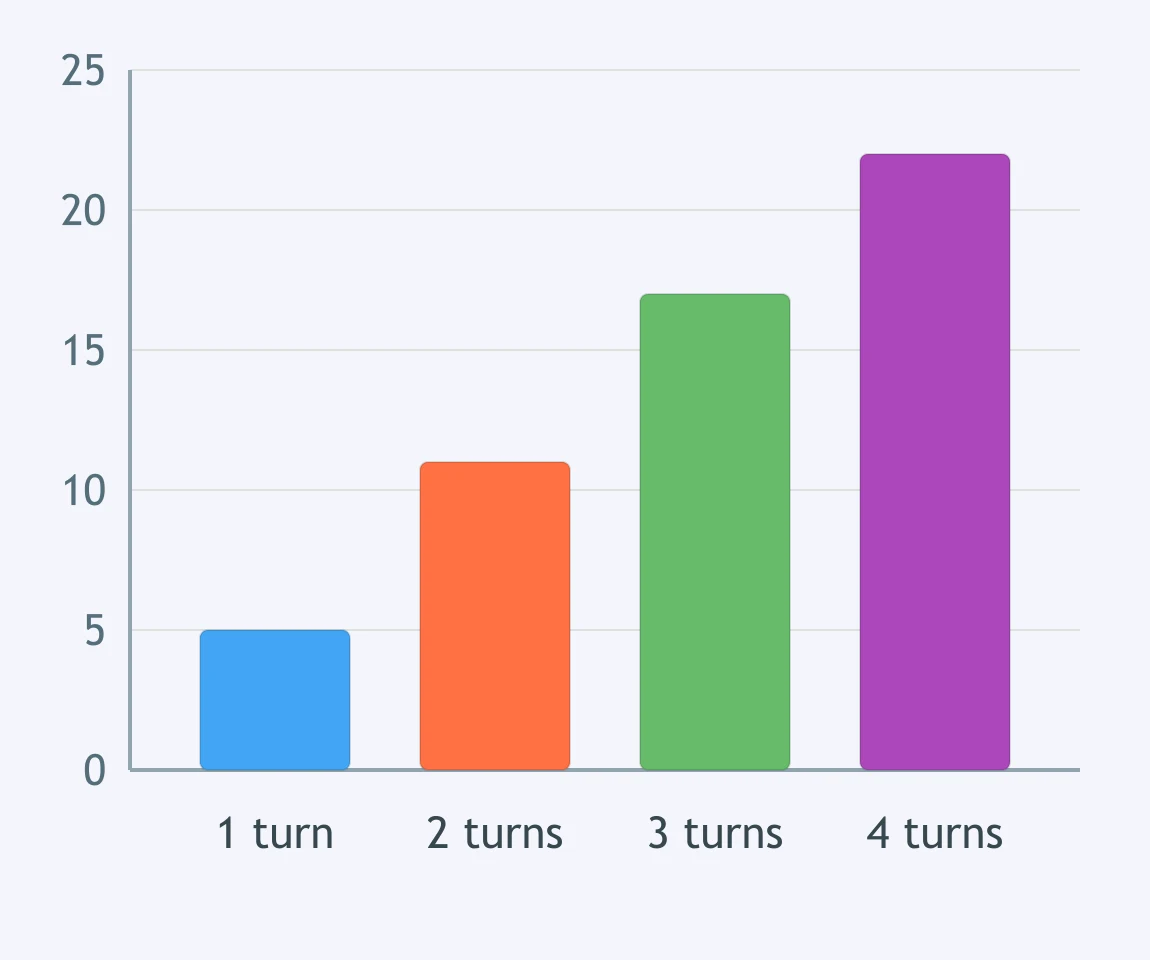
The bar graph shows how many seconds a wind-up toy ran after being wound one, two, three, and four turns. What does the data show about the turns?
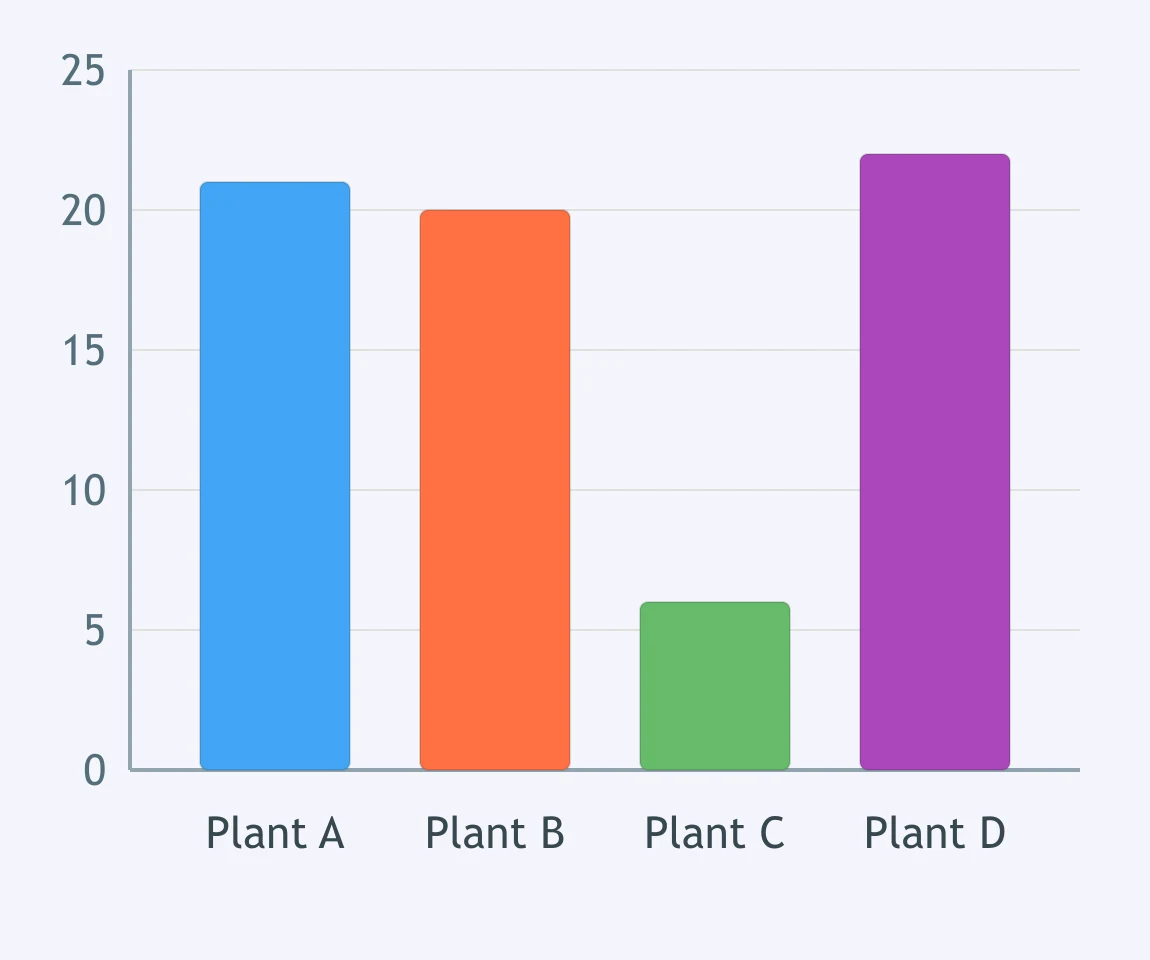
The bar graph shows how many centimeters four sunflower plants grew after getting the same water and light. Which plant does not fit the pattern?
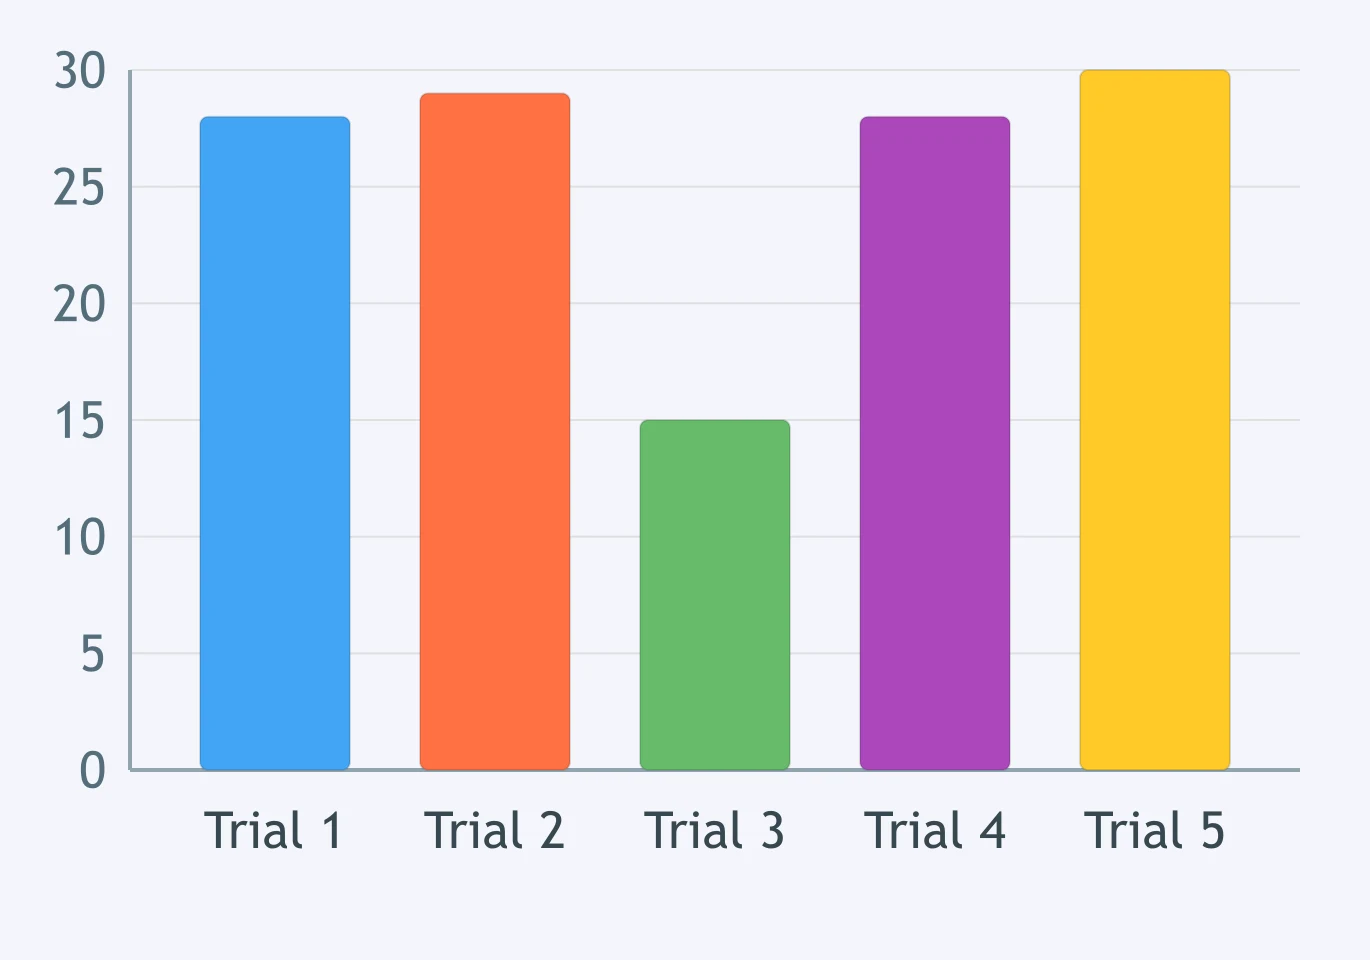
The bar graph shows how many swings a pendulum made in one minute in five trials. Which trial does not fit the pattern of the others?
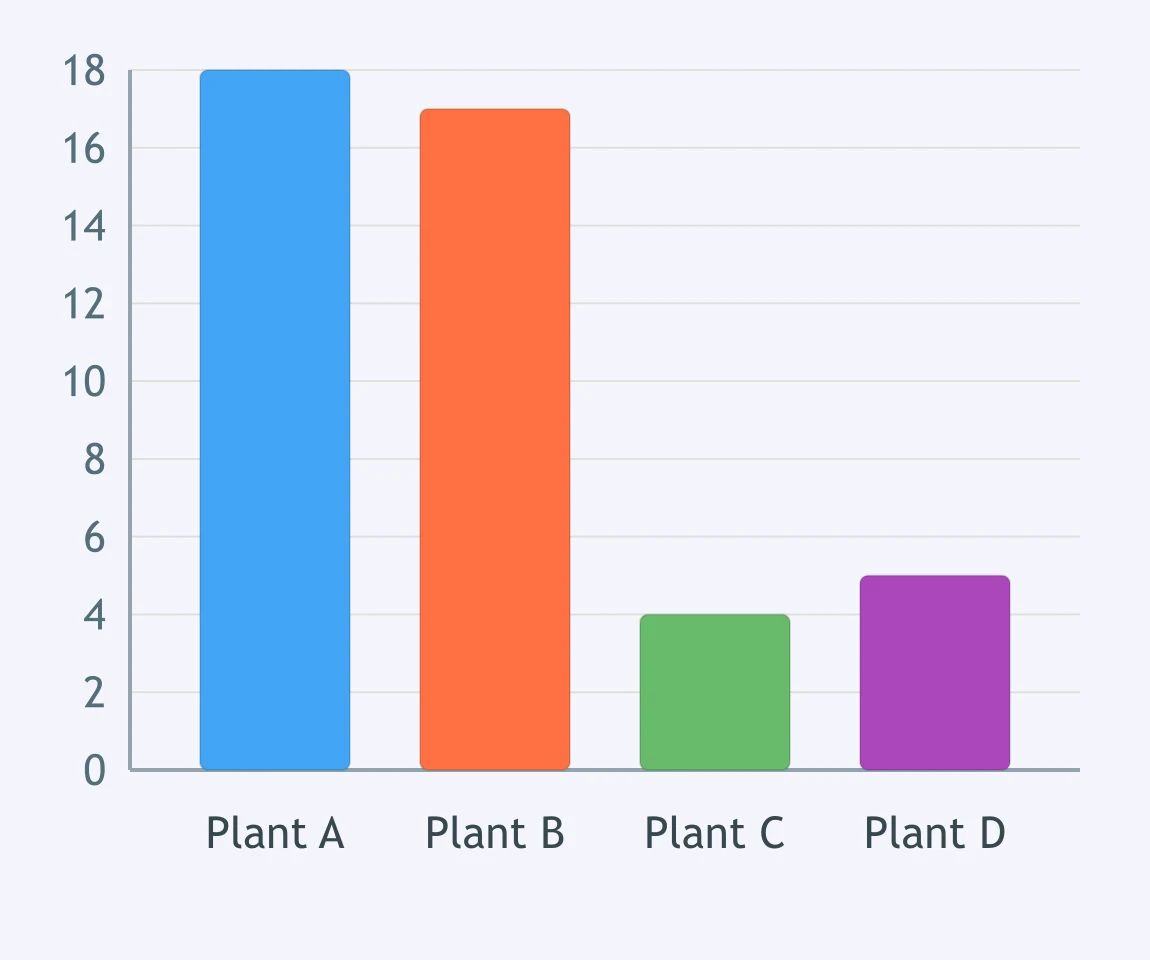
The bar graph shows how tall four radish seedlings grew in centimeters. Plants A and B sat in sunlight and plants C and D sat in a dark closet. What do the results support?
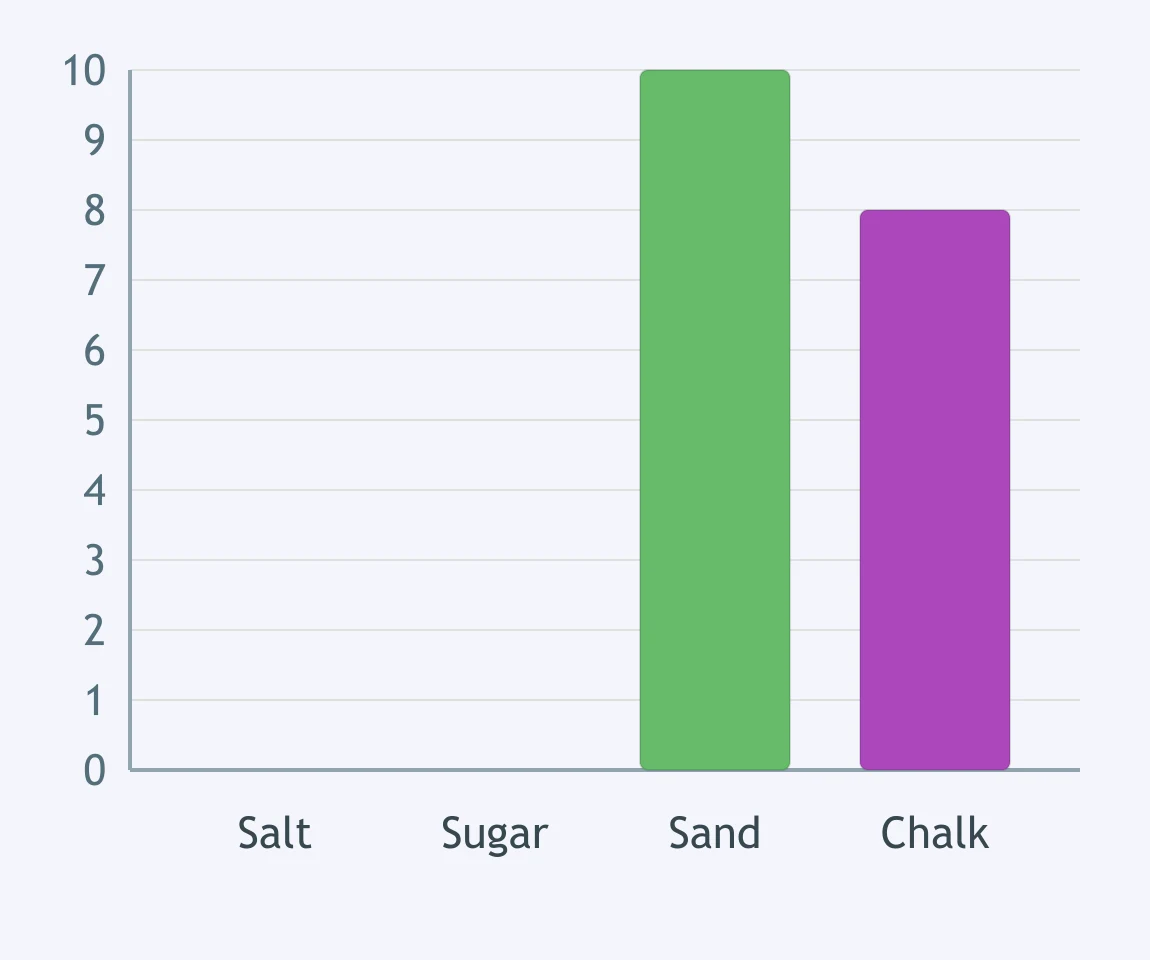
The bar graph shows how many grams of each material were left undissolved after being stirred into water. The class tested salt, sugar, sand, and chalk. What do the results support?
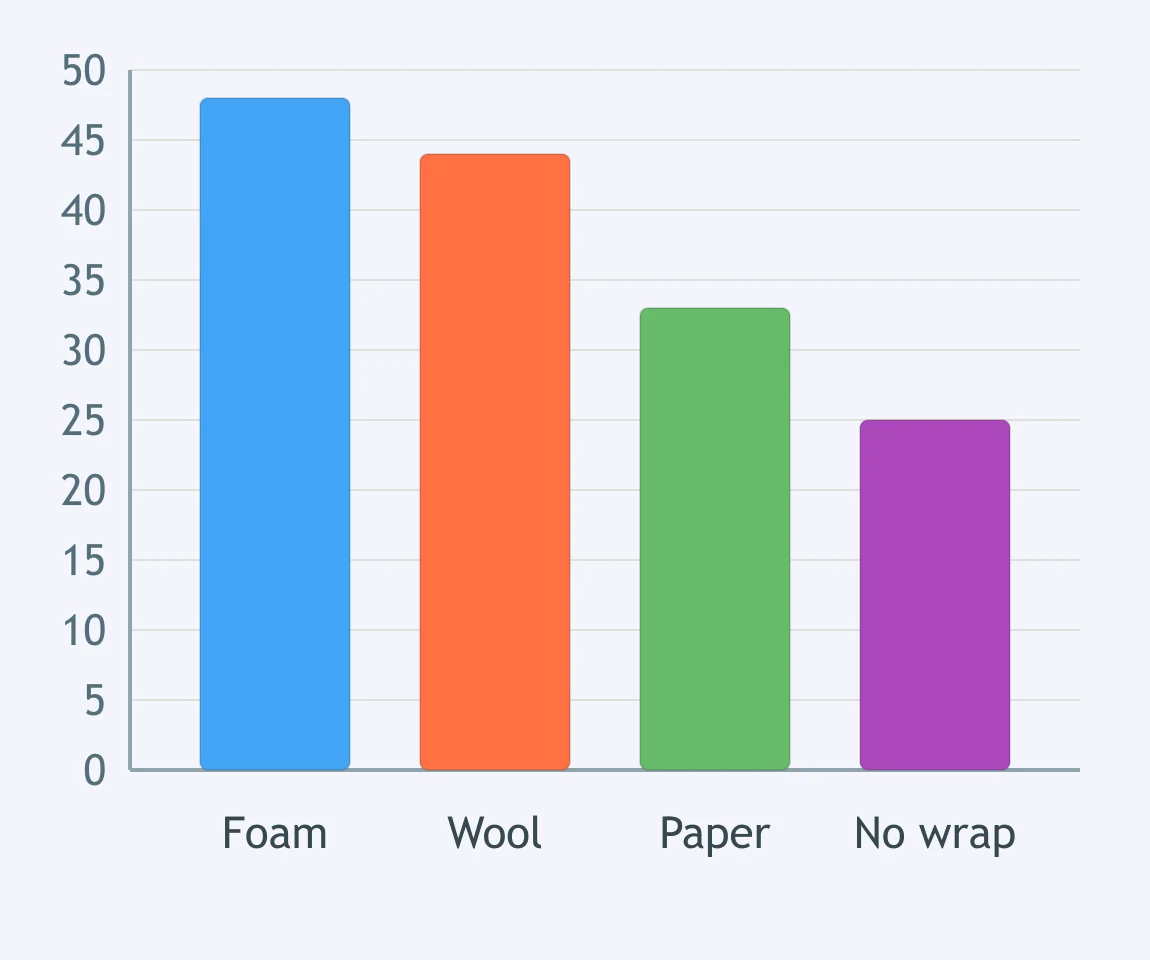
The bar graph shows the temperature in degrees Celsius of hot water left in four cups, each wrapped in a different material. What do the results support?
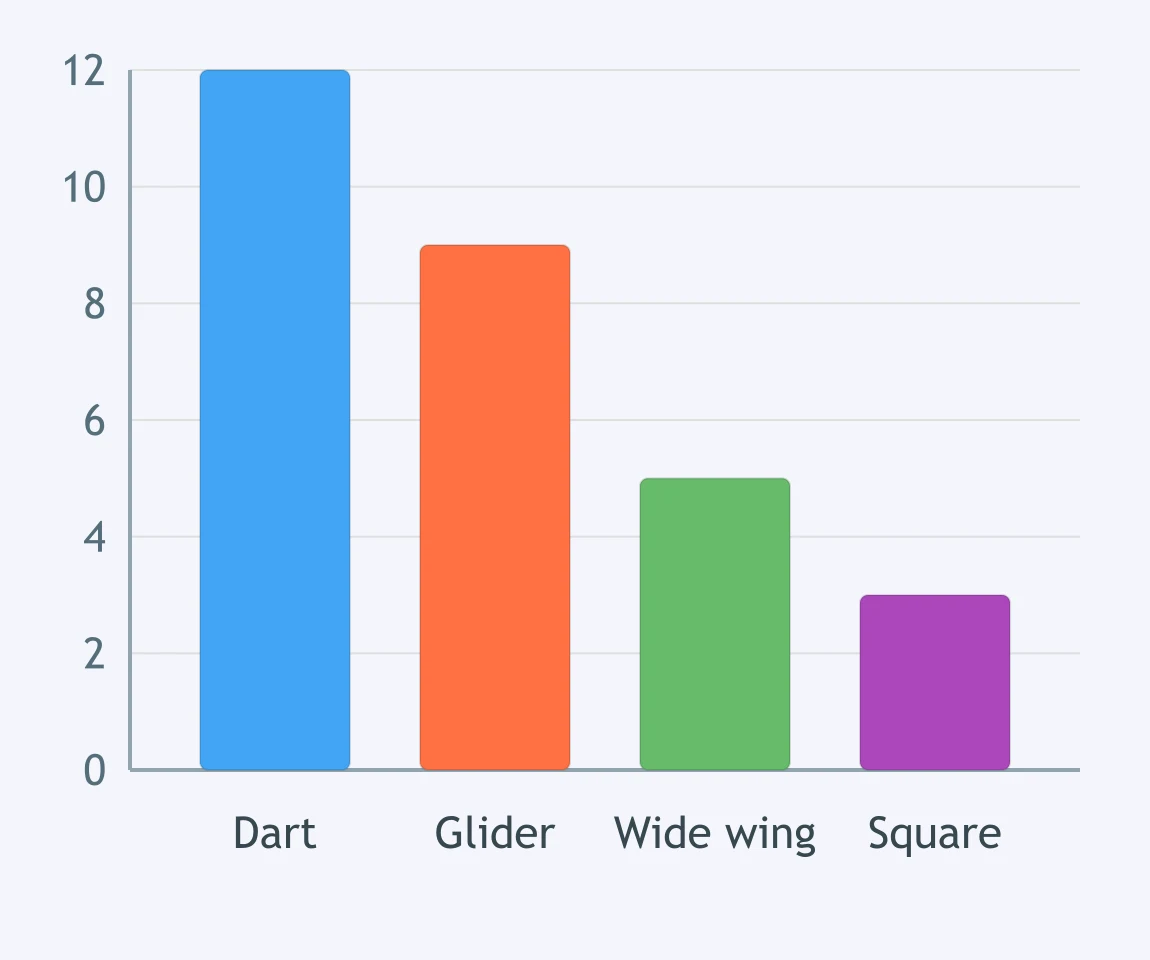
The bar graph shows how far four paper airplane designs flew in meters when the same student threw each one. What do the results support?
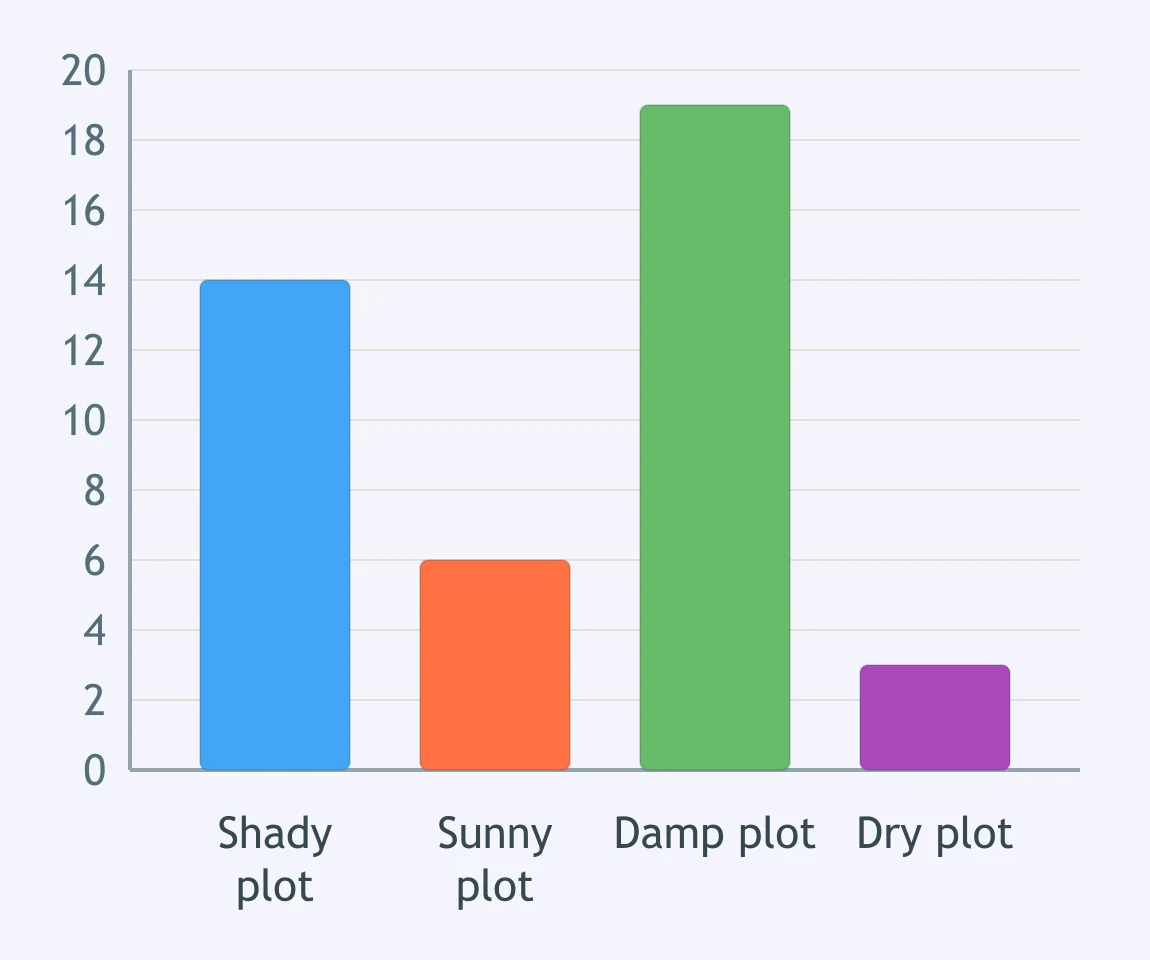
The bar graph shows how many earthworms the class counted in four soil plots in the school garden. Which statement goes beyond what this data shows?
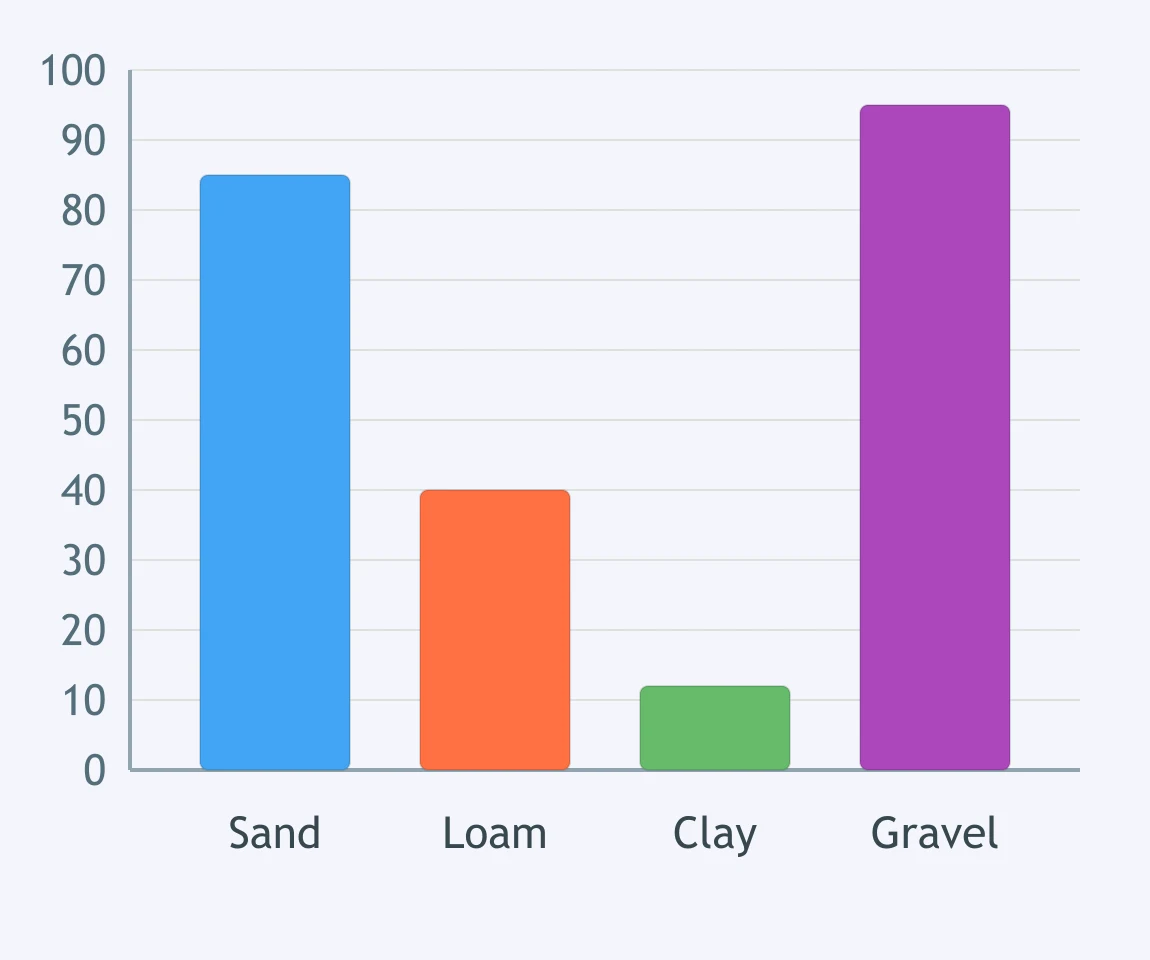
The bar graph shows how many milliliters of water drained through four soil samples in the class investigation. What do the results support?
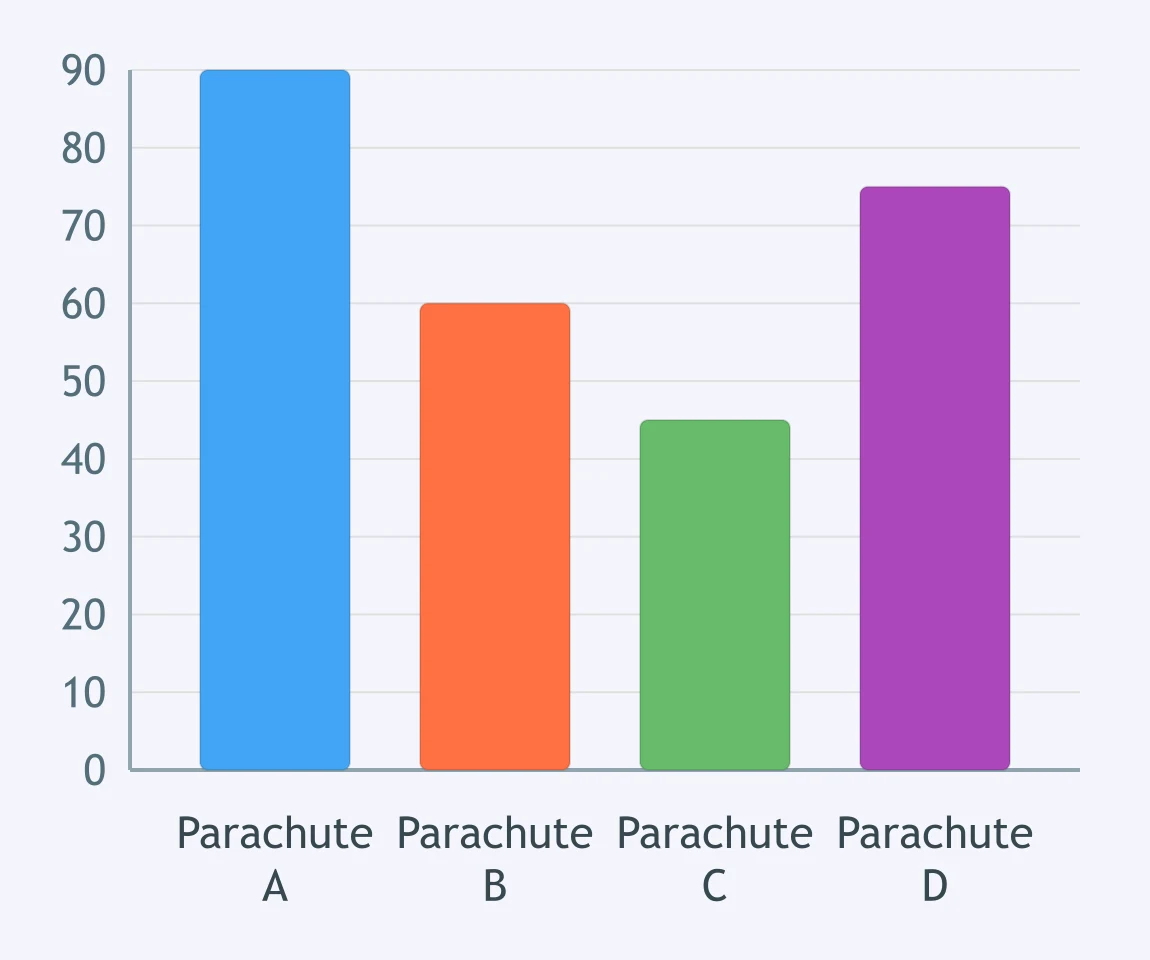
The bar graph shows how many centimeters four toy parachutes fell in one second. This data shows which parachute would work best for a grown person.
Crack the passcode before the zombies get in.
Answer, then swat bugs for bonus points.
Race through questions at your own speed.
Same question on every screen. Fastest wins.

Pick a tile, answer, hit bonuses and steals.
Physical and Behavioral Adaptations
20 questions