Loading
by BlastRoom
Spot graphs and charts that distort data through a cut baseline, a chosen date range or missing units.
#nonlinear_texts#matatag_english_7

20 questions
One question set, multiple game modes. Tap any game to see it in action. Not sure which to pick?
Look at the line graph. A poster shows only January to March. Which pattern does that selected range hide?
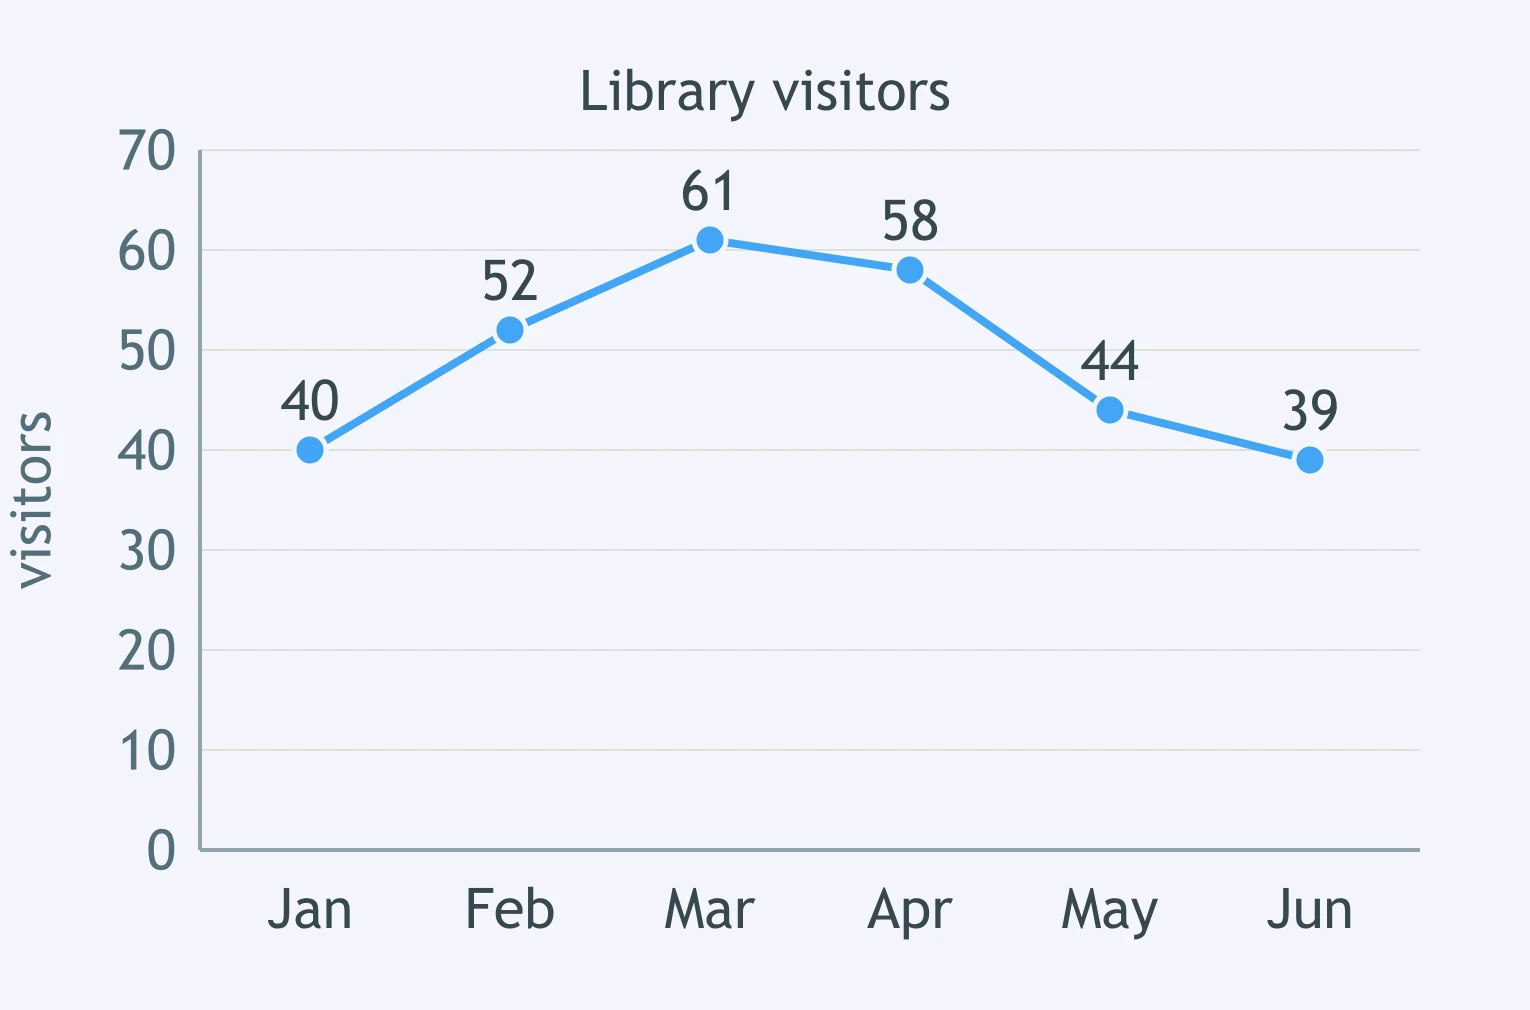
Look at the bar graph. Its scale starts at zero. What does it show about the three schools?
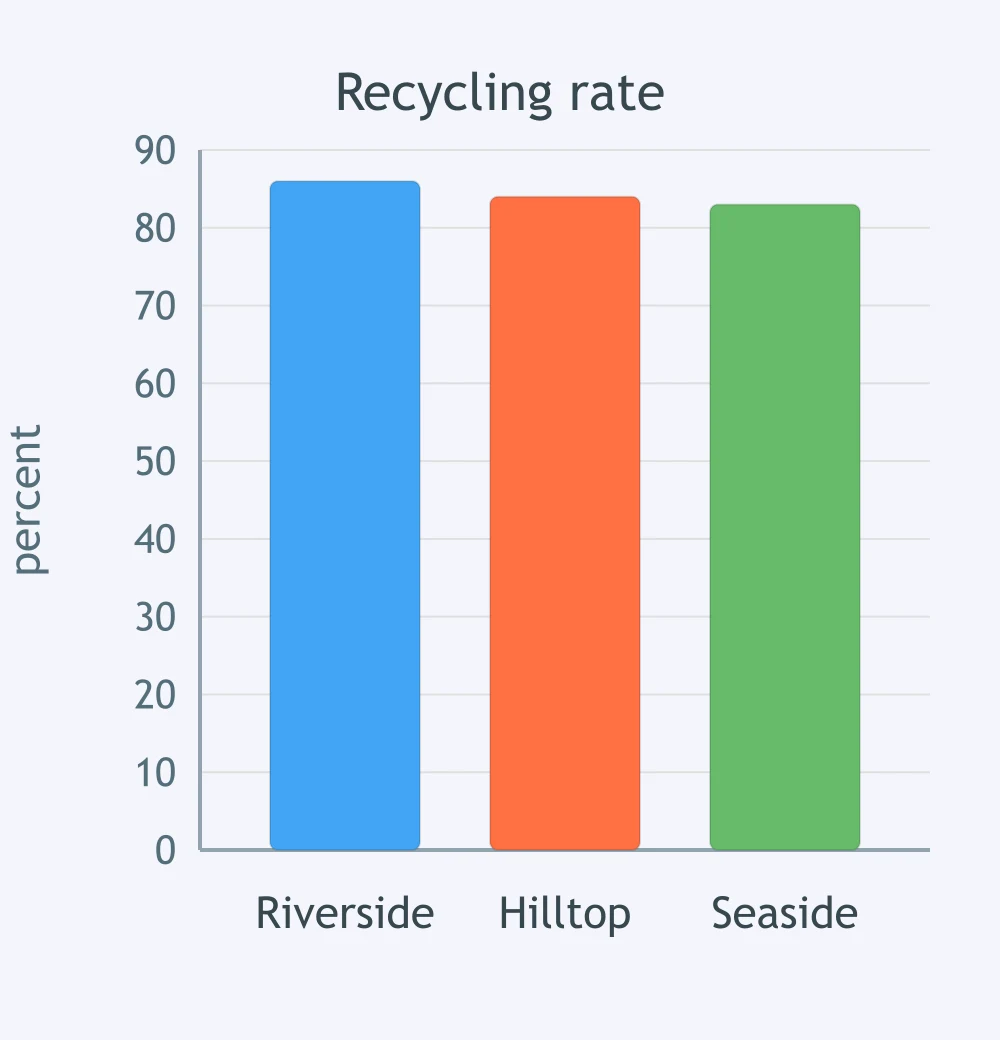
Look at the bar graph. What can a reader NOT tell from it?
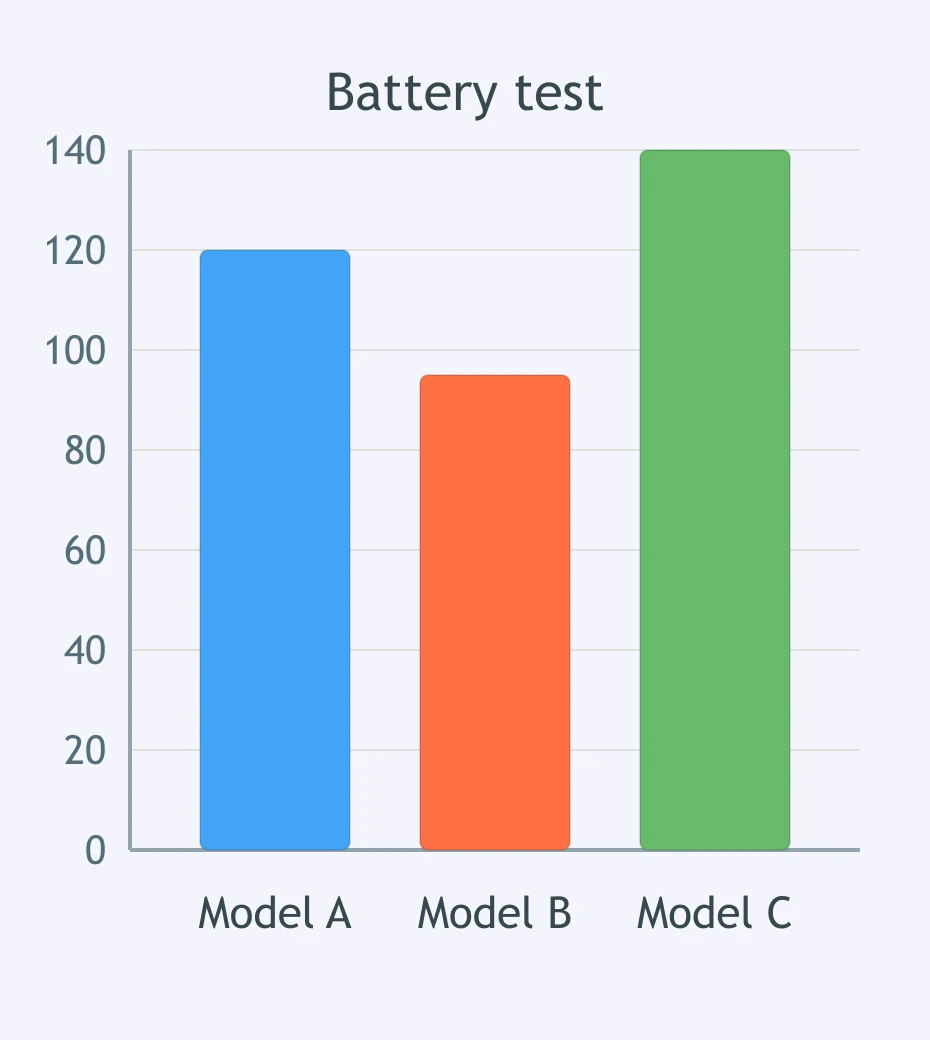
Look at the table. A report quotes only 2020 and 2023. Which fuller pattern does that selection hide?
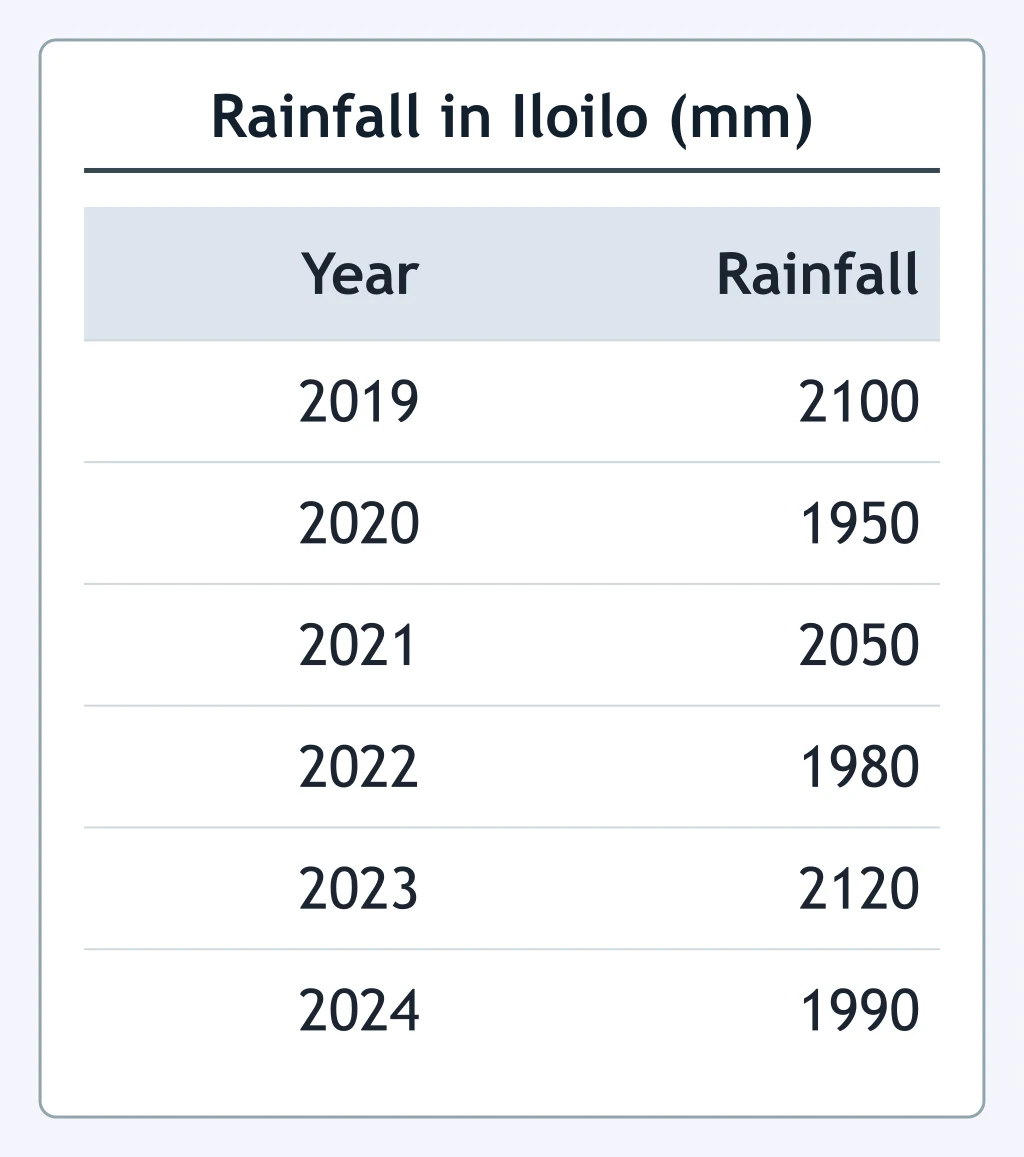
Look at the line graph. Which conclusion does this display NOT support?
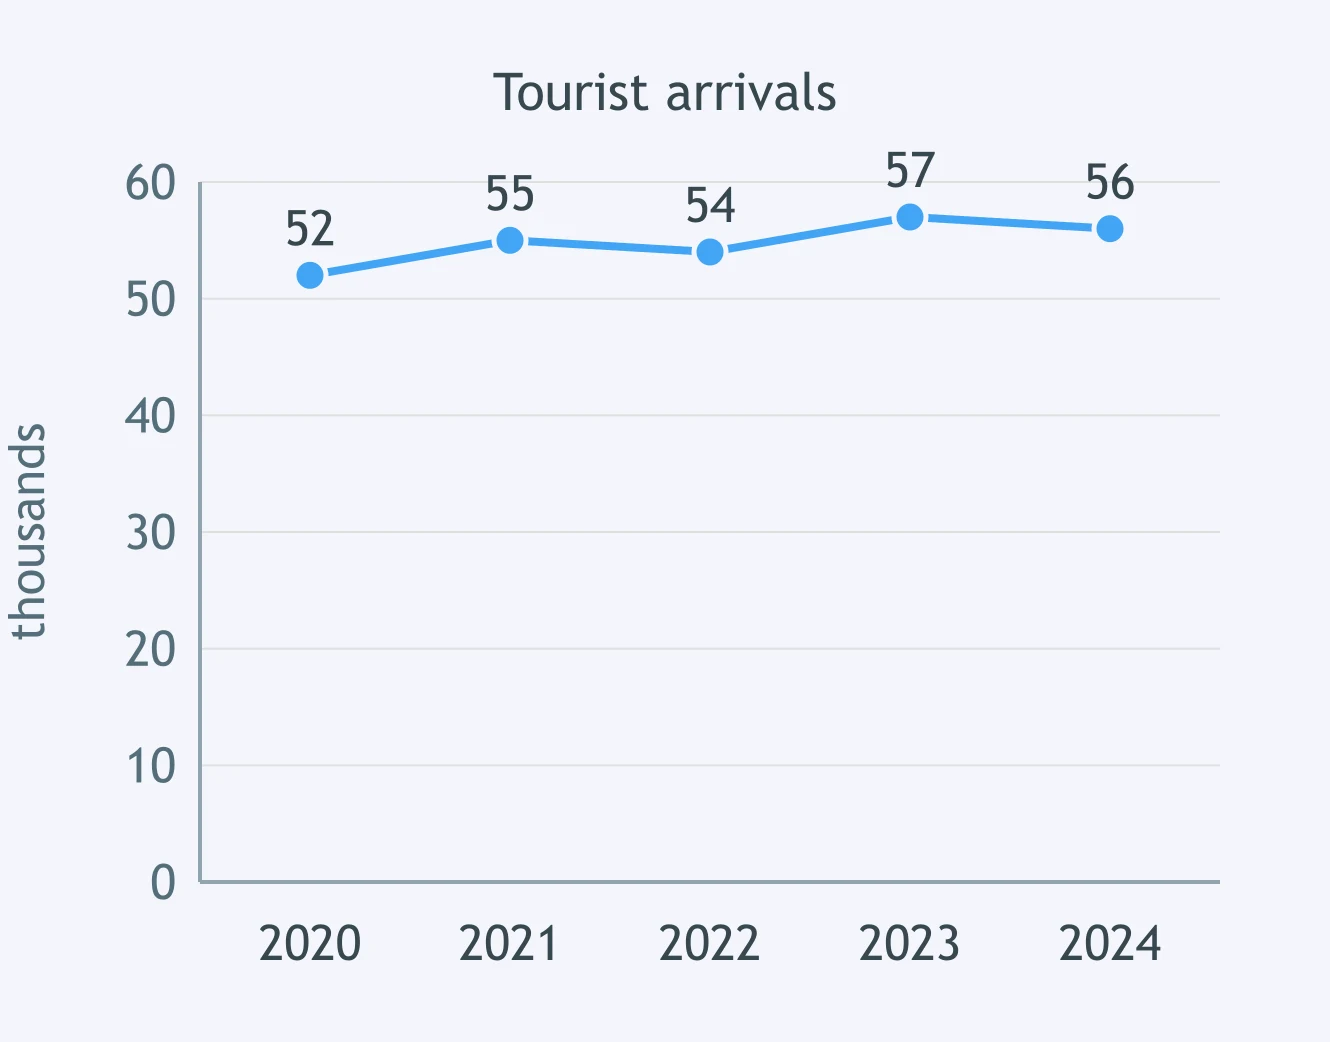
Look at the bar graph. A tarpaulin redraws it with the axis starting at 40. What would change?
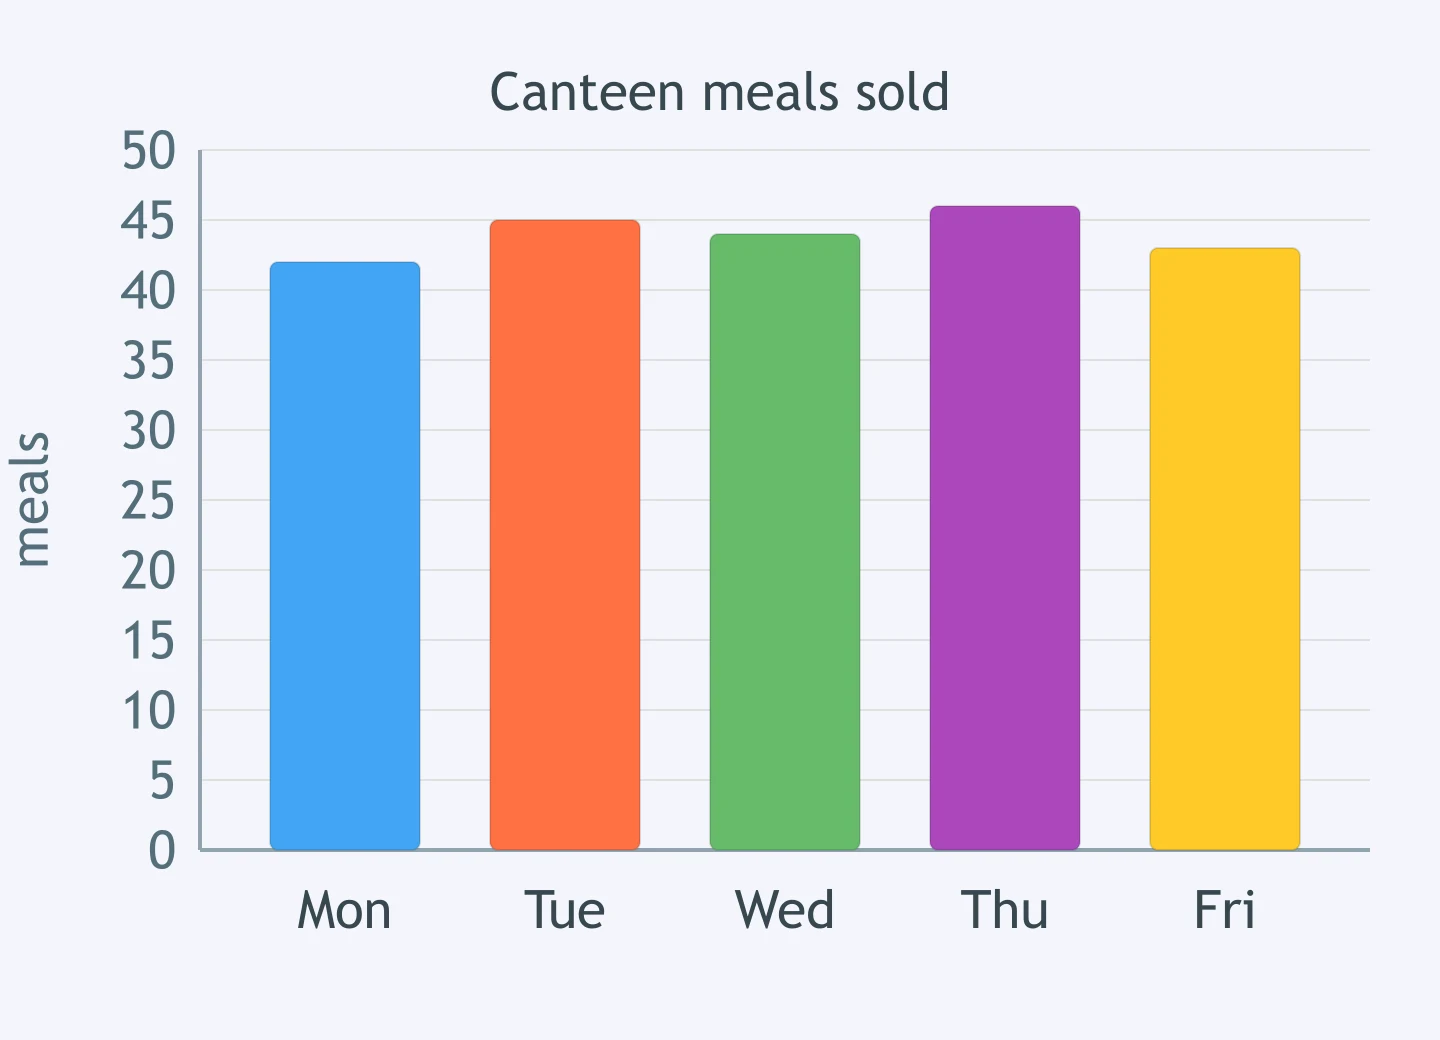
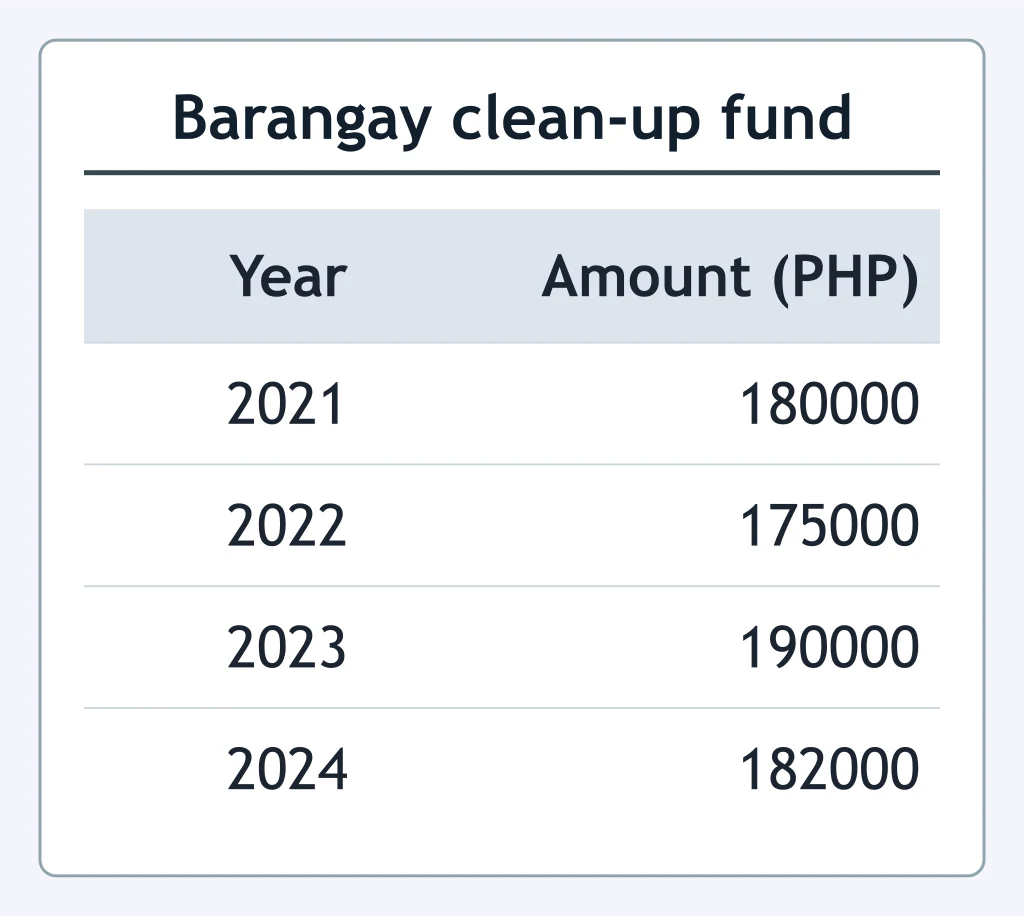
Look at the table. Which claim about the fund does it support?
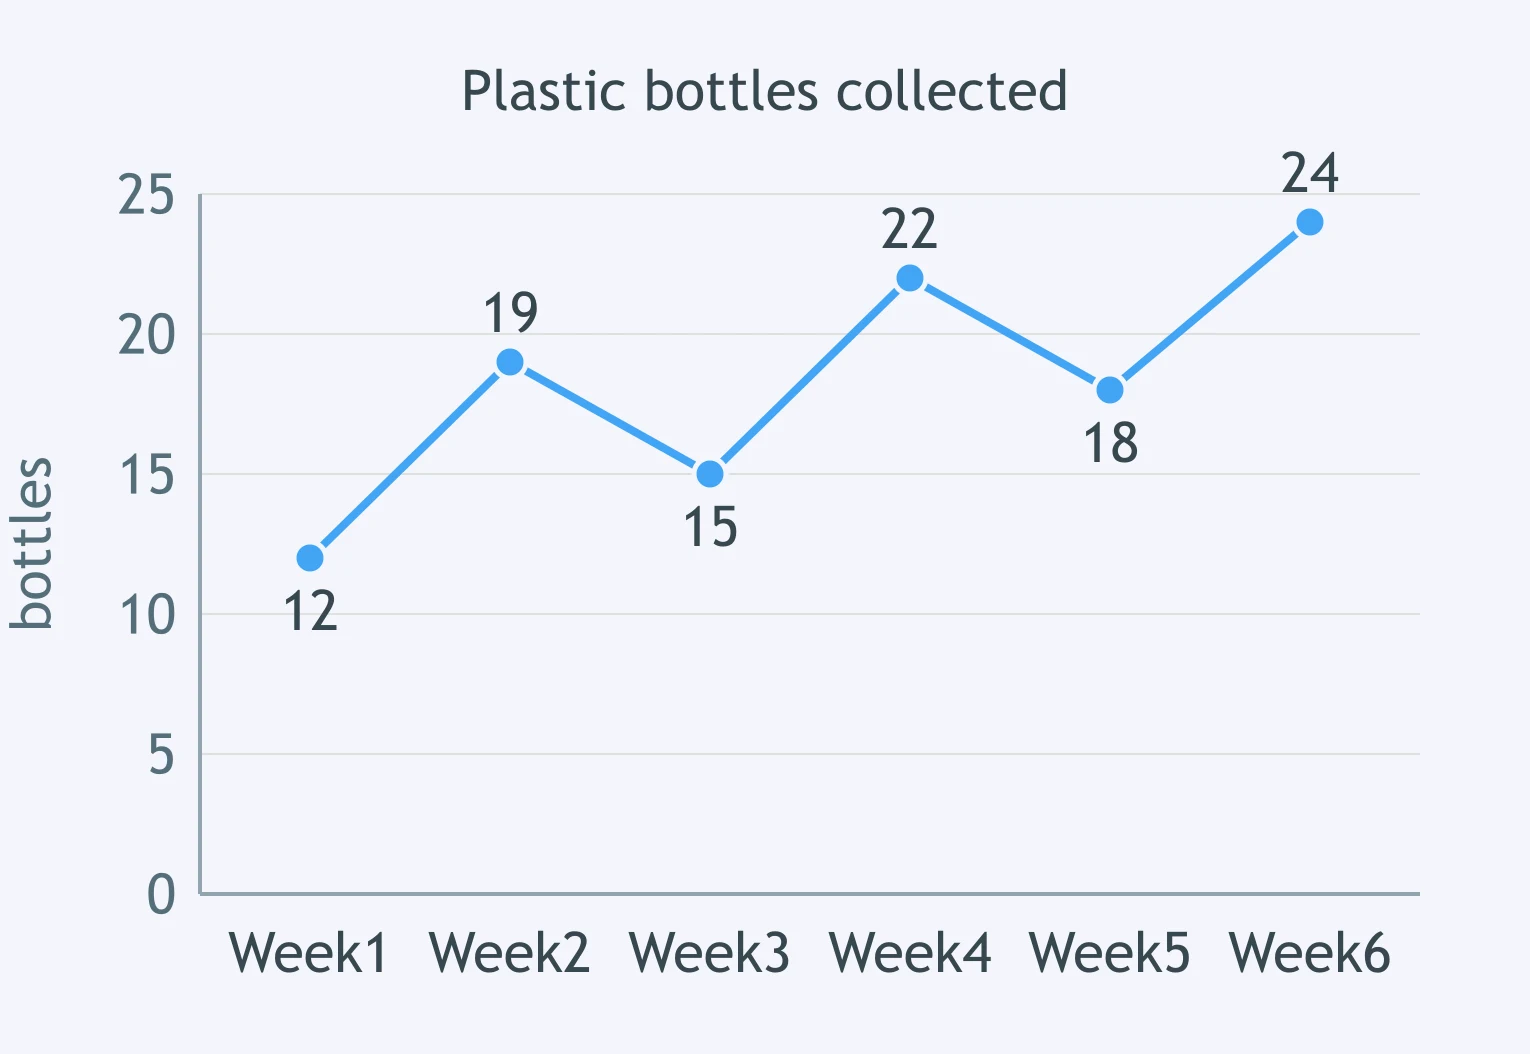
Look at the line graph. A club reports only week 1 and week 6. Which feature of the data disappears?
A bar graph of two candidates' votes starts its vertical axis at 4500 instead of zero. What does this do?
A chart's bars have no zero line, and its axis begins at a value it never states. Which part of the display is missing?
A bar graph uses one color and no gridlines, but starts at zero and names its units. What best describes it?
Which of these displays misleads the reader?
A shop graphs its sales for the two weeks before Christmas and titles the graph Our Year of Growth. What is the fault?
A line graph's vertical axis runs from 98 to 102, and the line climbs steeply. What is the largest change the data can show?
Which readings would best test a claim that a river's water level is rising over time?
A student must show how one total is divided among four parts. Which display fits that information best?
A graph can report every value correctly and still mislead through the scale it uses.
Two versions of one graph differ only in where the axis starts. Which one shows the true size of the difference?
A report graphs one farm's rice harvest for three years and says yields are falling for good. Which weakness does the display have?
A chart labels every bar, starts at zero and names its units, but it has no legend. What should a reader conclude?
Crack the passcode before the zombies get in.

Pick a tile, answer, hit bonuses and steals.

Credibility of the Author
20 questions