Loading
by BlastRoom
Read values, trends and comparisons off a bar graph, line graph or table, and judge what each display does not show.
#nonlinear_texts#matatag_english_7
20 questions
One question set, multiple game modes. Tap any game to see it in action. Not sure which to pick?
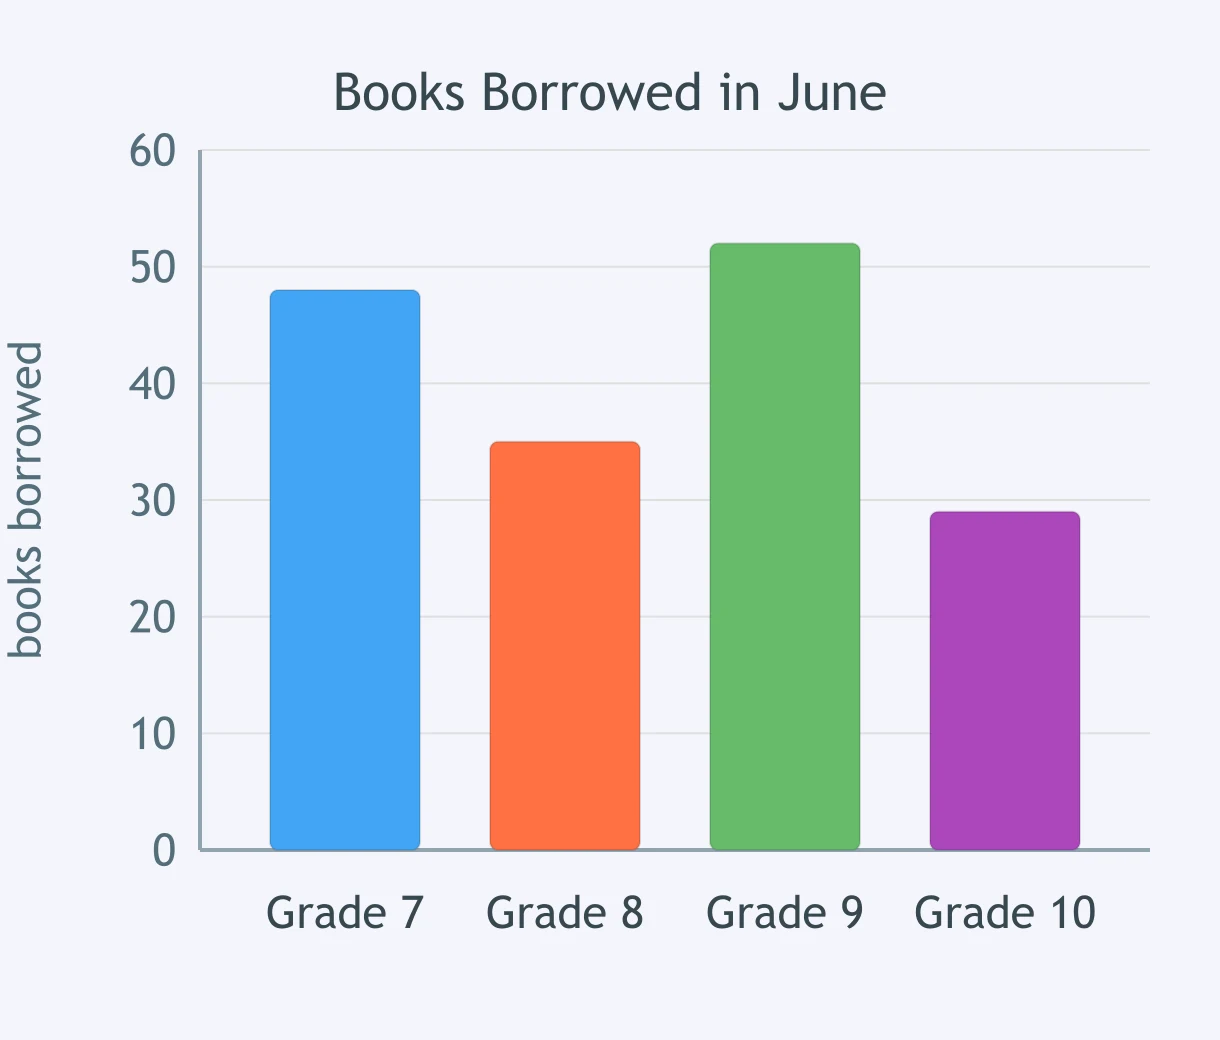
Look at the bar graph. How many books did Grade 9 borrow in June?
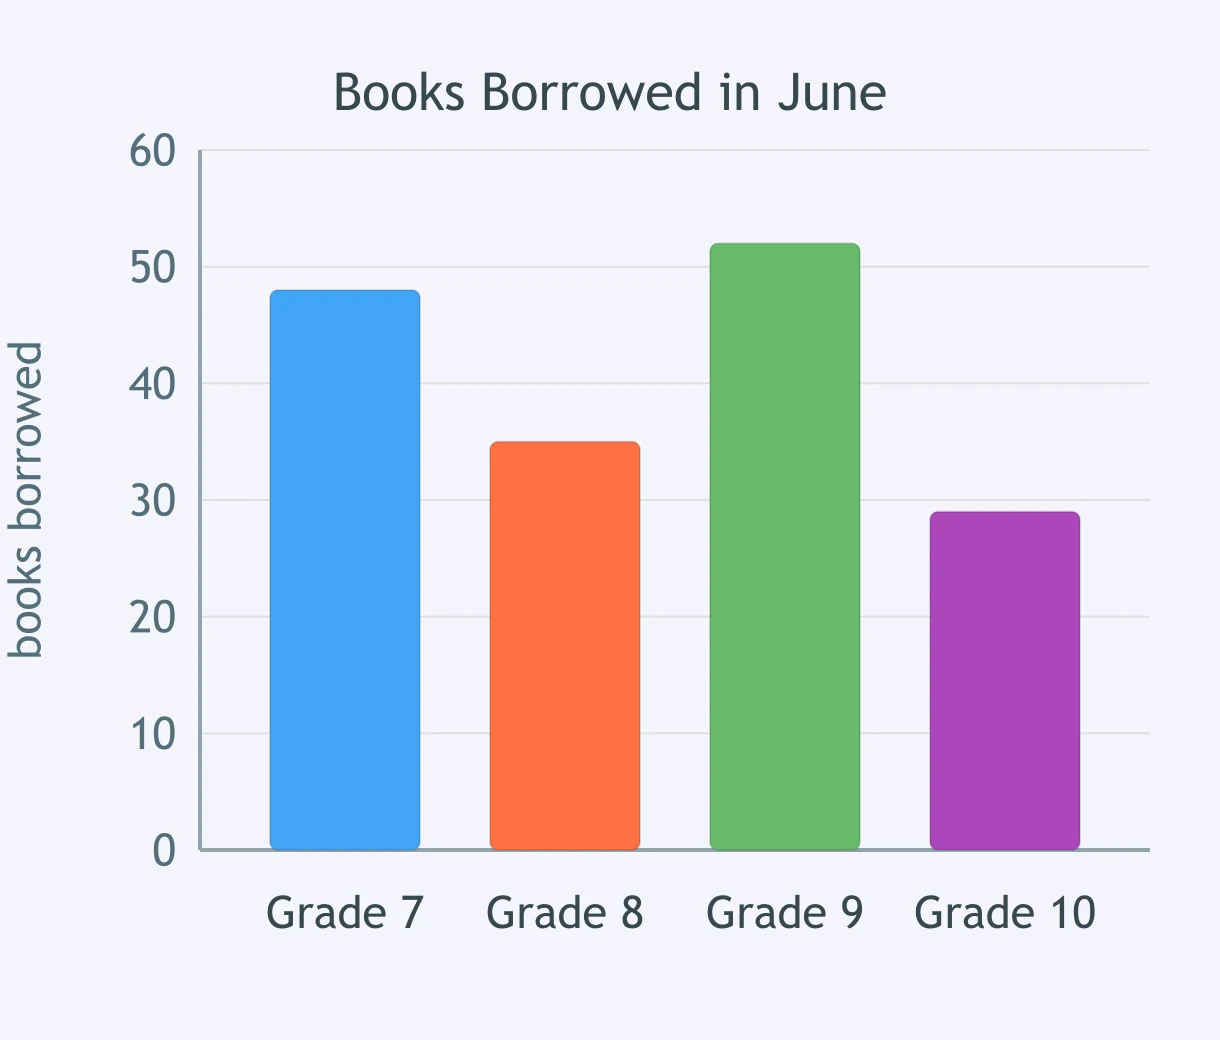
Look at the bar graph. How many more books did Grade 7 borrow than Grade 10?
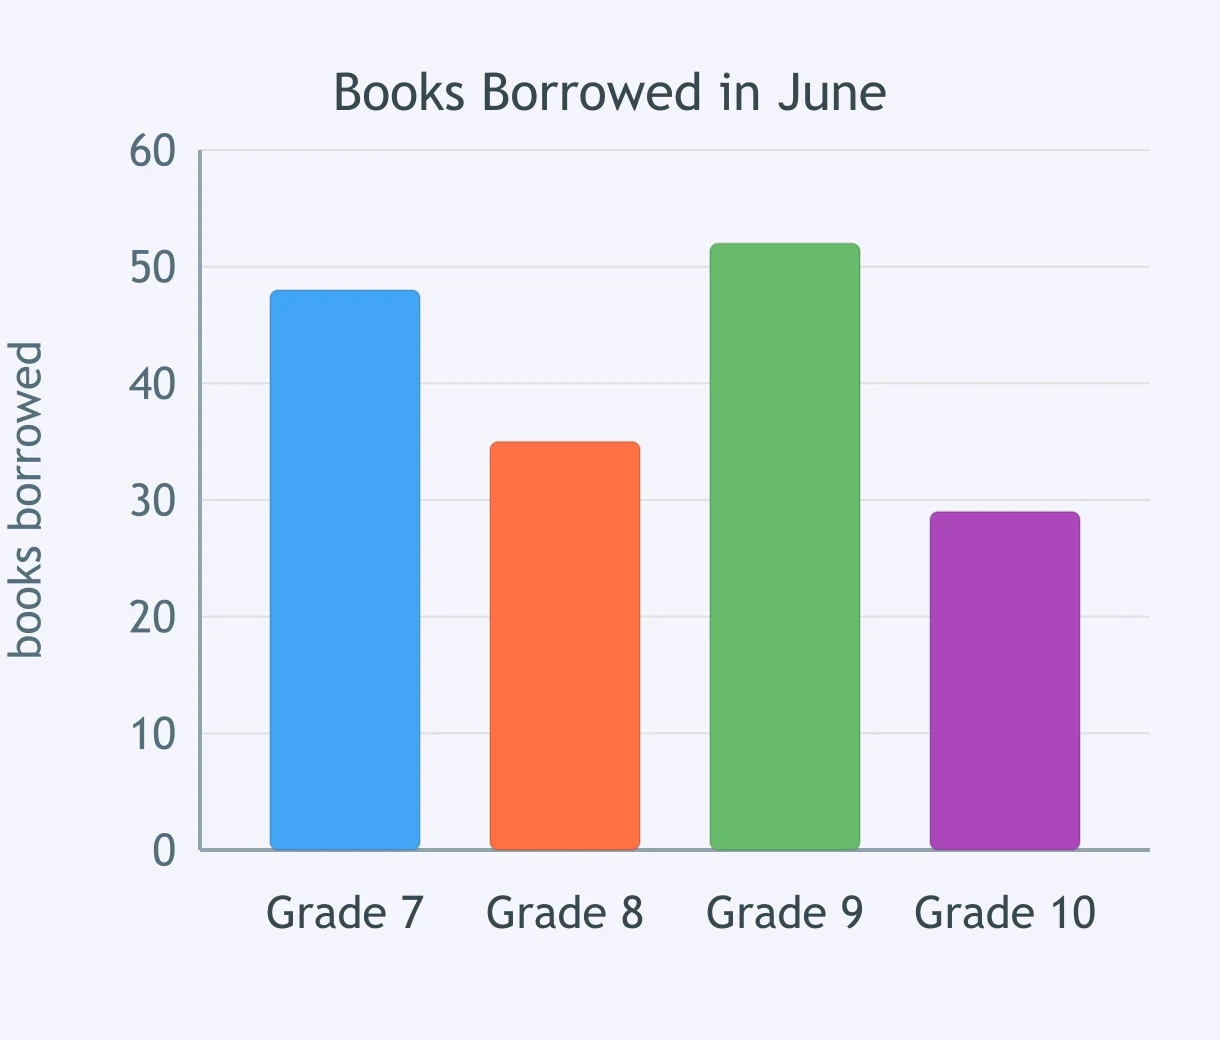
In this bar graph, what does the height of each bar measure?
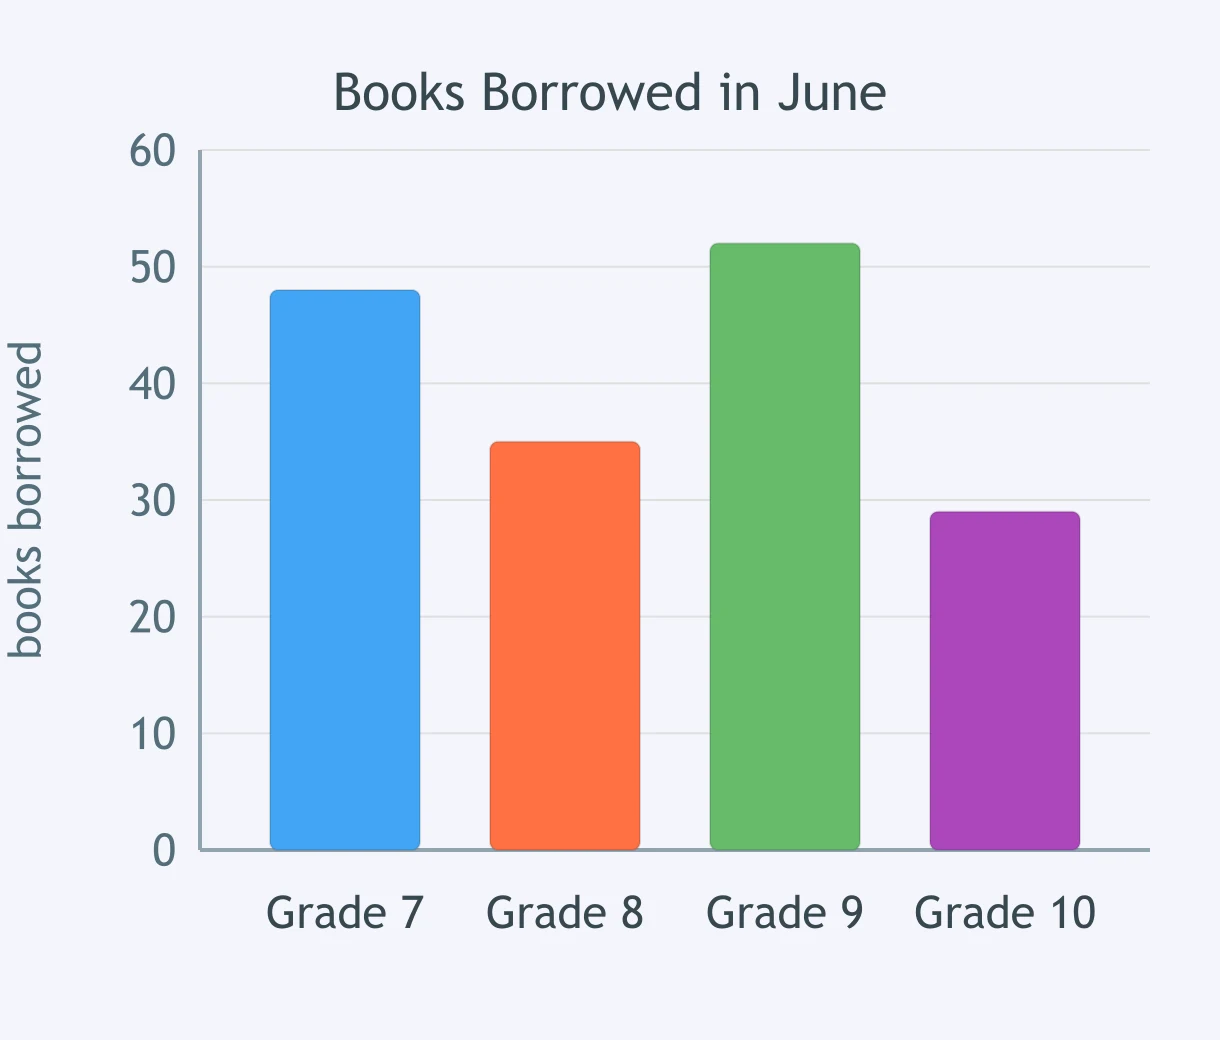
Which conclusion does this bar graph NOT support?
Look at the line graph. What happened to clinic visits from Week 1 to Week 4?
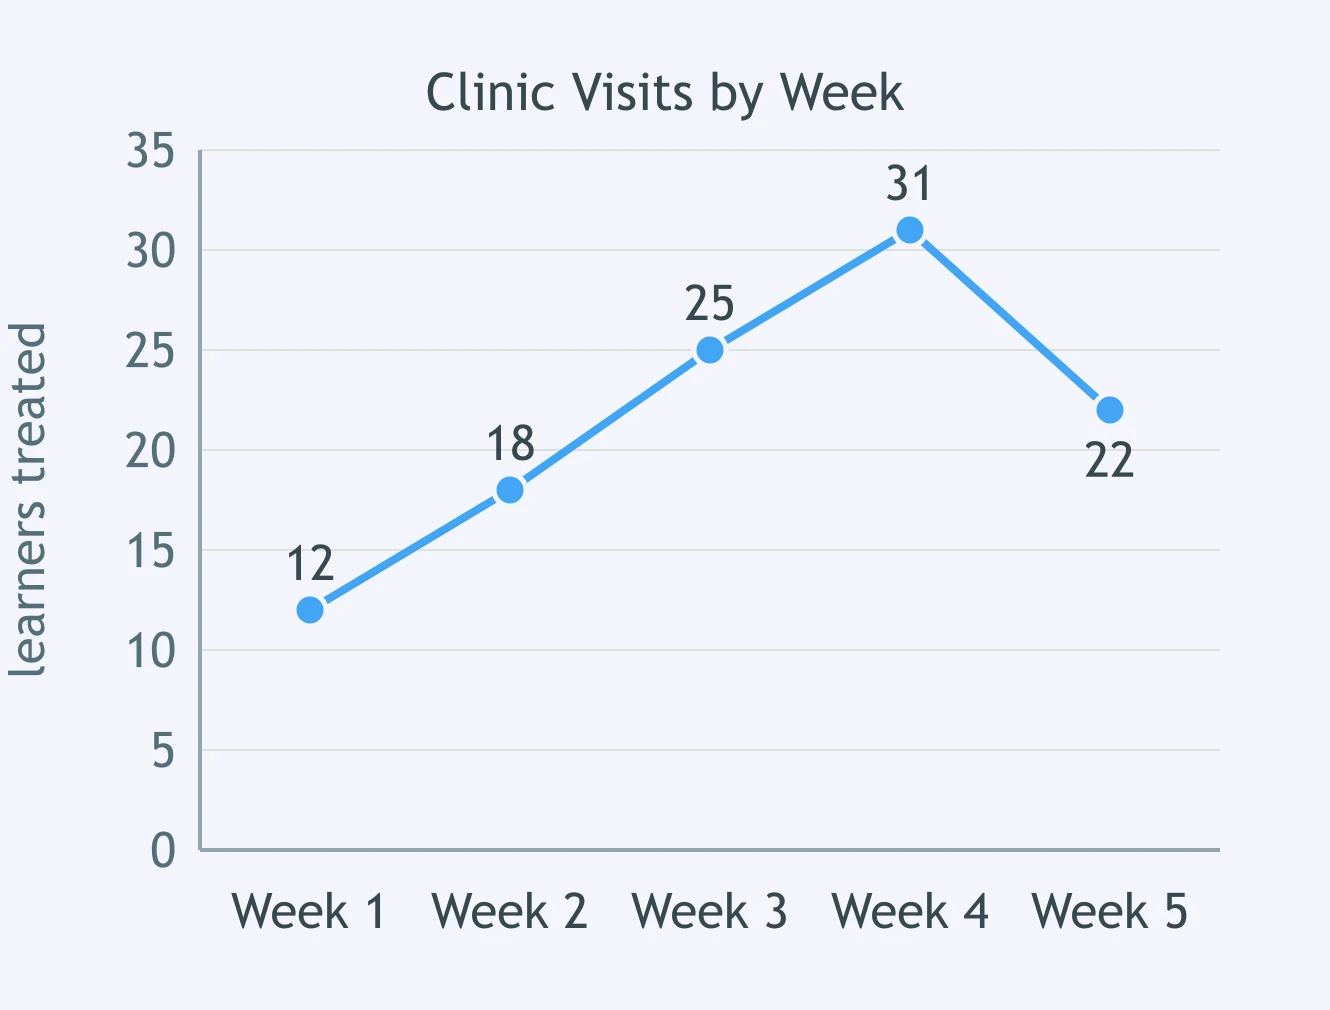
In this line graph, what does the horizontal axis show?
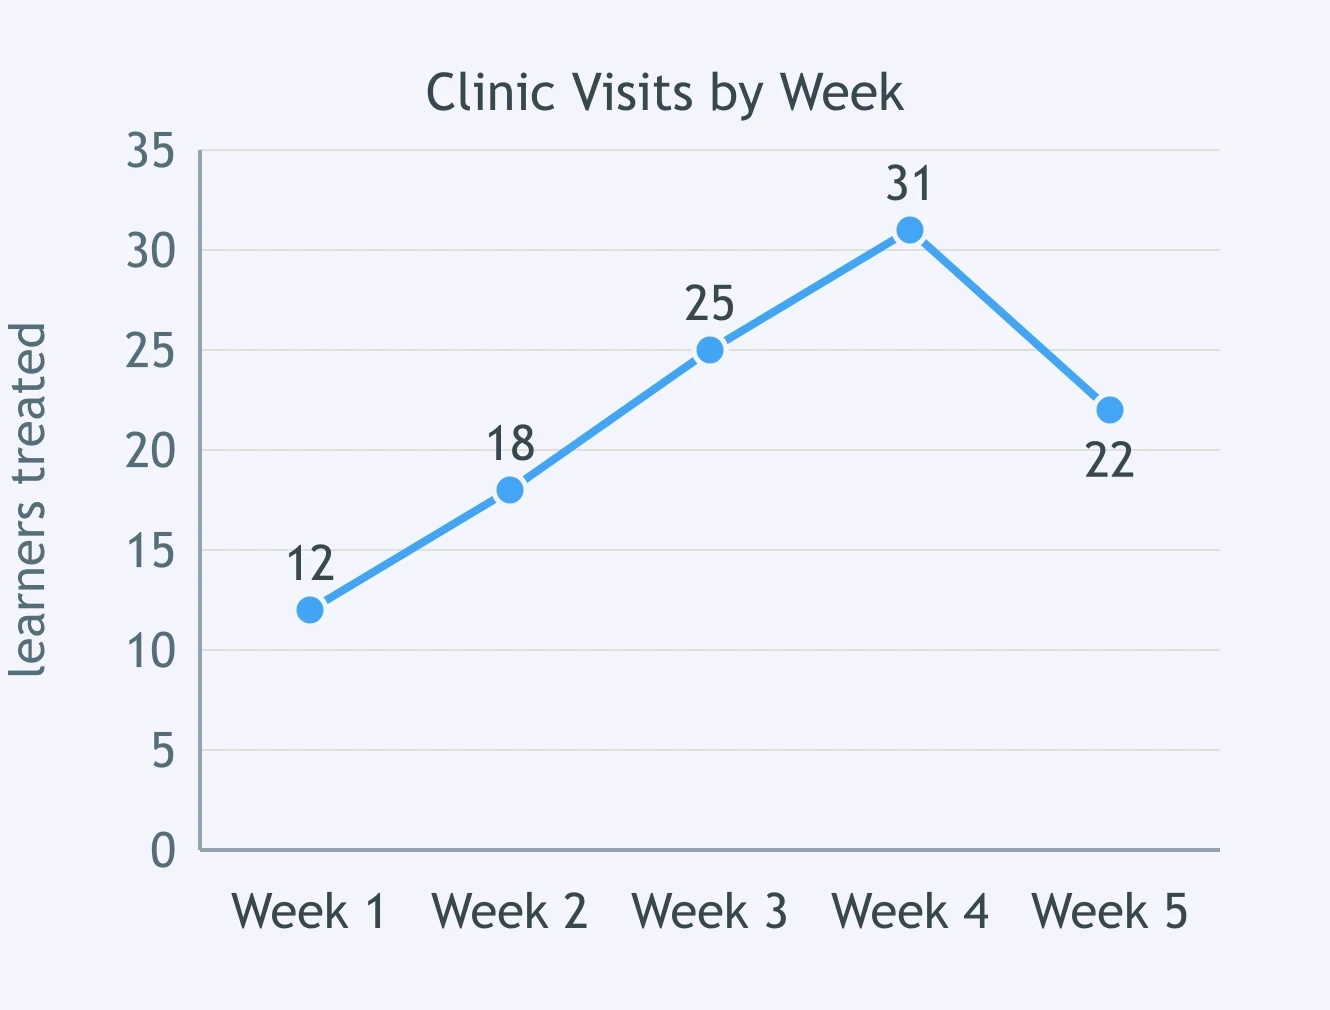
Look at the line graph. Between which two weeks did the number of visits drop?
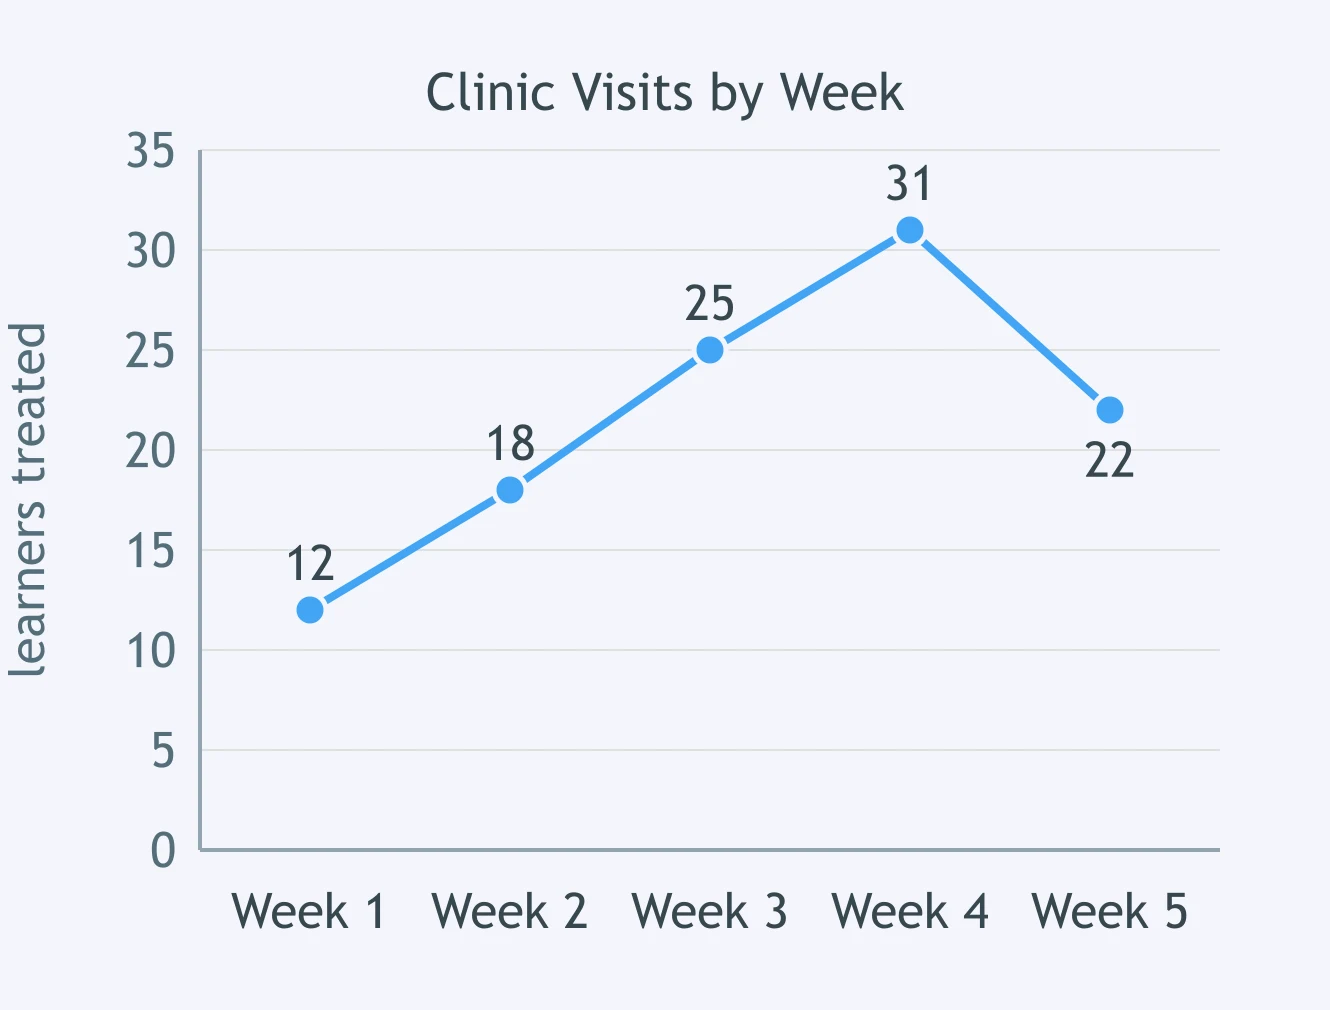
Which conclusion does this line graph NOT support?
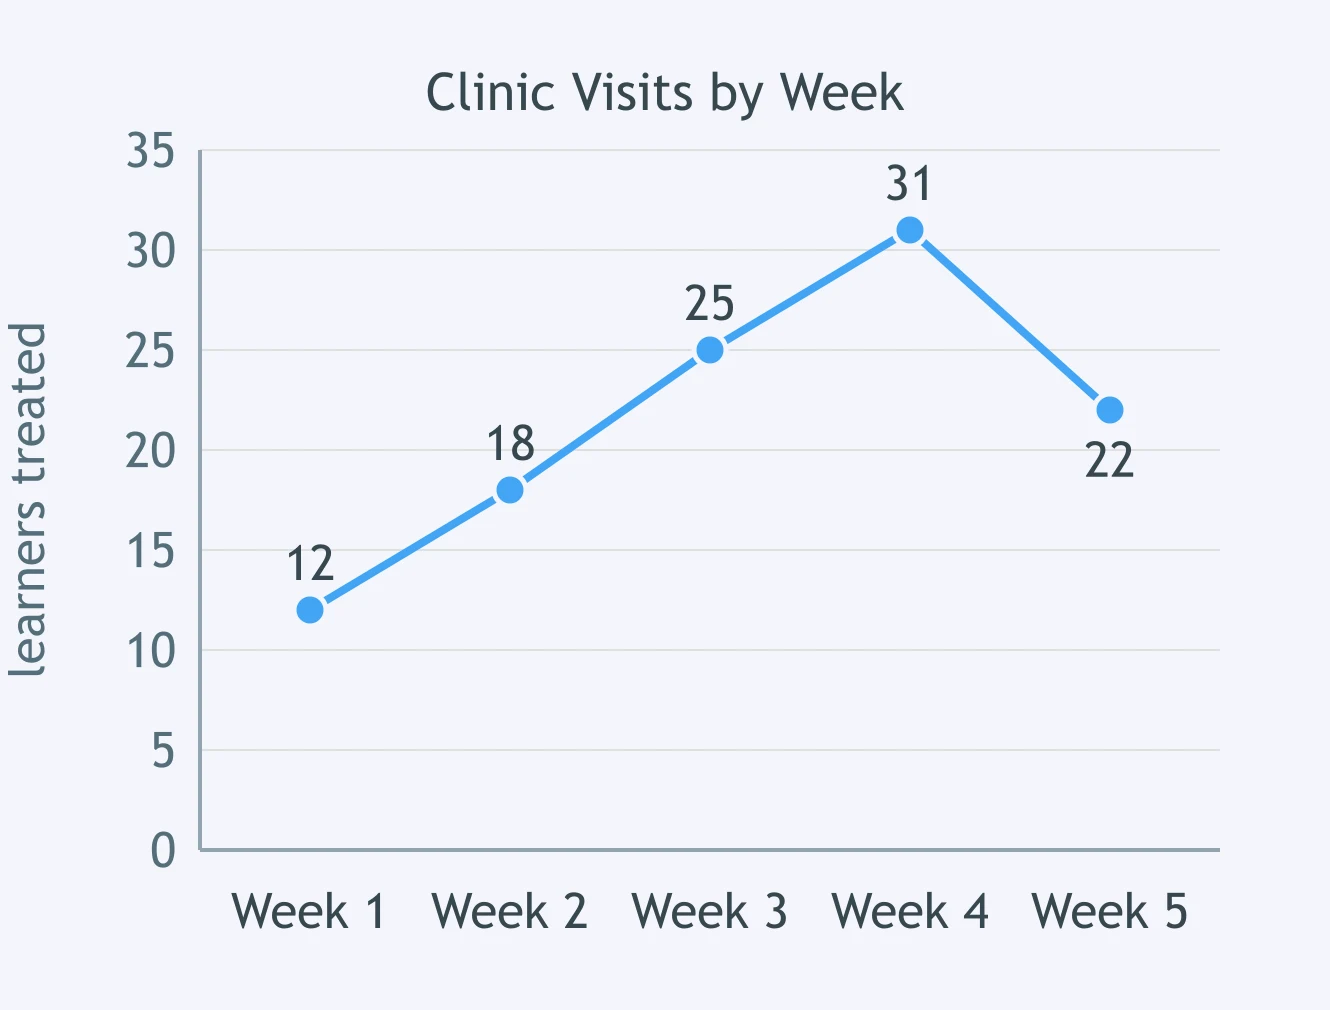
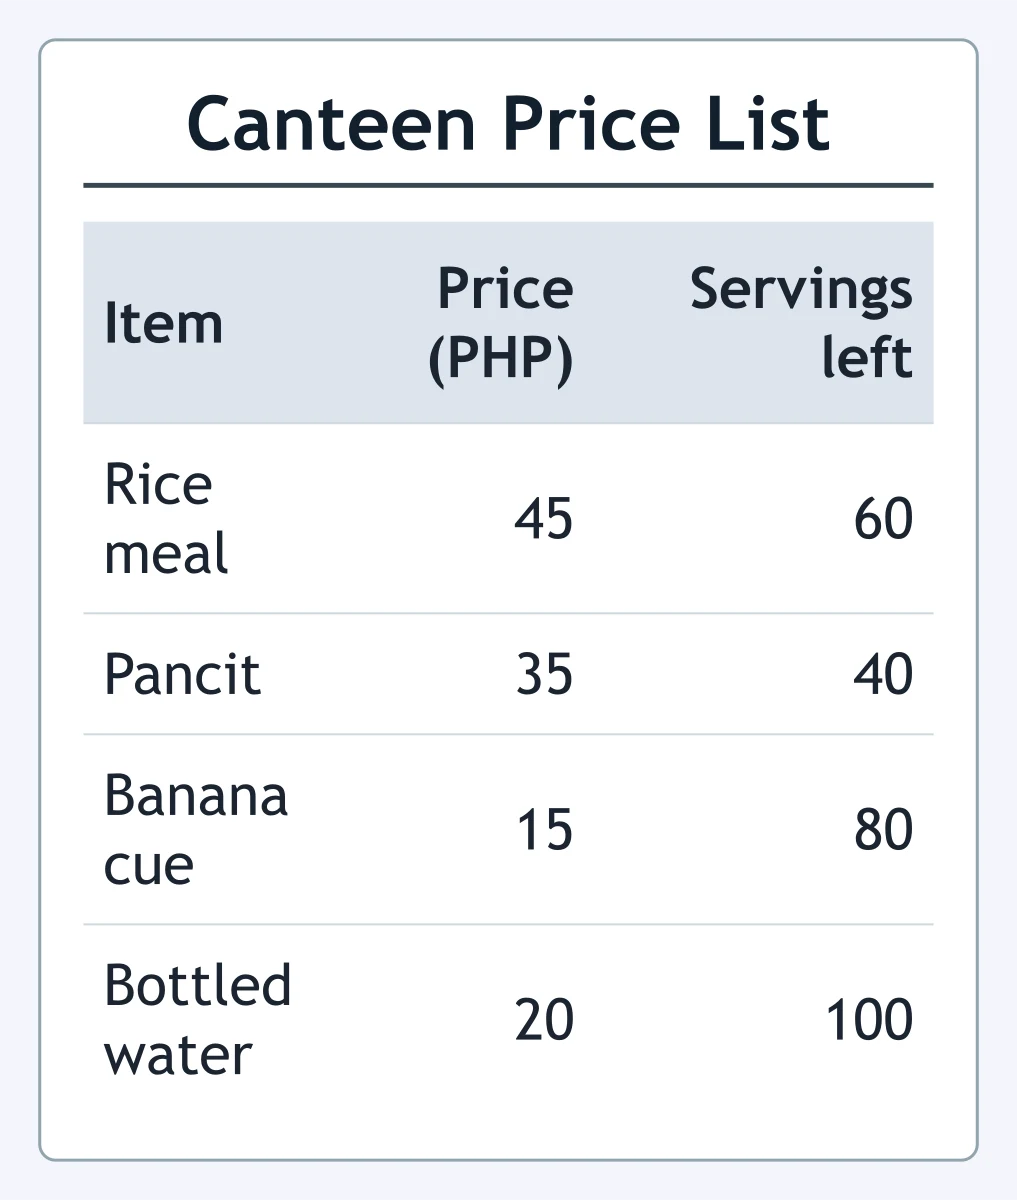
Look at the table. How much does one serving of pancit cost?
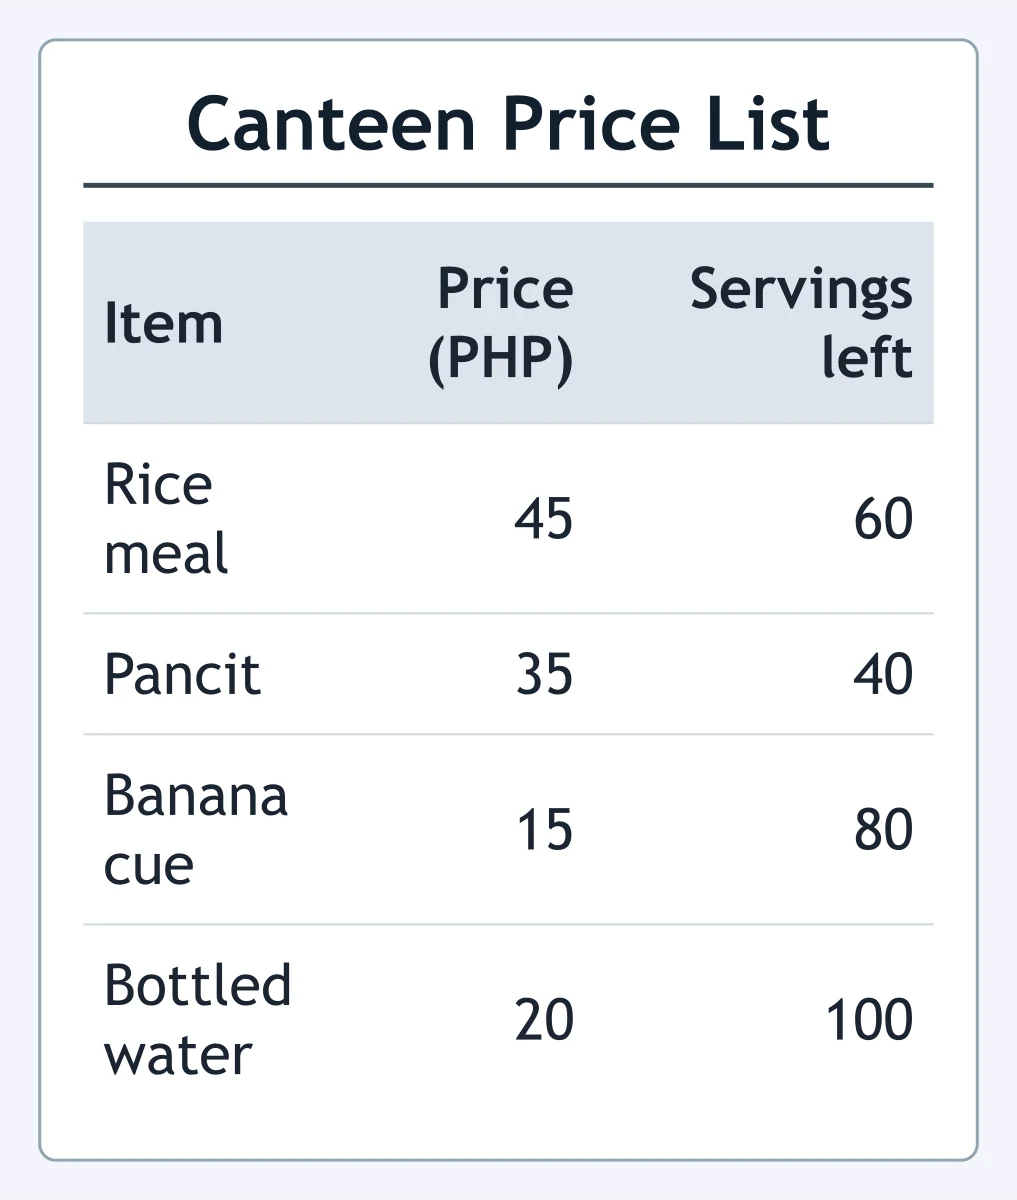
Look at the table. Which item has the most servings left?
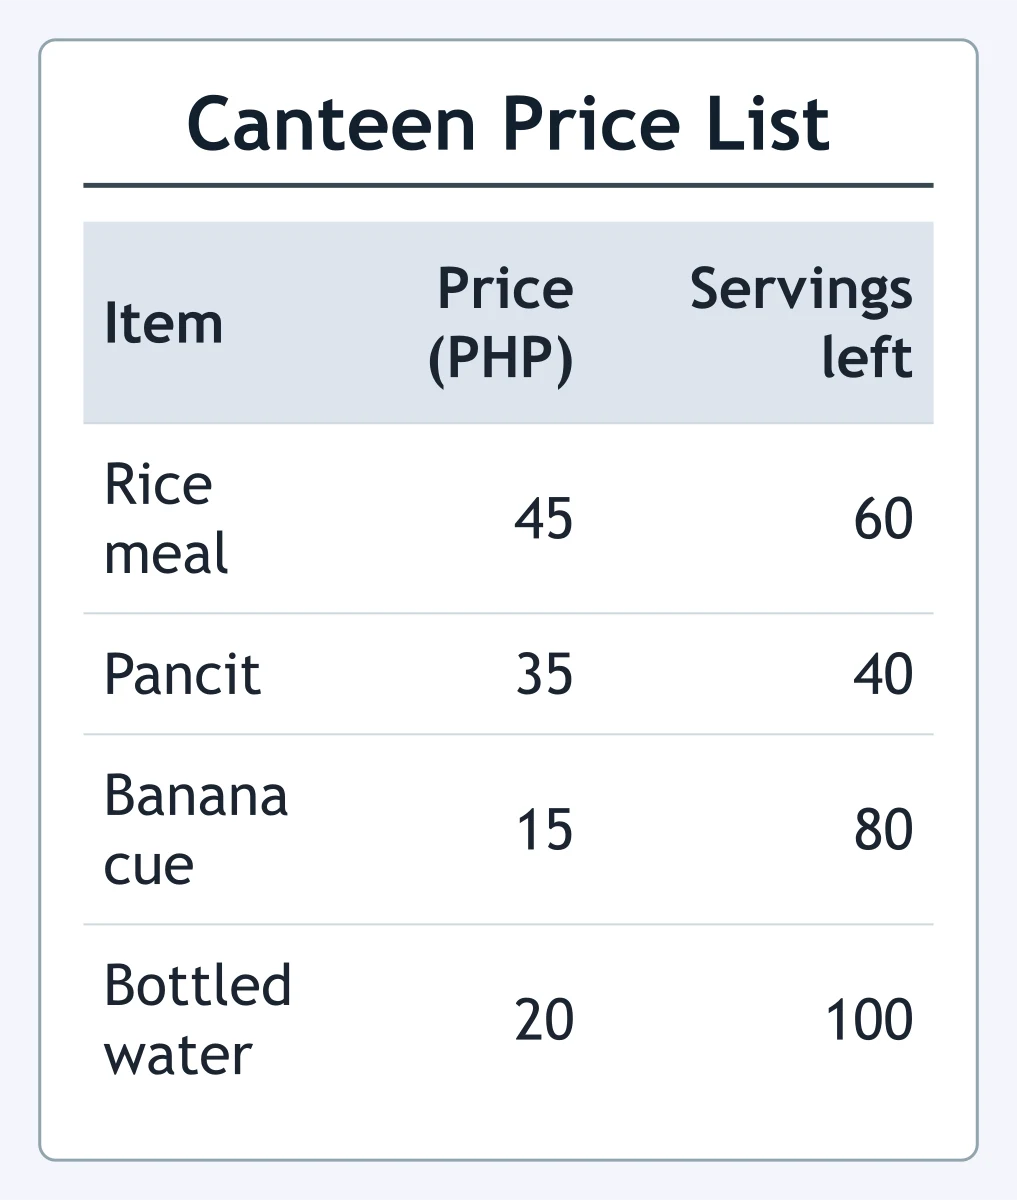
In this price list, what does the third column tell the reader?
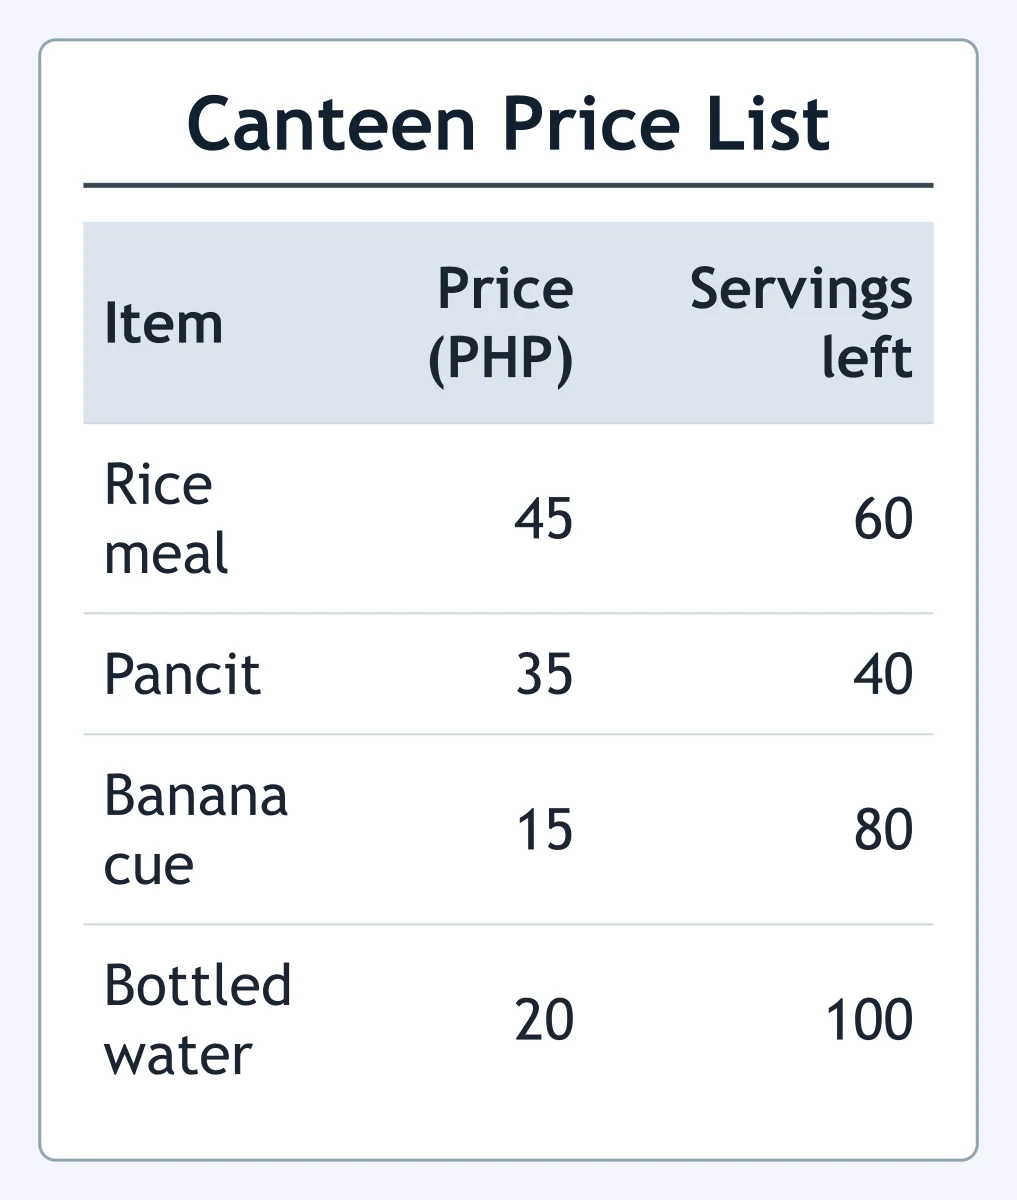
Look at the table. A learner buys one rice meal and one bottled water. What is the total cost?
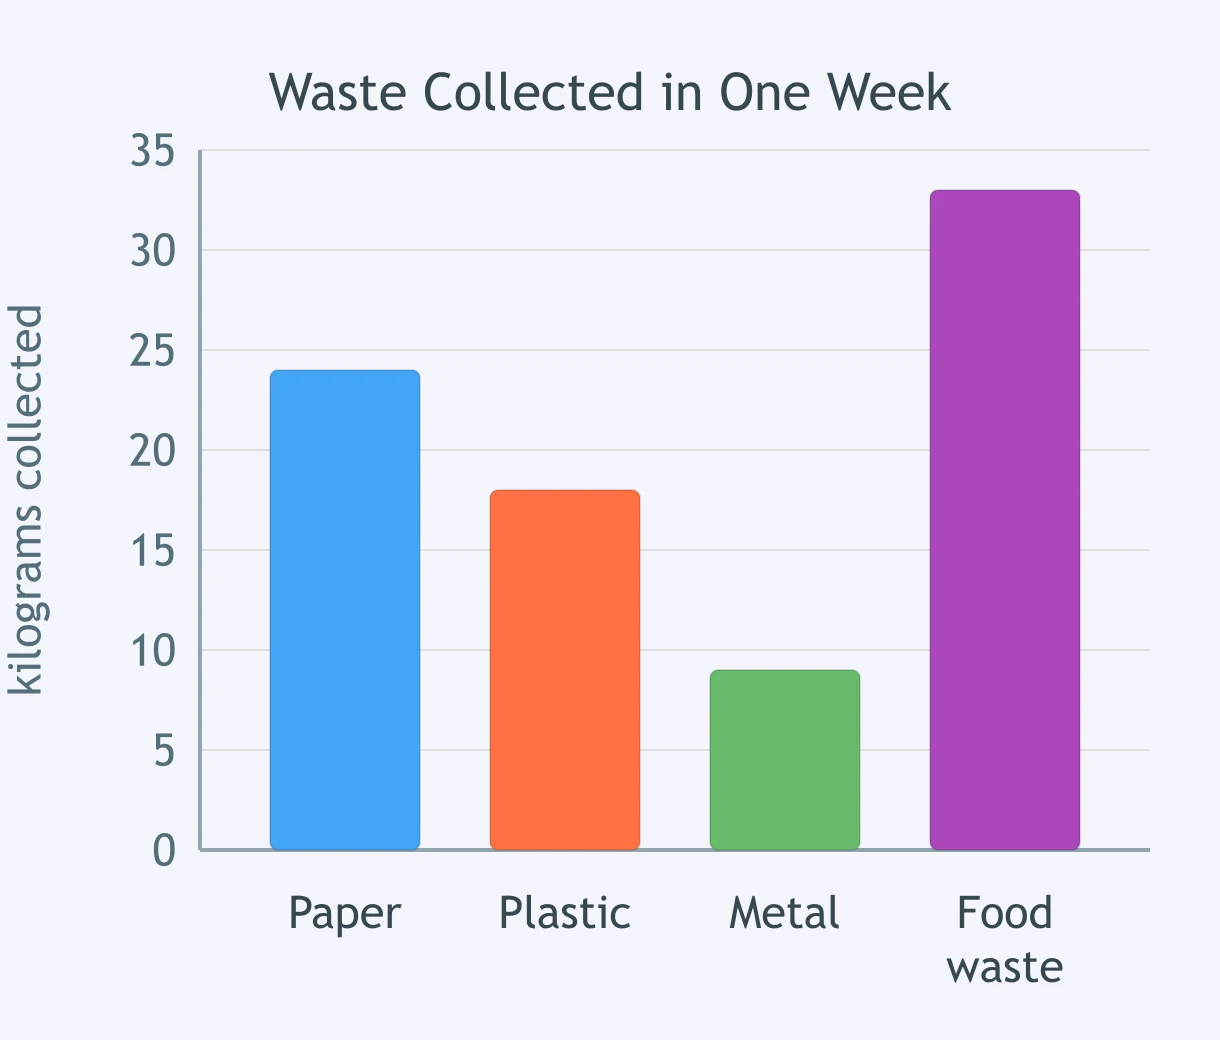
Look at the bar graph. How many kilograms of plastic were collected?
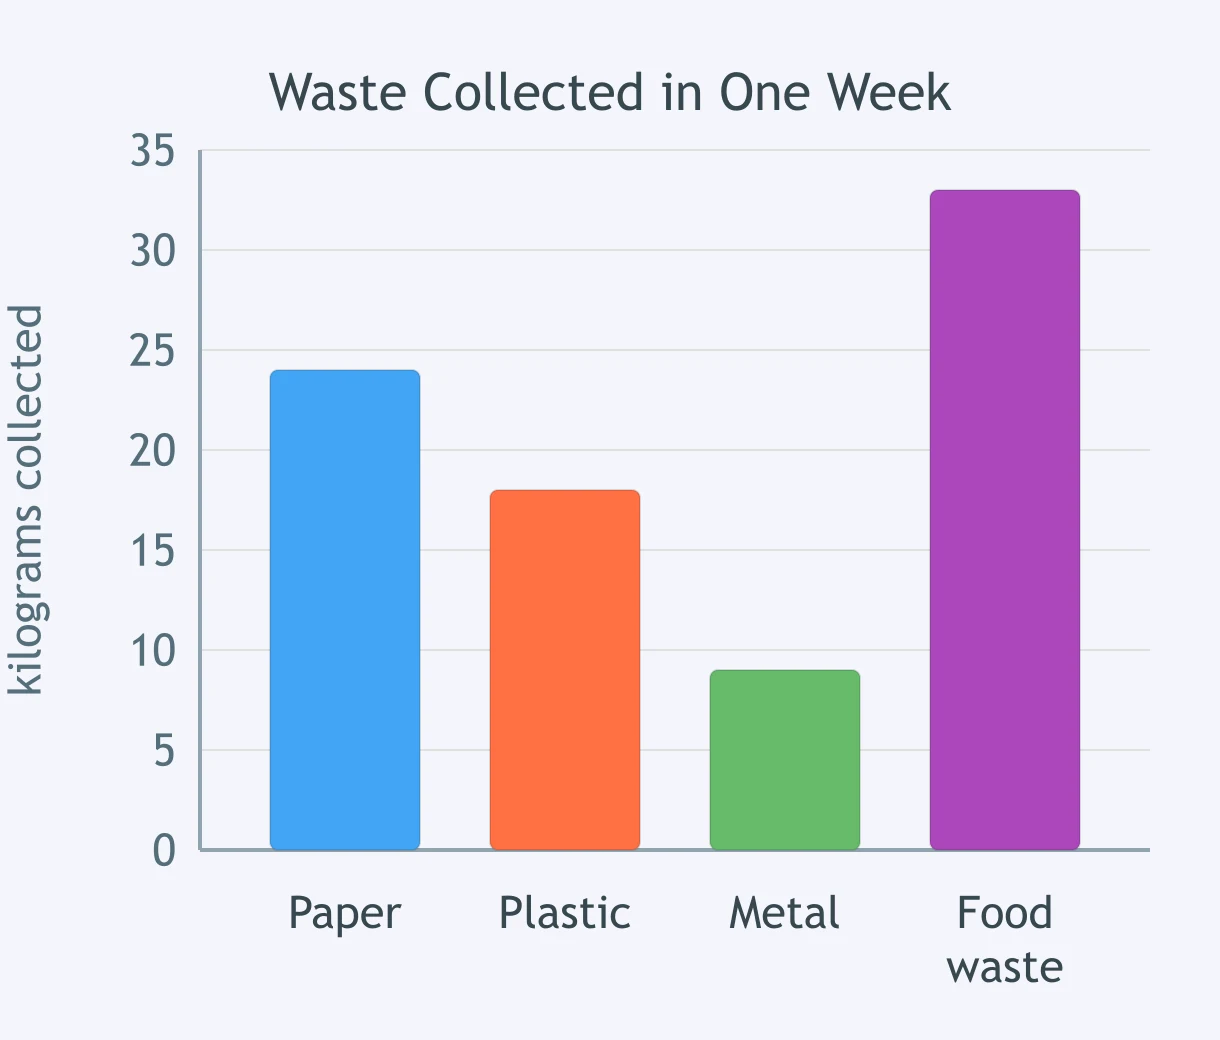
Look at the bar graph. Which kind of waste was collected in the smallest amount?
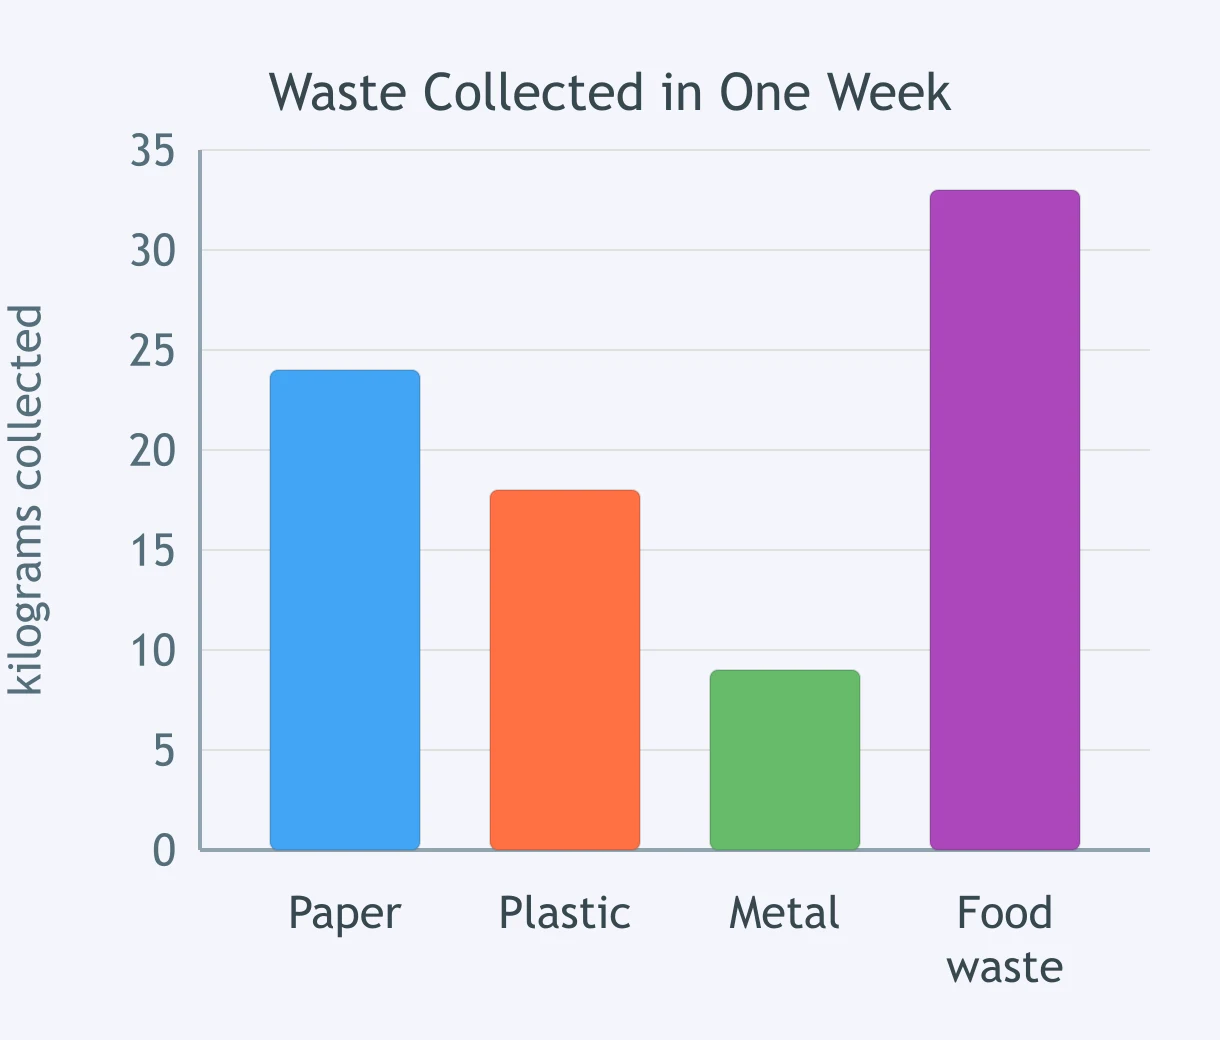
In this bar graph, which unit measures the waste that was collected?
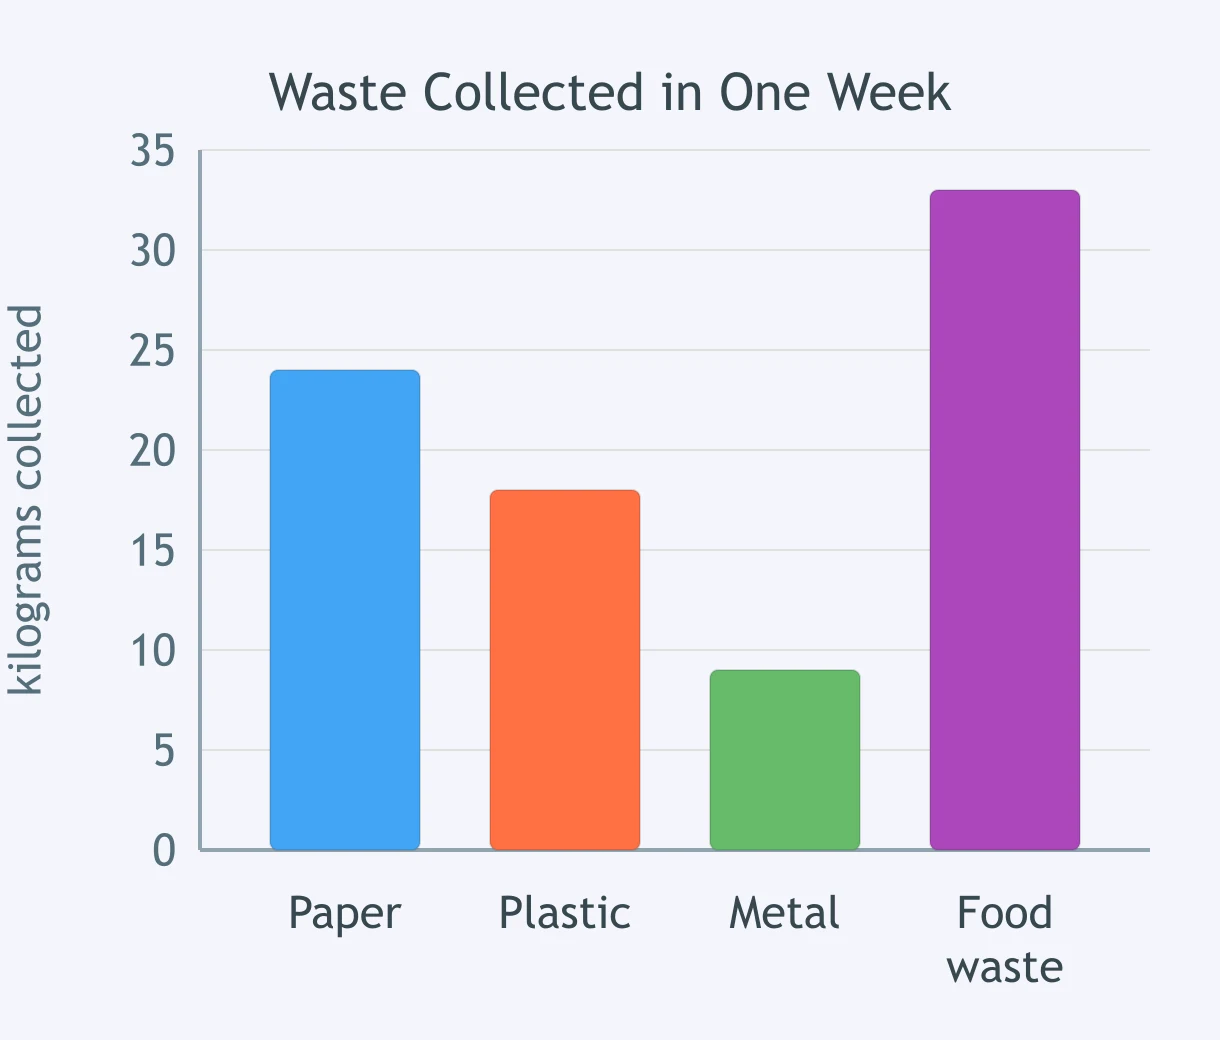
Which question can this bar graph NOT answer?
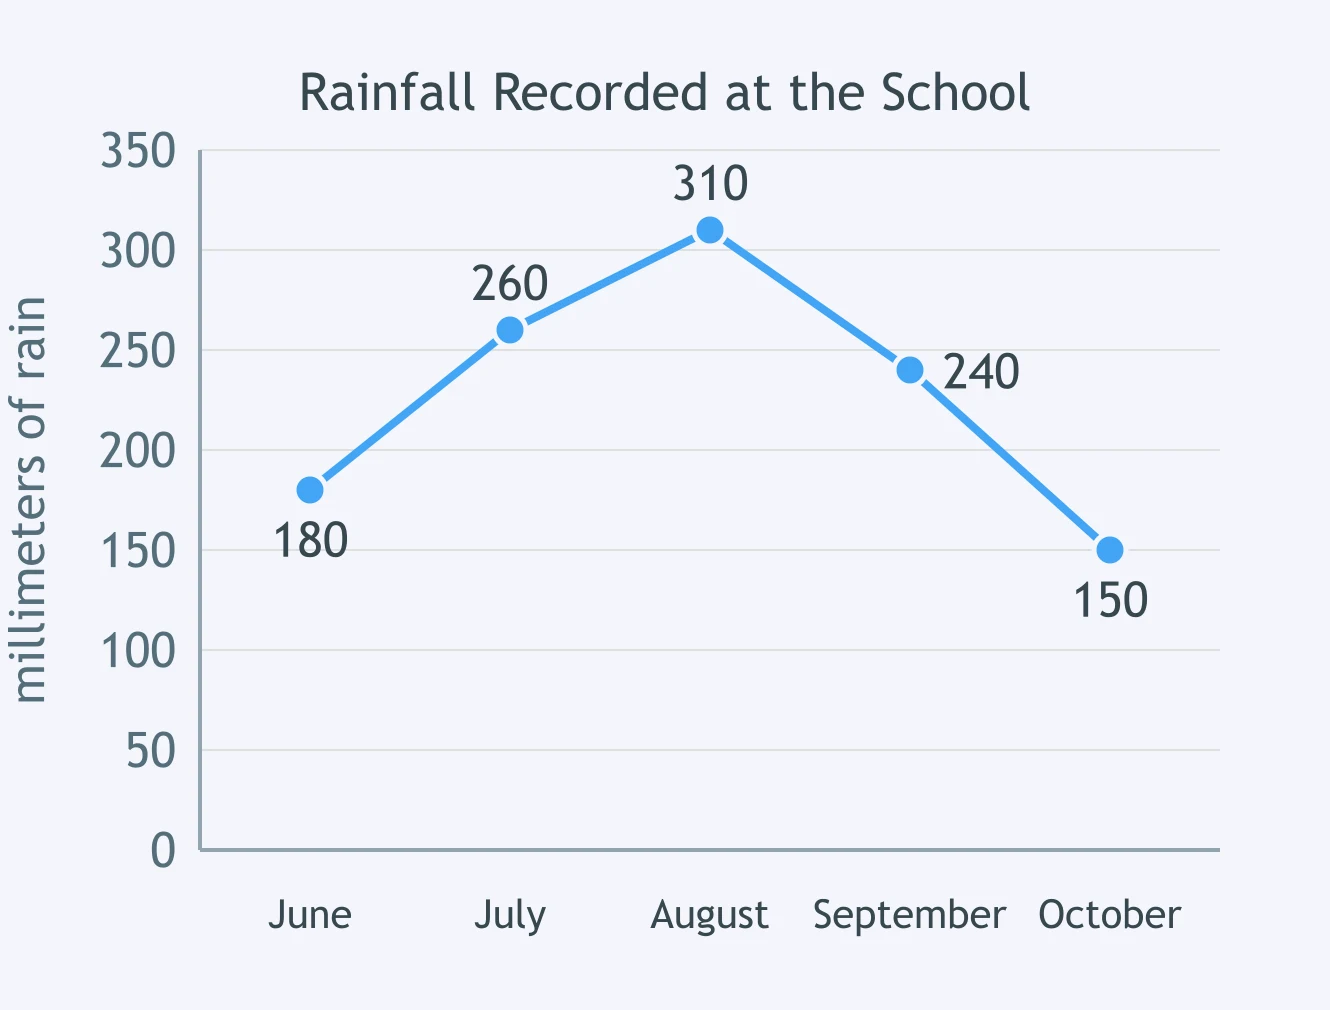
Look at the line graph. In which month did the recorded rainfall reach its highest point?
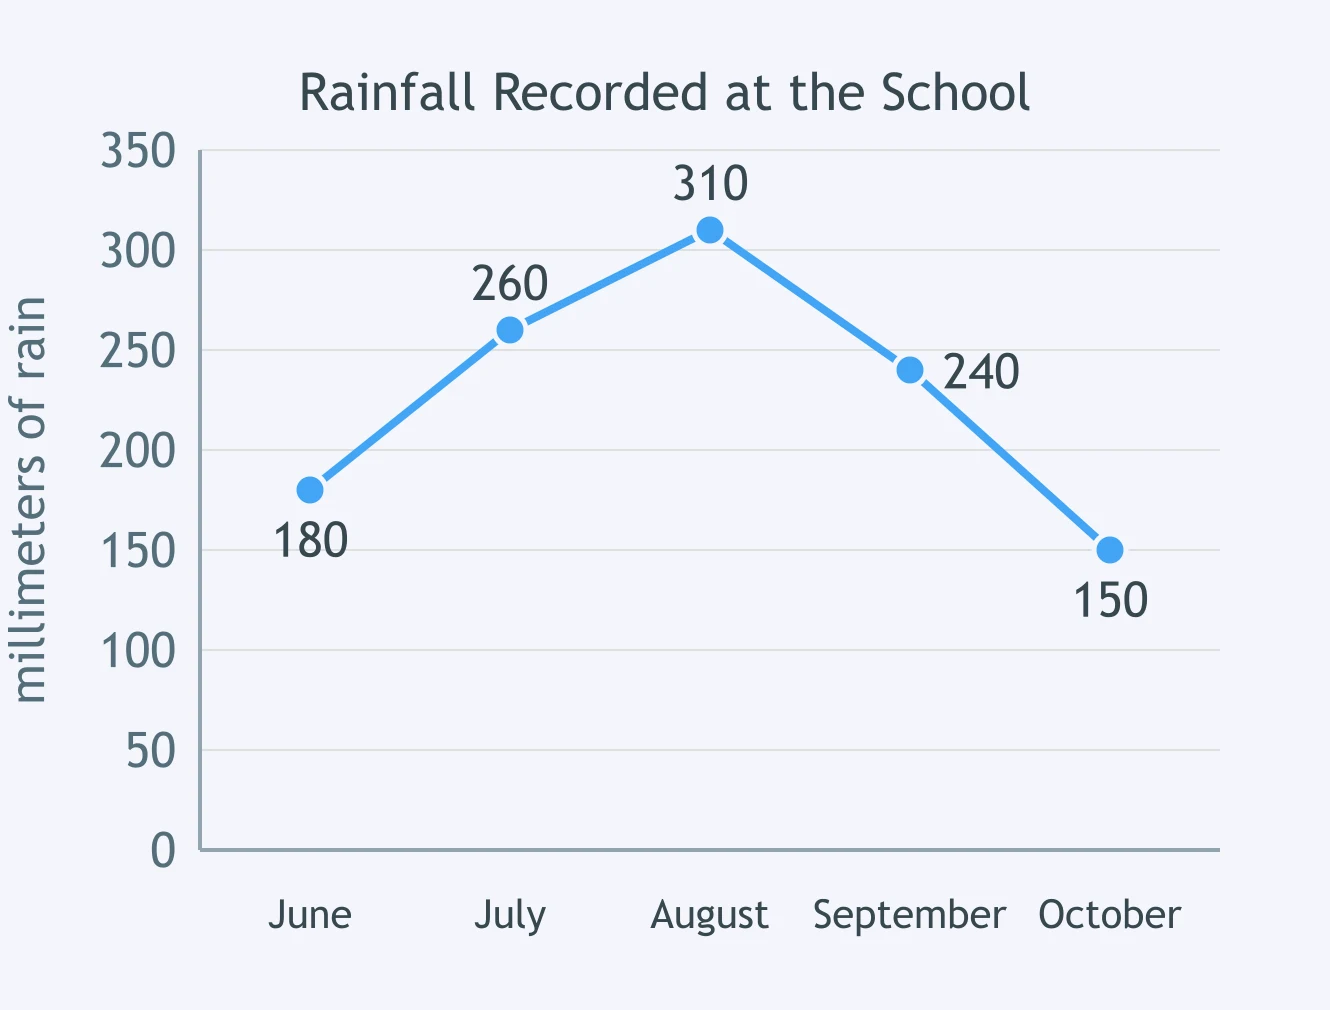
Look at the line graph. How much more rain fell in July than in October?
A learner wants to show how one club's membership changed in each of six months. Which display fits best?
A table lists each barangay's population and land area. Which question can that table NOT answer?
Crack the passcode before the zombies get in.

Pick a tile, answer, hit bonuses and steals.

When a Visual Misleads
20 questions