Loading
by BlastRoom
Practice combining a described chart, map, timeline, diagram, or flowchart with the written text of a history or science source.
#us_grade_7_english
40 questions
One question set, multiple game modes. Tap any game to see it in action. Not sure which to pick?
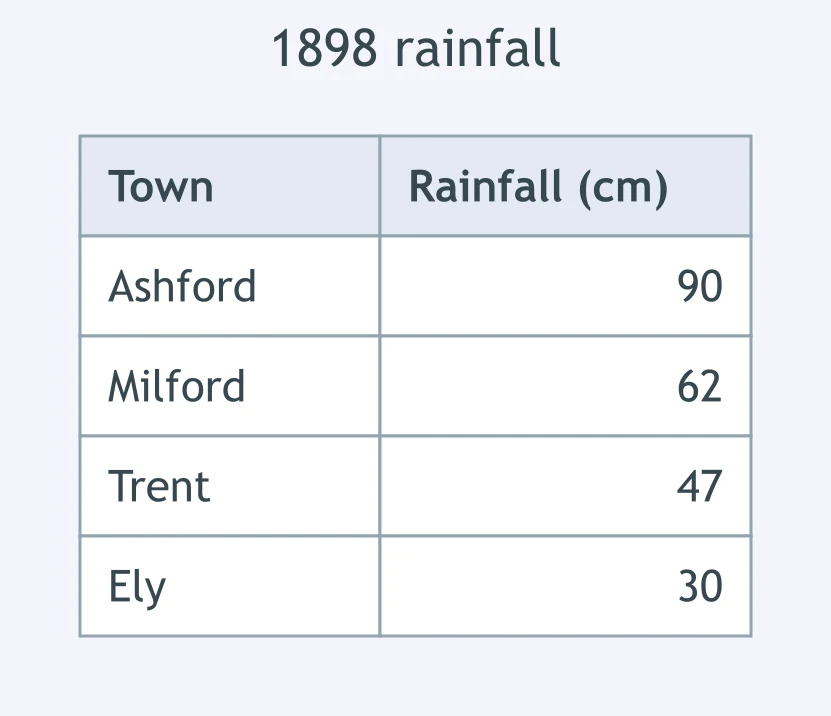
An article states that Ashford's farms failed in 1898 because of drought. What does the table beside it do to the claim?
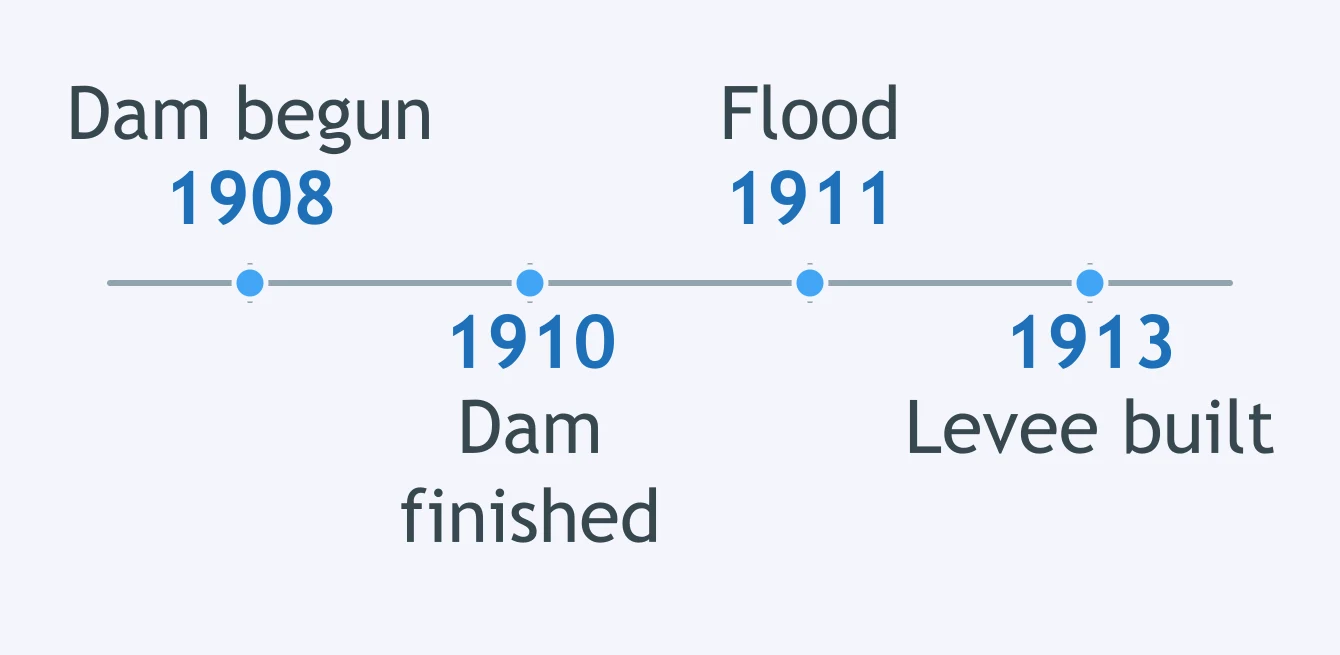
A text says the town built its dam in response to the 1911 flood. What does the timeline beside it show about that explanation?
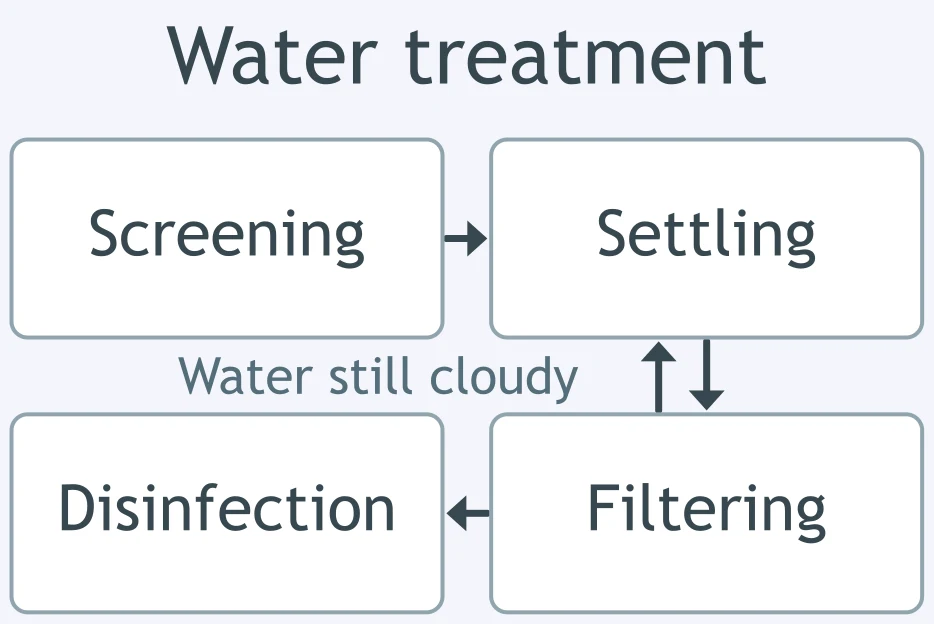
A science text describes water treatment as screening, then settling, then filtering, then disinfection. What does the flowchart beside it add?
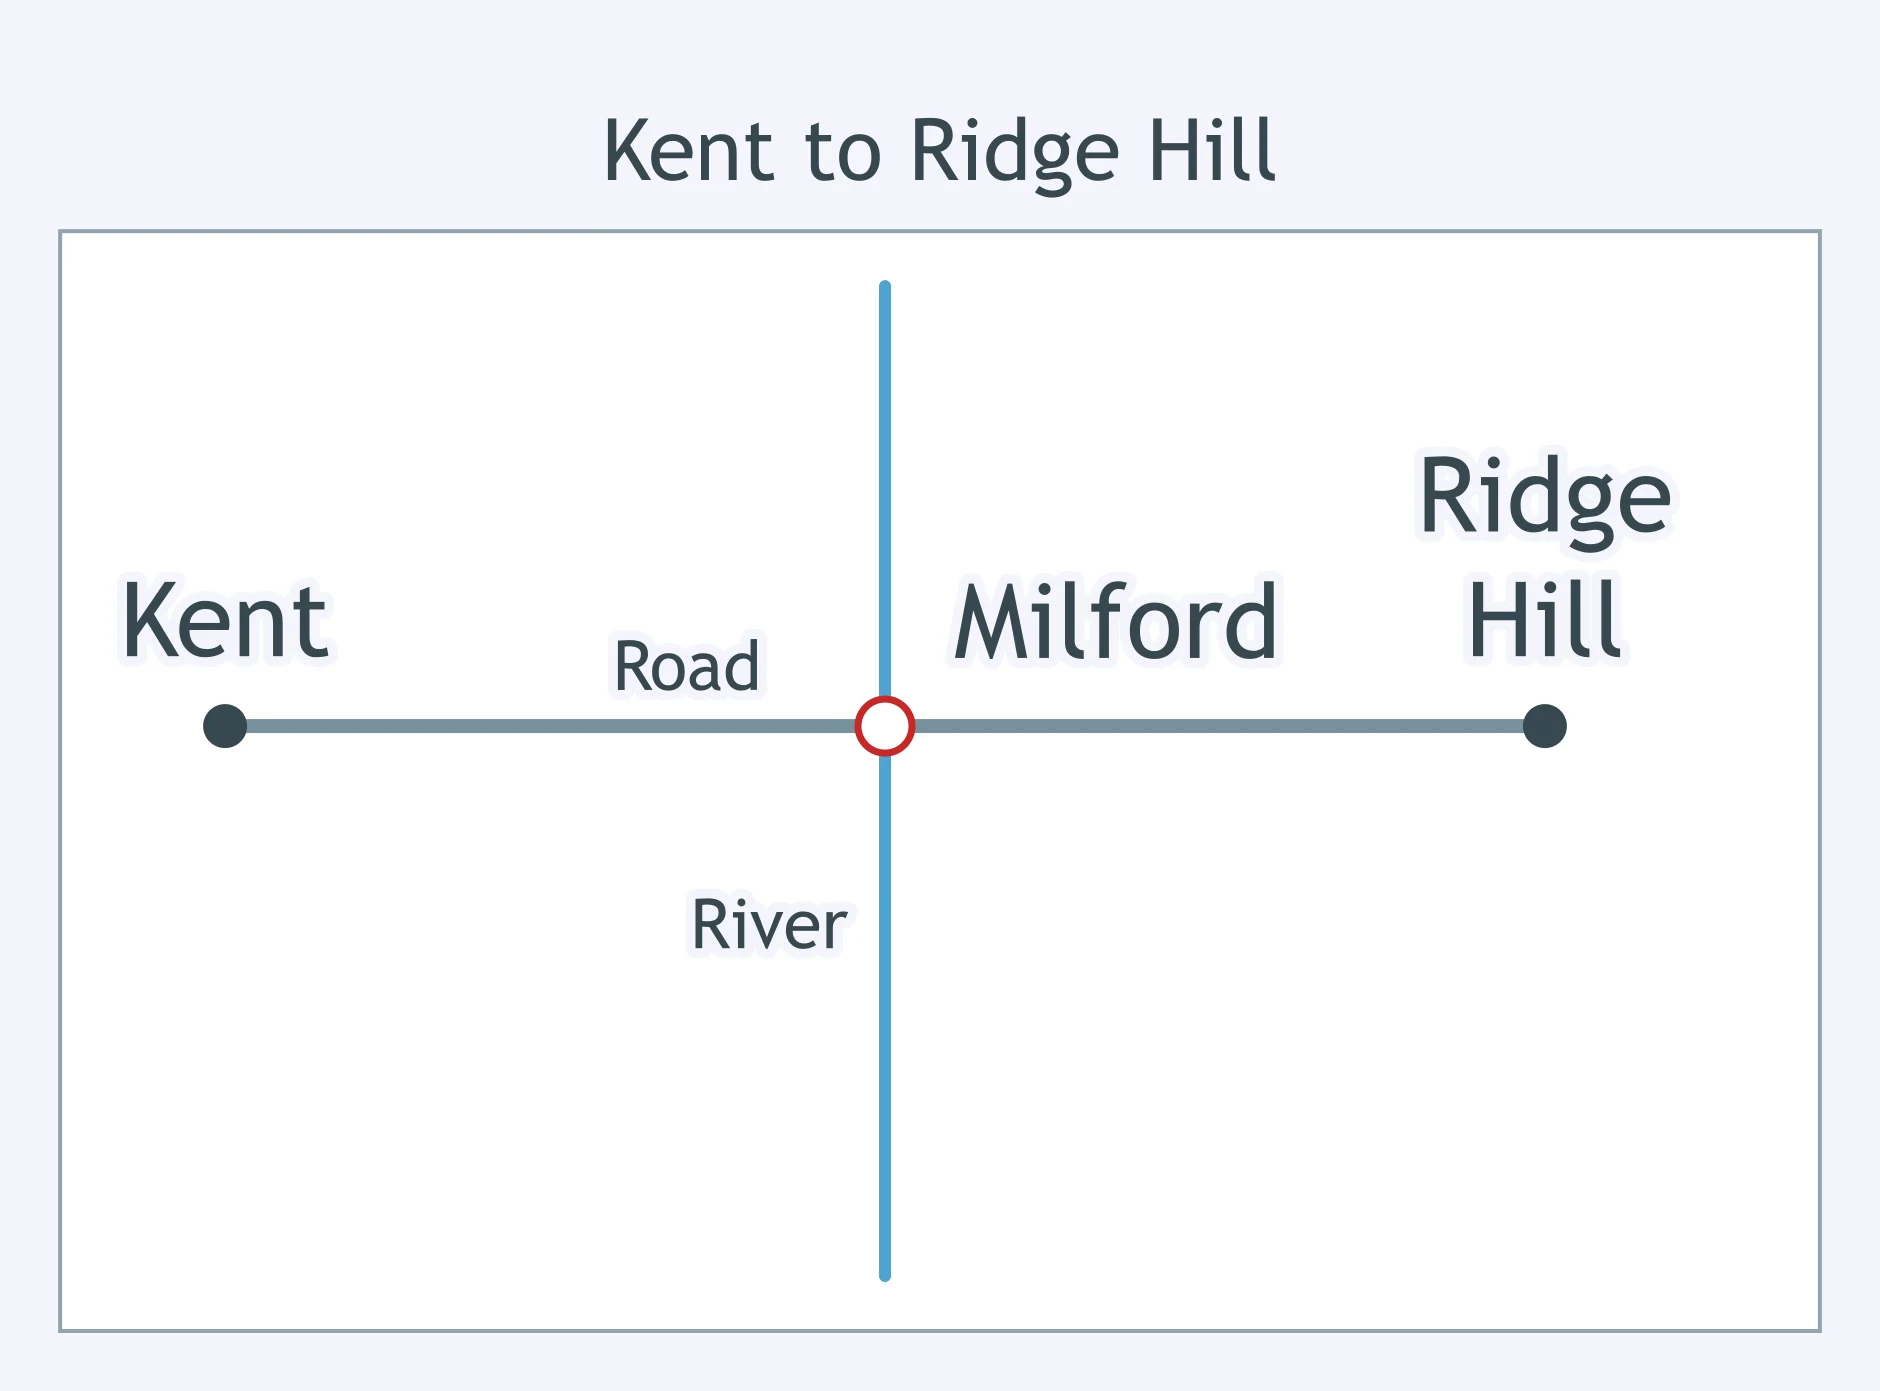
A history text says an army marched from Kent to Ridge Hill across open farmland. What does the map beside it add to the text?
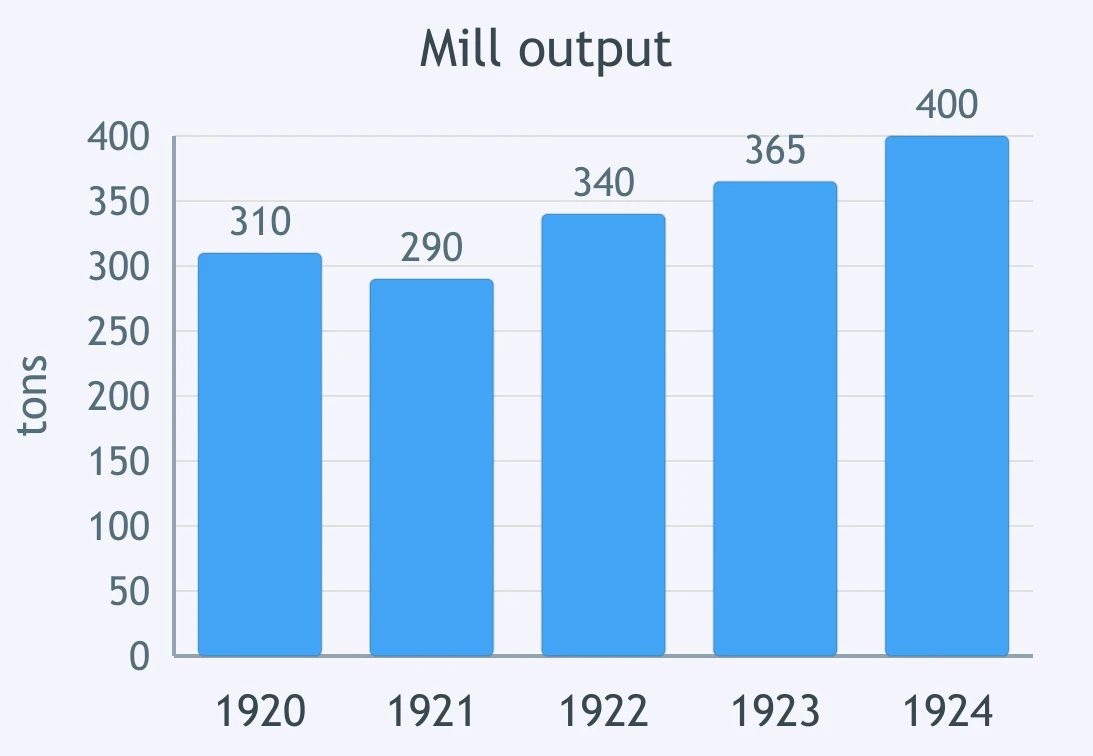
A report claims the mill's output rose in every year from 1920 to 1924. What does the bar graph beside it do to the claim?
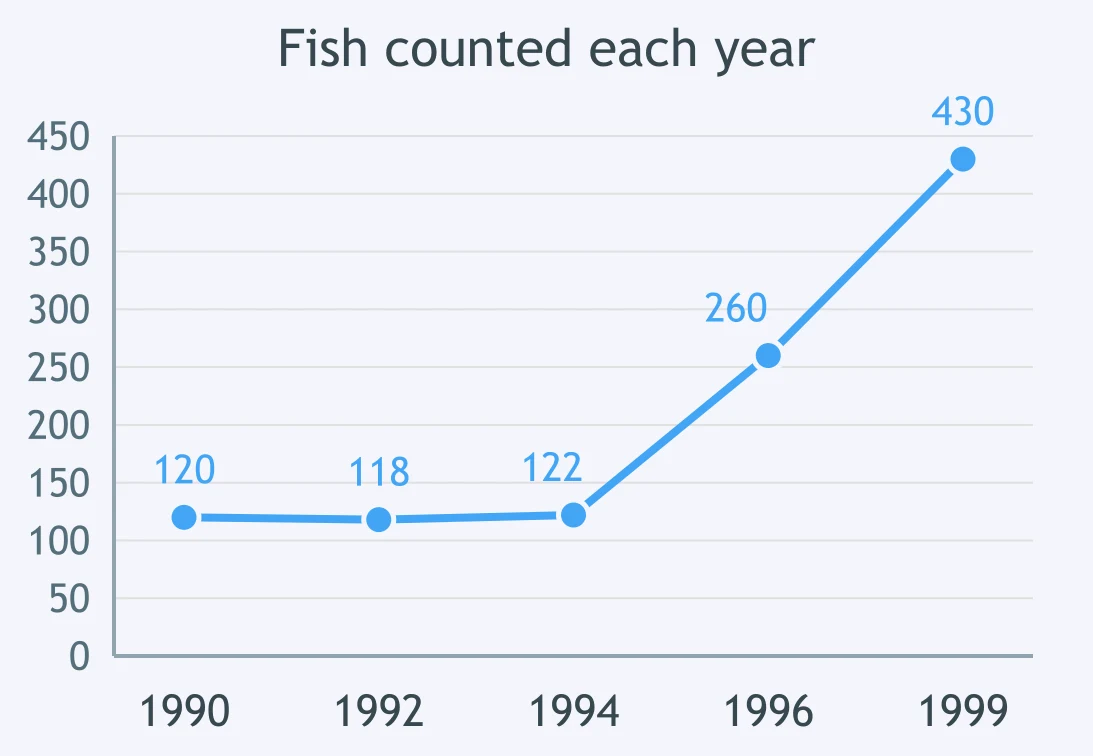
A text says a lake's fish population recovered once a factory closed in 1994. What does the line graph beside it confirm about the text?
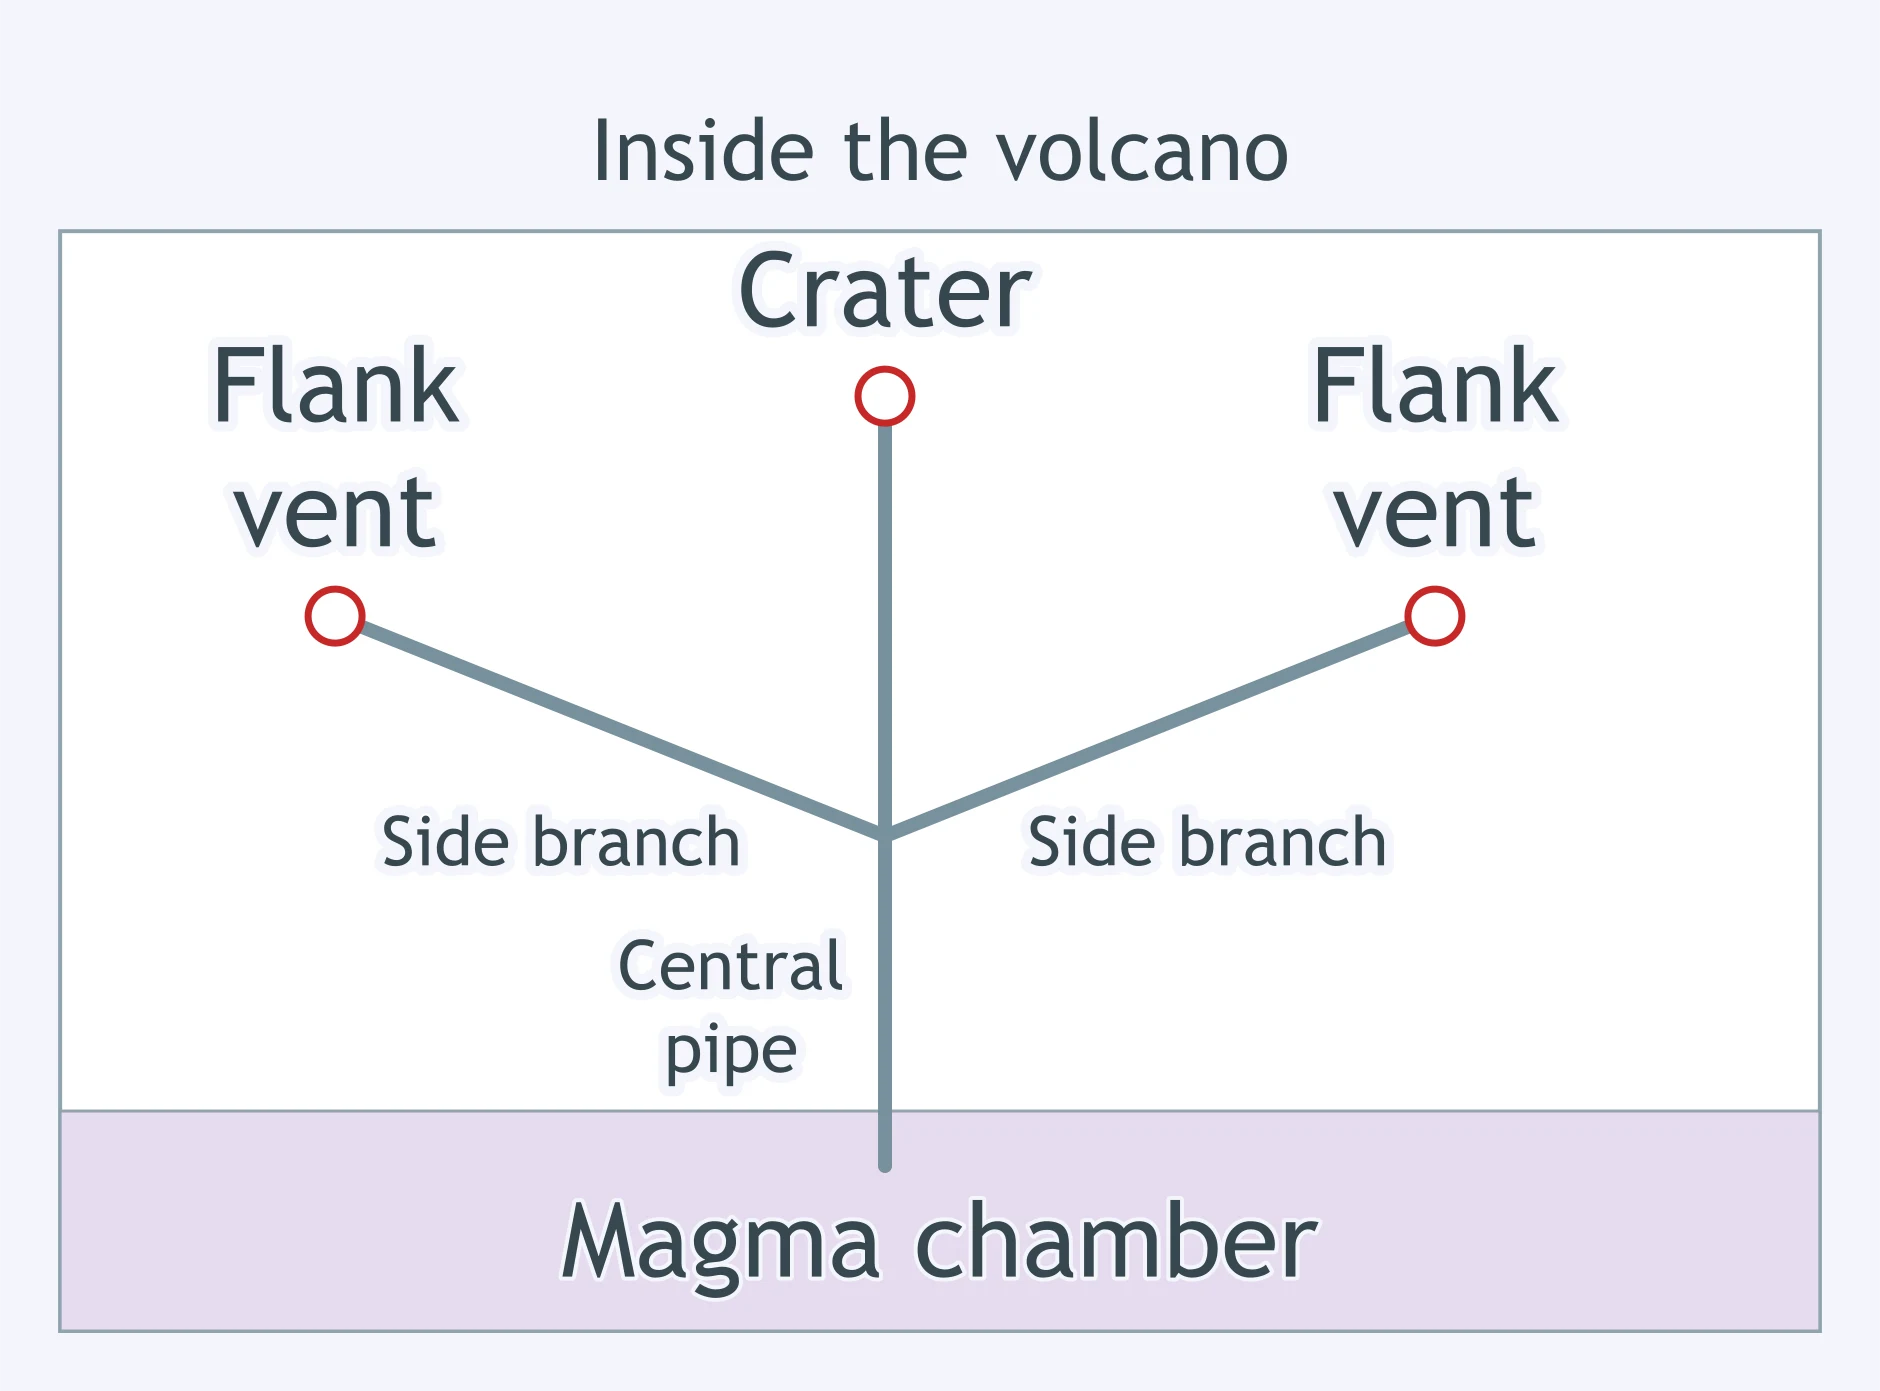
A science article says magma rises through a central pipe to the crater at a volcano's summit. What does the cross-section diagram beside it add?
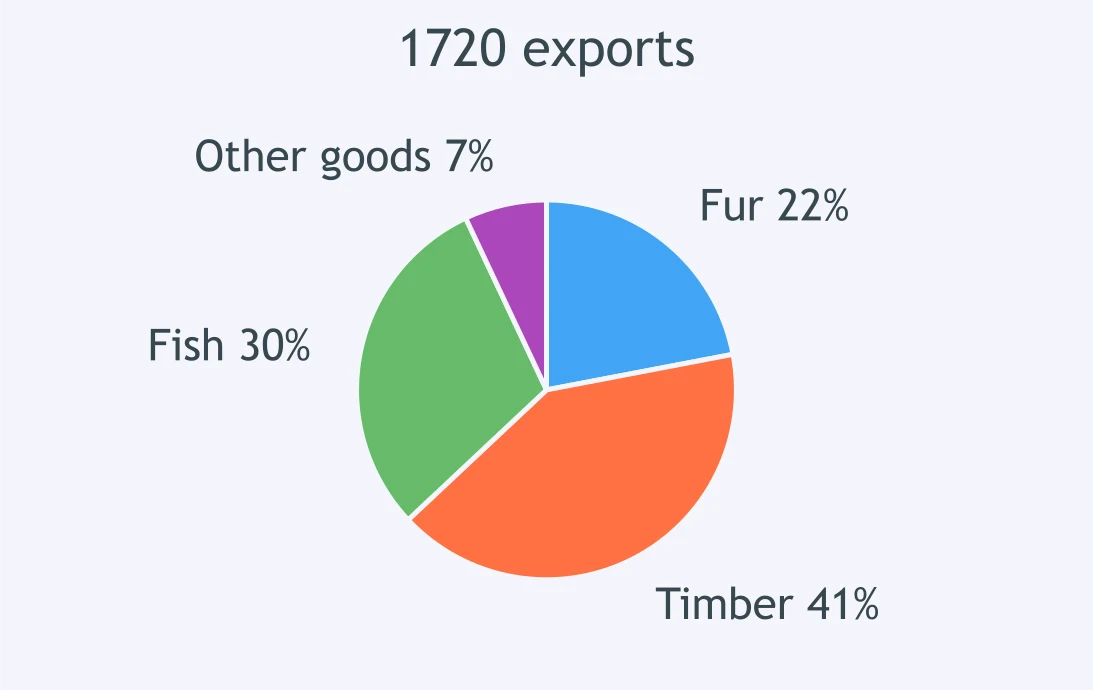
An article says a colony depended mainly on fur exports. What does the circle graph beside it do to the article's claim?
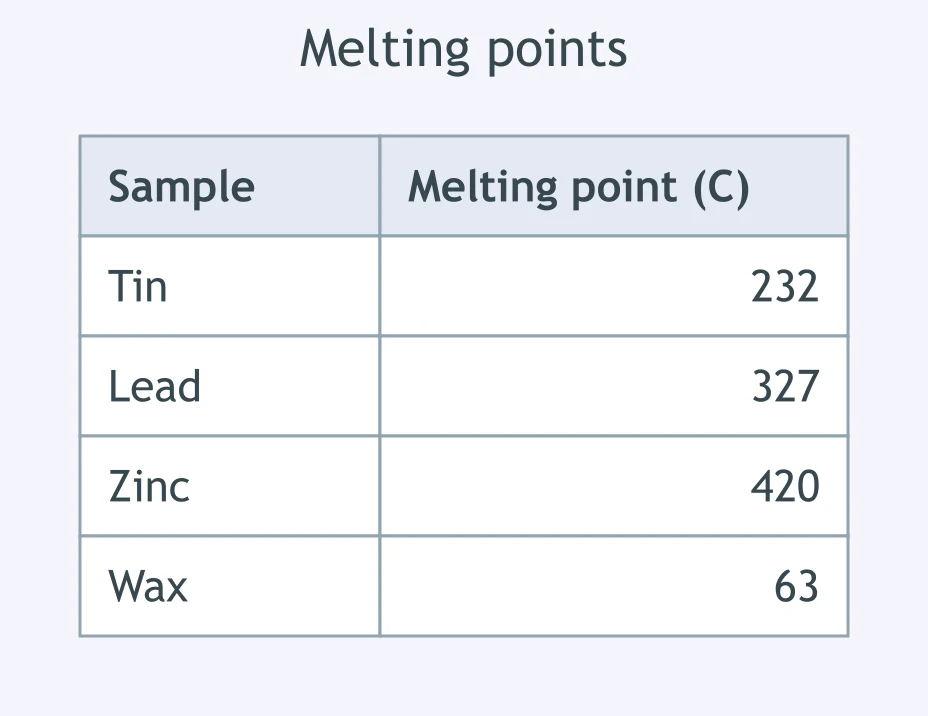
A chemistry text says four samples can be sorted by heating them all to 200 degrees Celsius. What does the table beside it show about that plan?
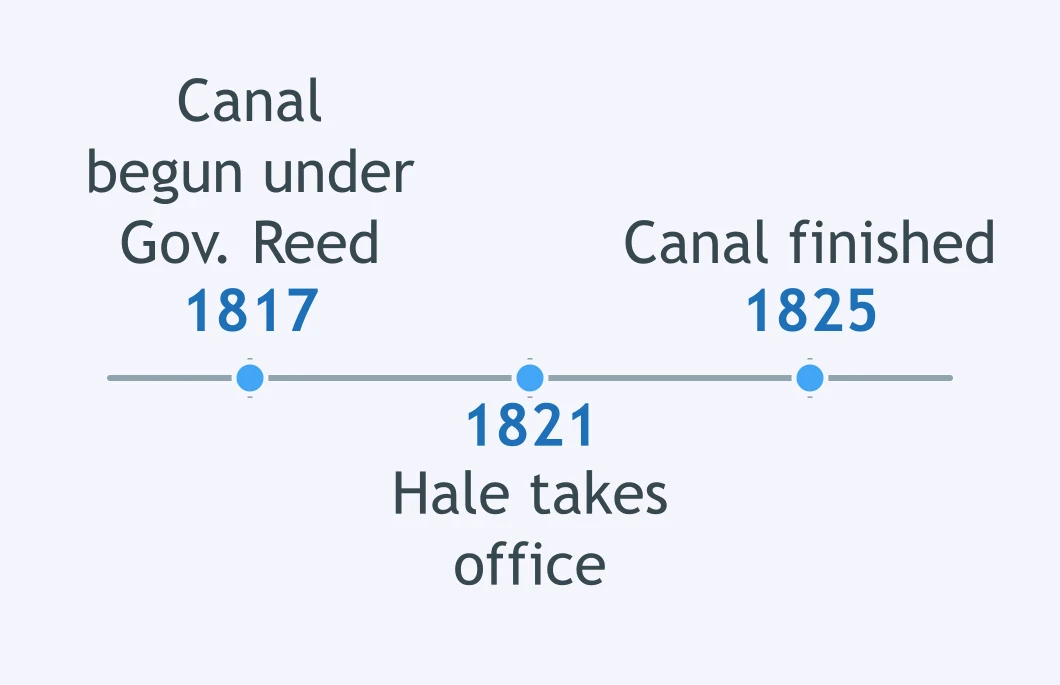
A history text credits Governor Hale with building the state canal. What does the timeline beside it add to the text?
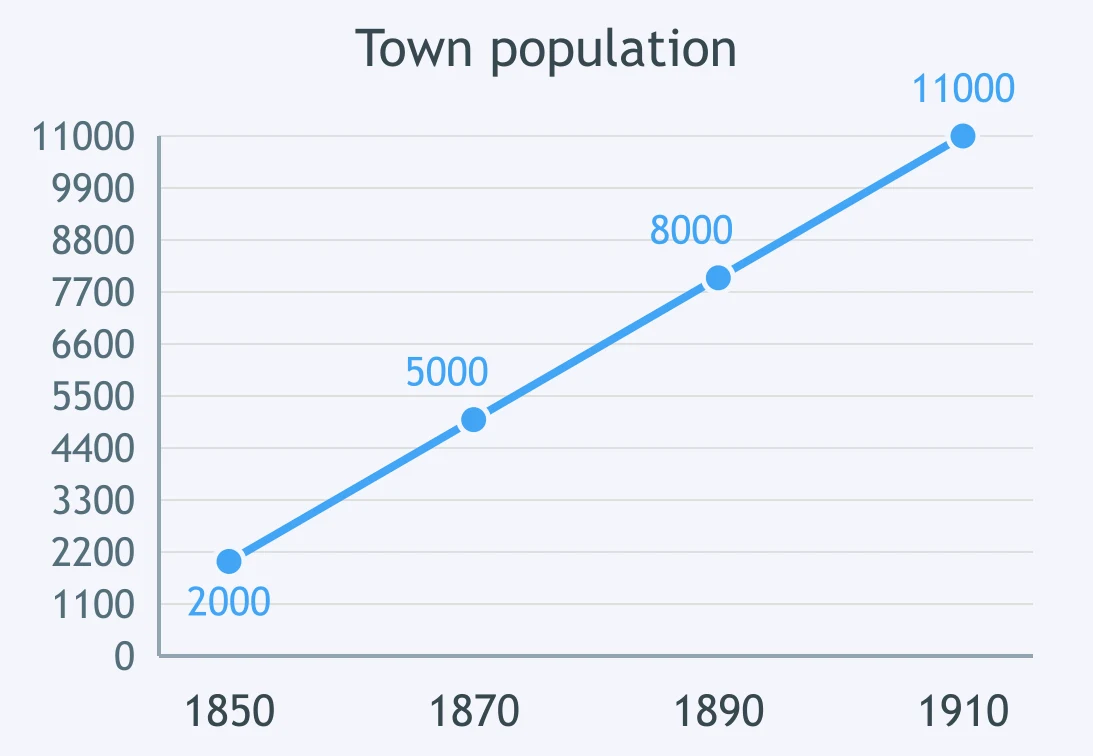
A text says a town grew because a mill opened in 1870. What does the line graph beside it do to that explanation?
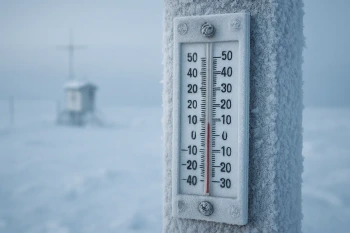
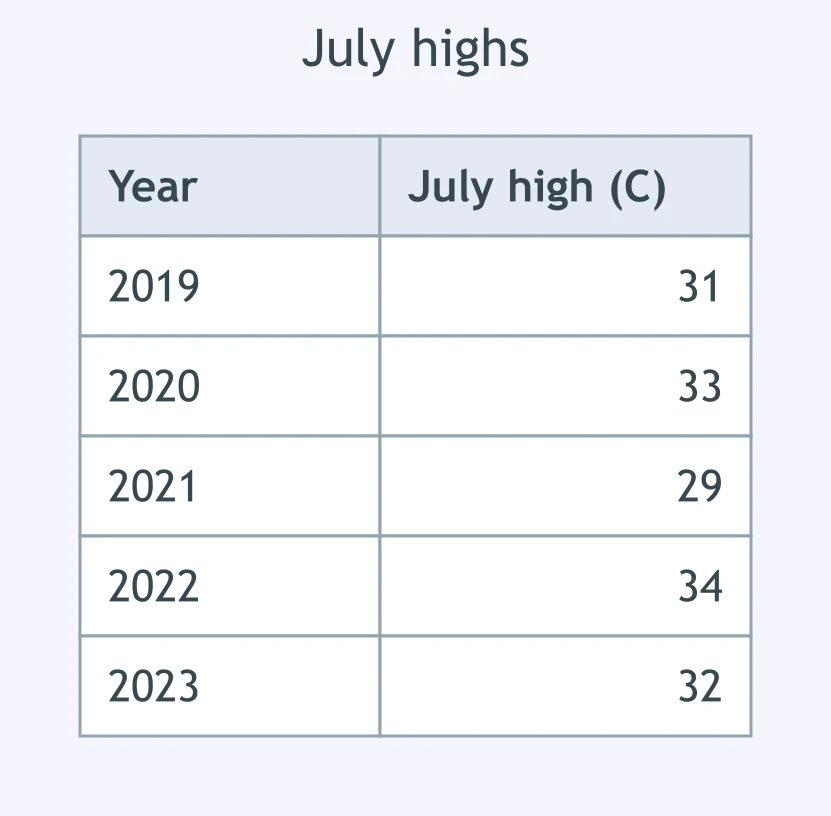
A text says a weather station has mild summers that never pass 30 degrees Celsius. What does the table beside it do to the text?
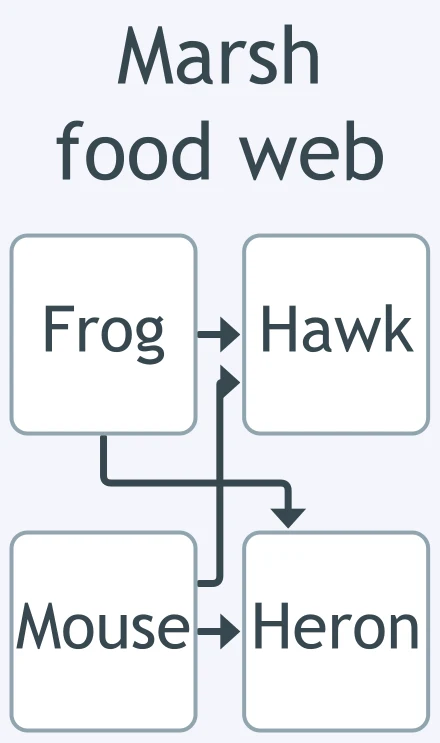
A science text names the hawk as the top predator of a marsh. What does the food-web diagram beside it add?
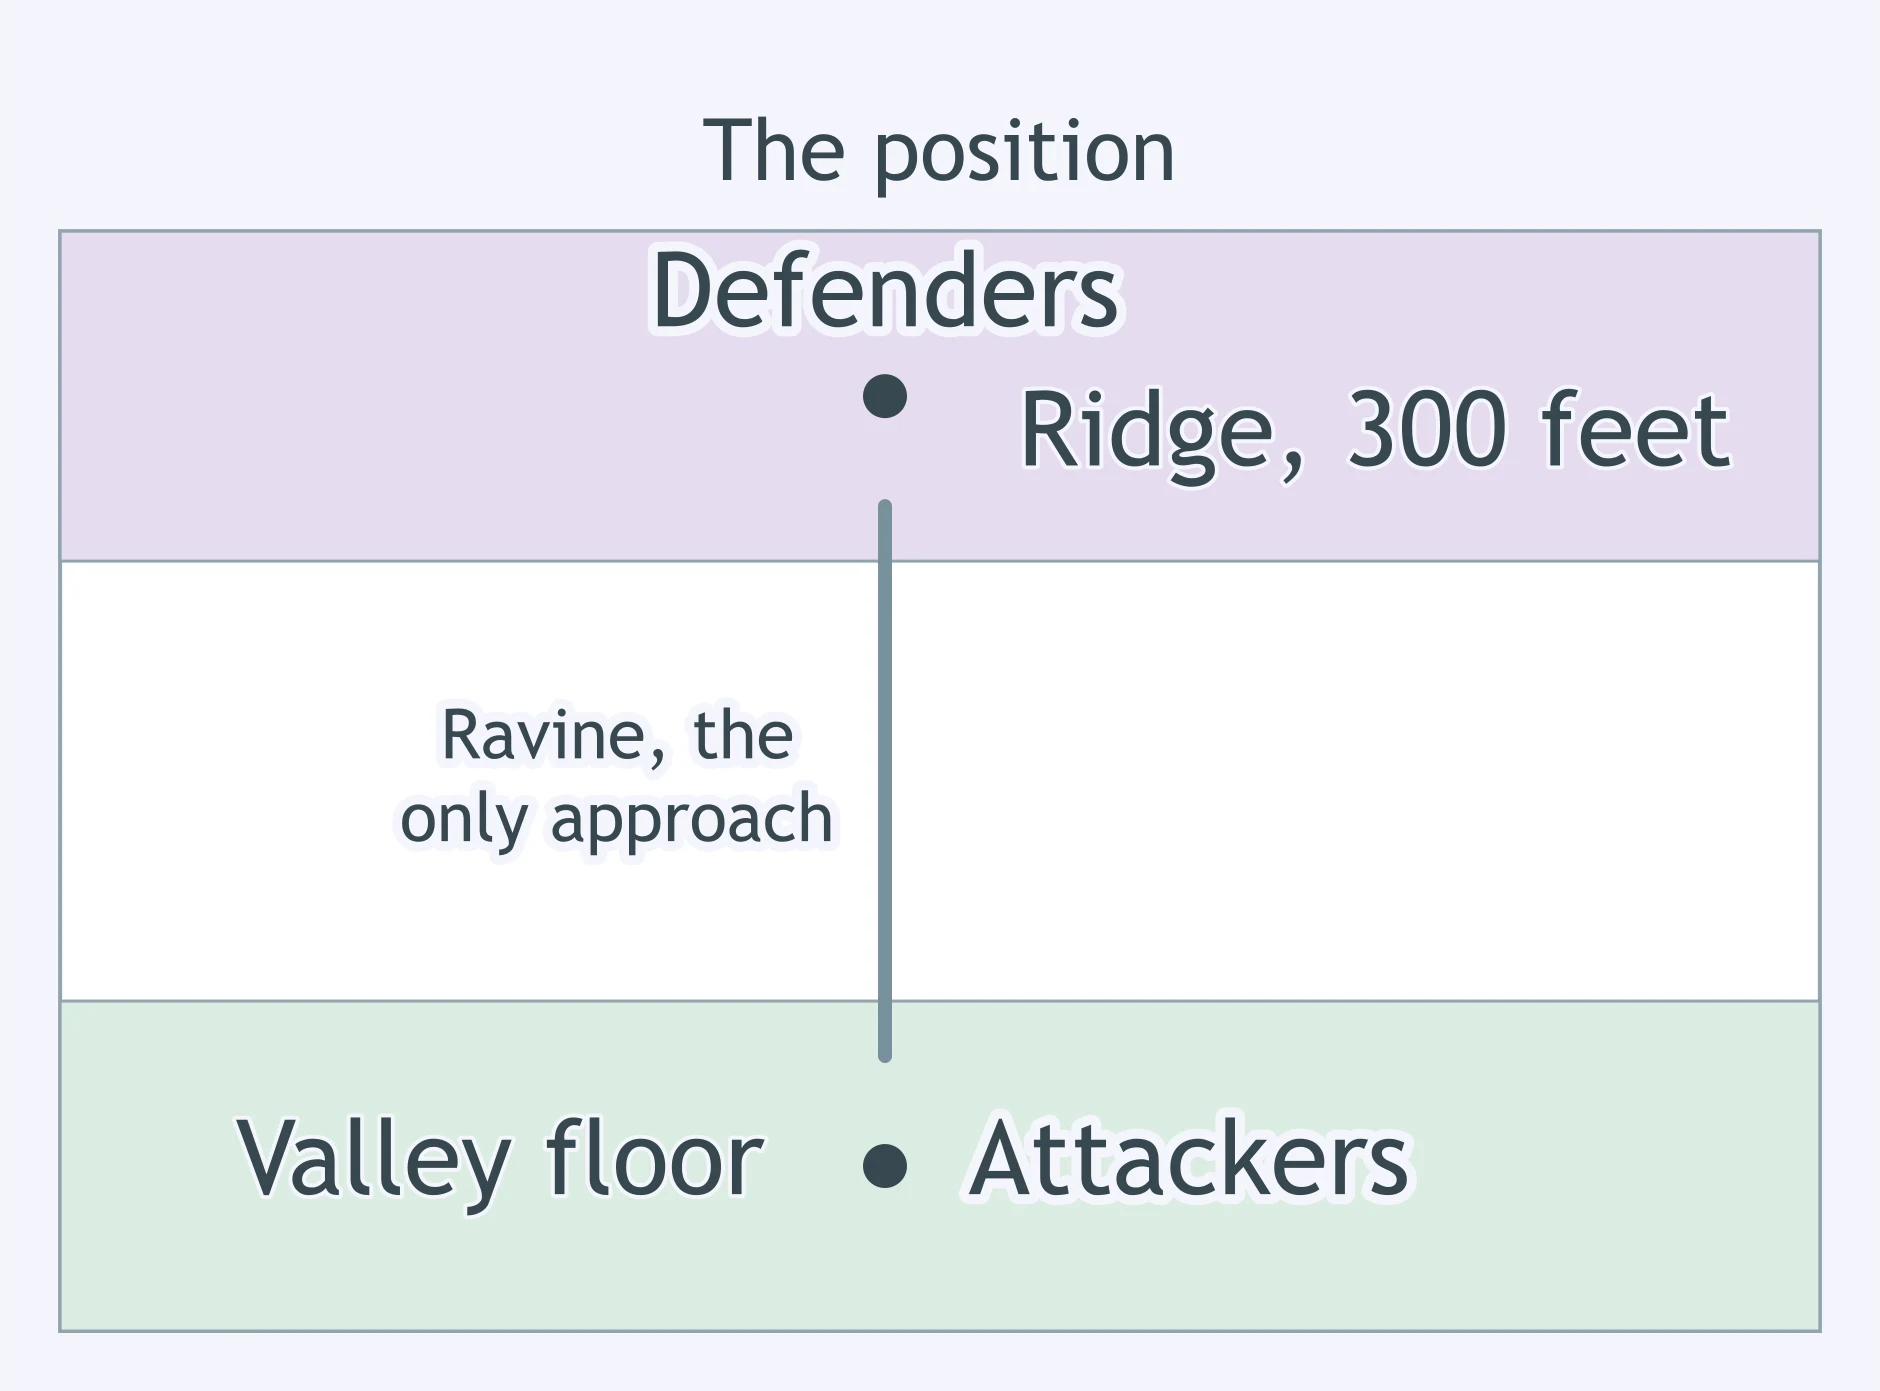
A history source says the defenders held an easy position. What does the map beside it do for the source?
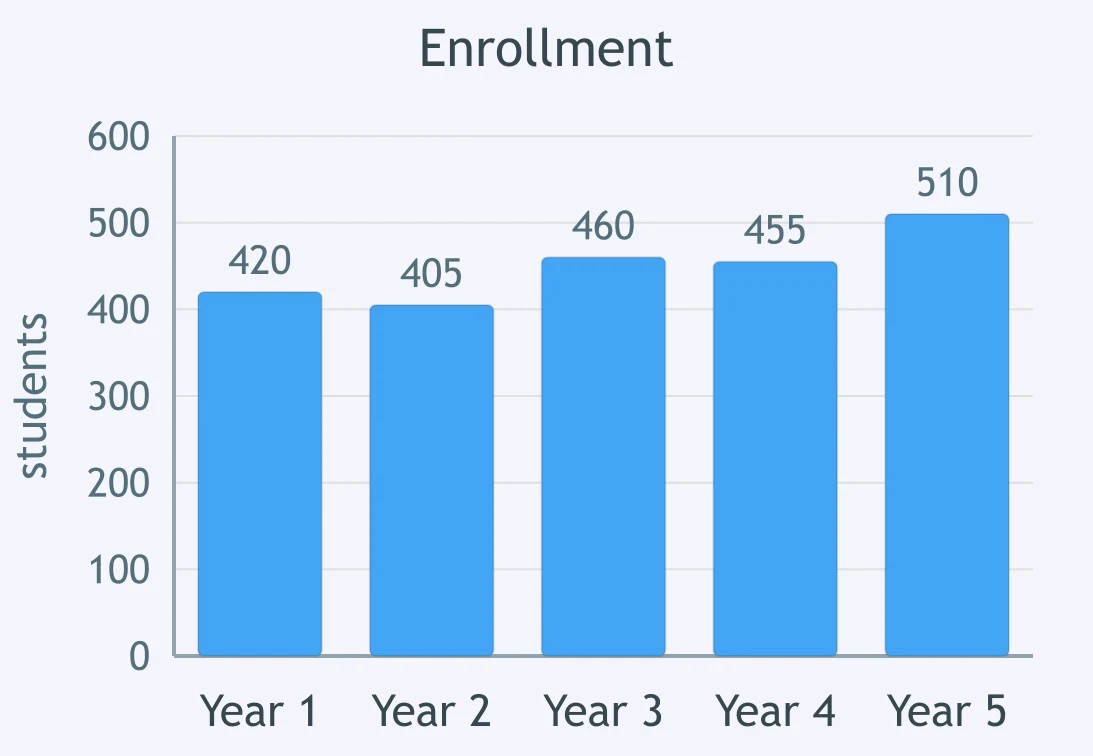
A newsletter says enrollment has grown steadily for five years. What does the bar graph beside it do to the word steadily?
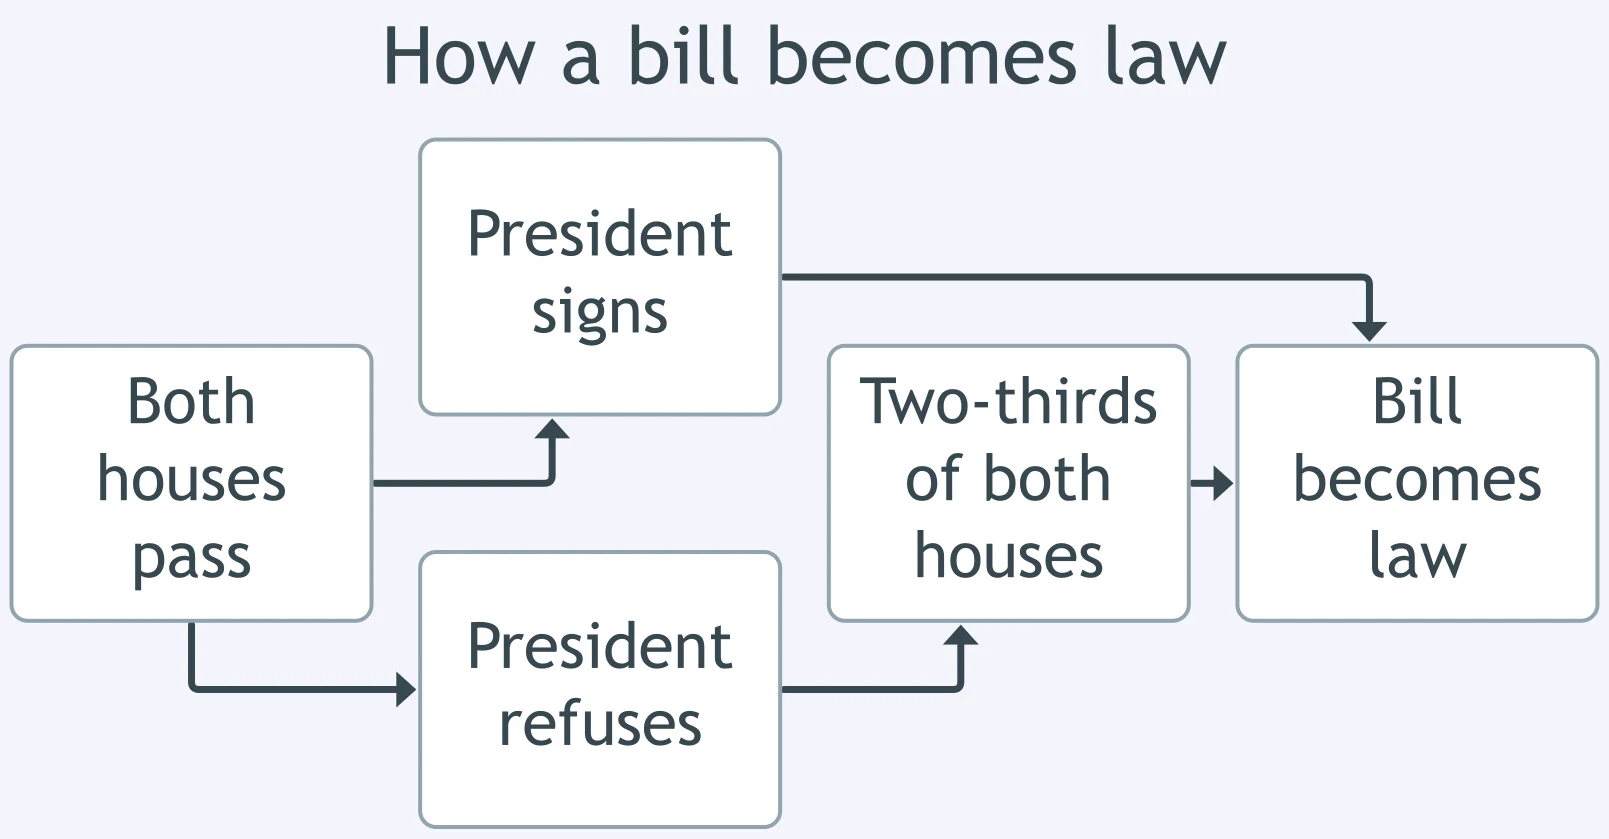
A civics text says a bill becomes law when both houses pass it and the president signs it. What does the flowchart beside it add?
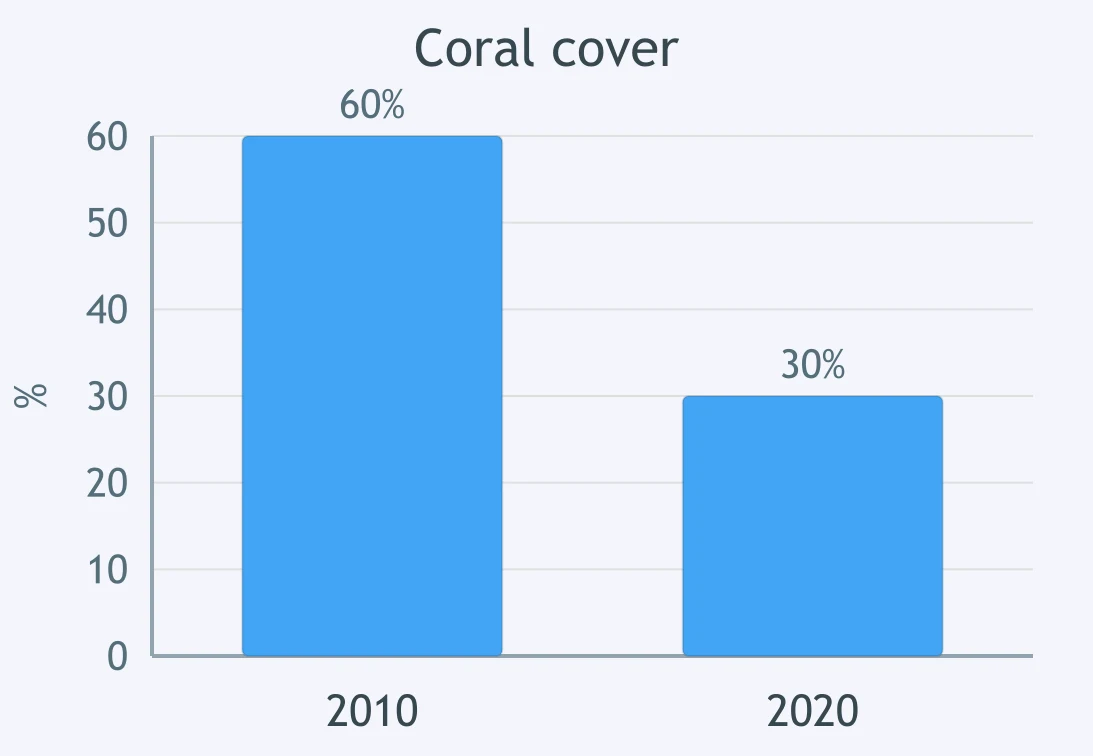
A science text states that a reef lost half its coral between 2010 and 2020. True or False: the bar graph beside it confirms the text's figure.
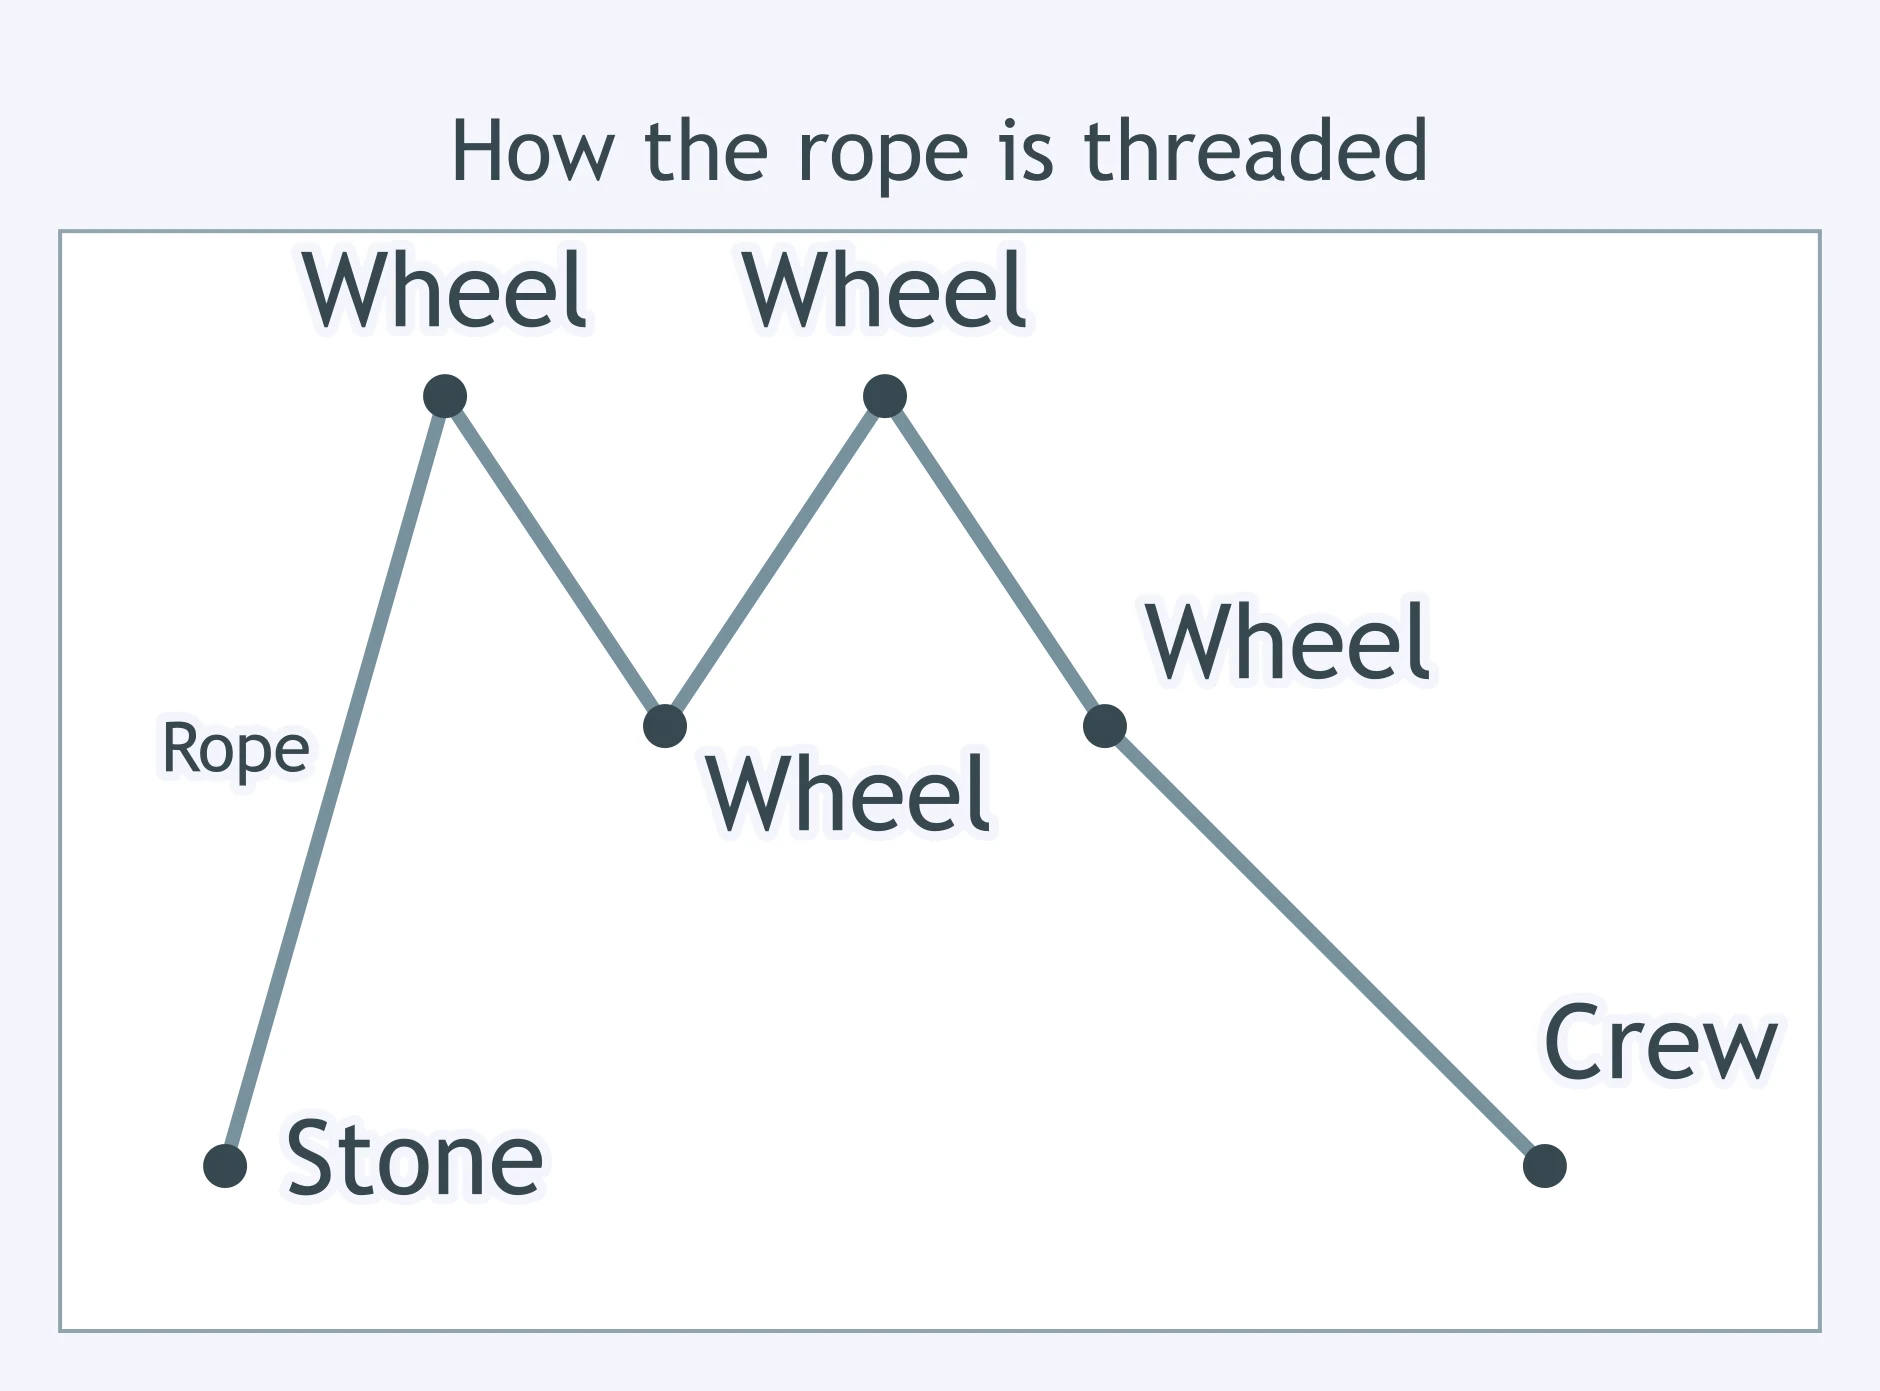
A science text says a crew lifted a stone with a single rope passing over one wheel. What does the diagram beside it do to the text?
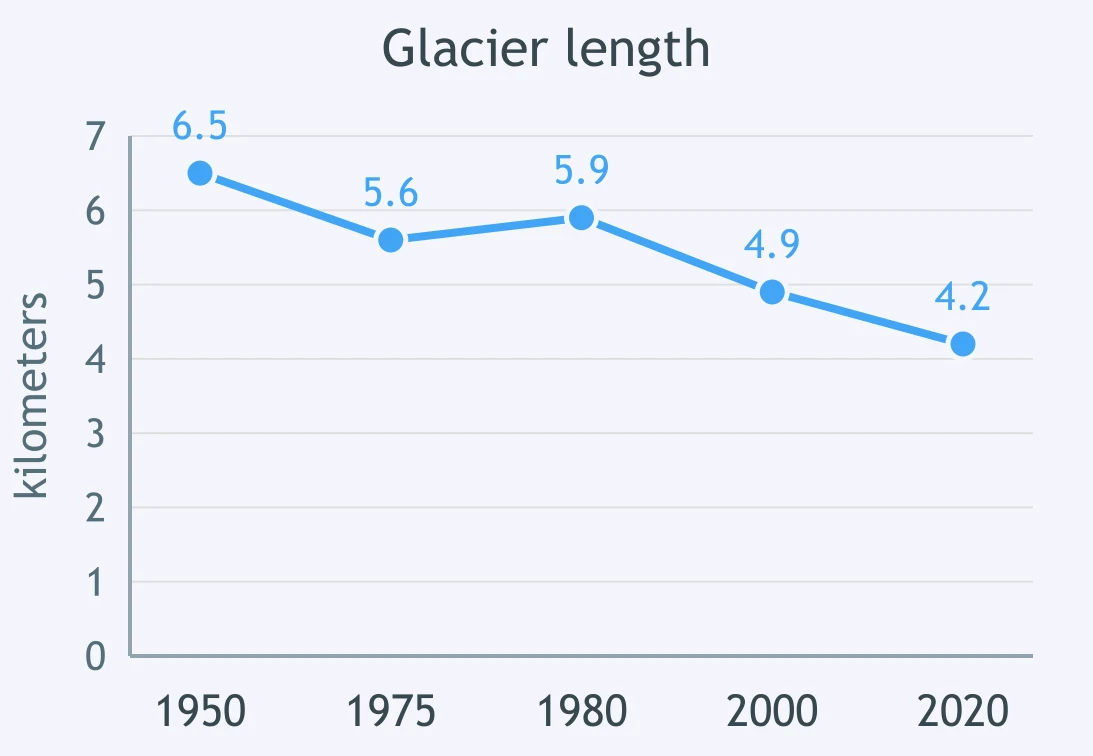
A report says a glacier has shrunk since 1950. What does the line graph beside it add to the report?
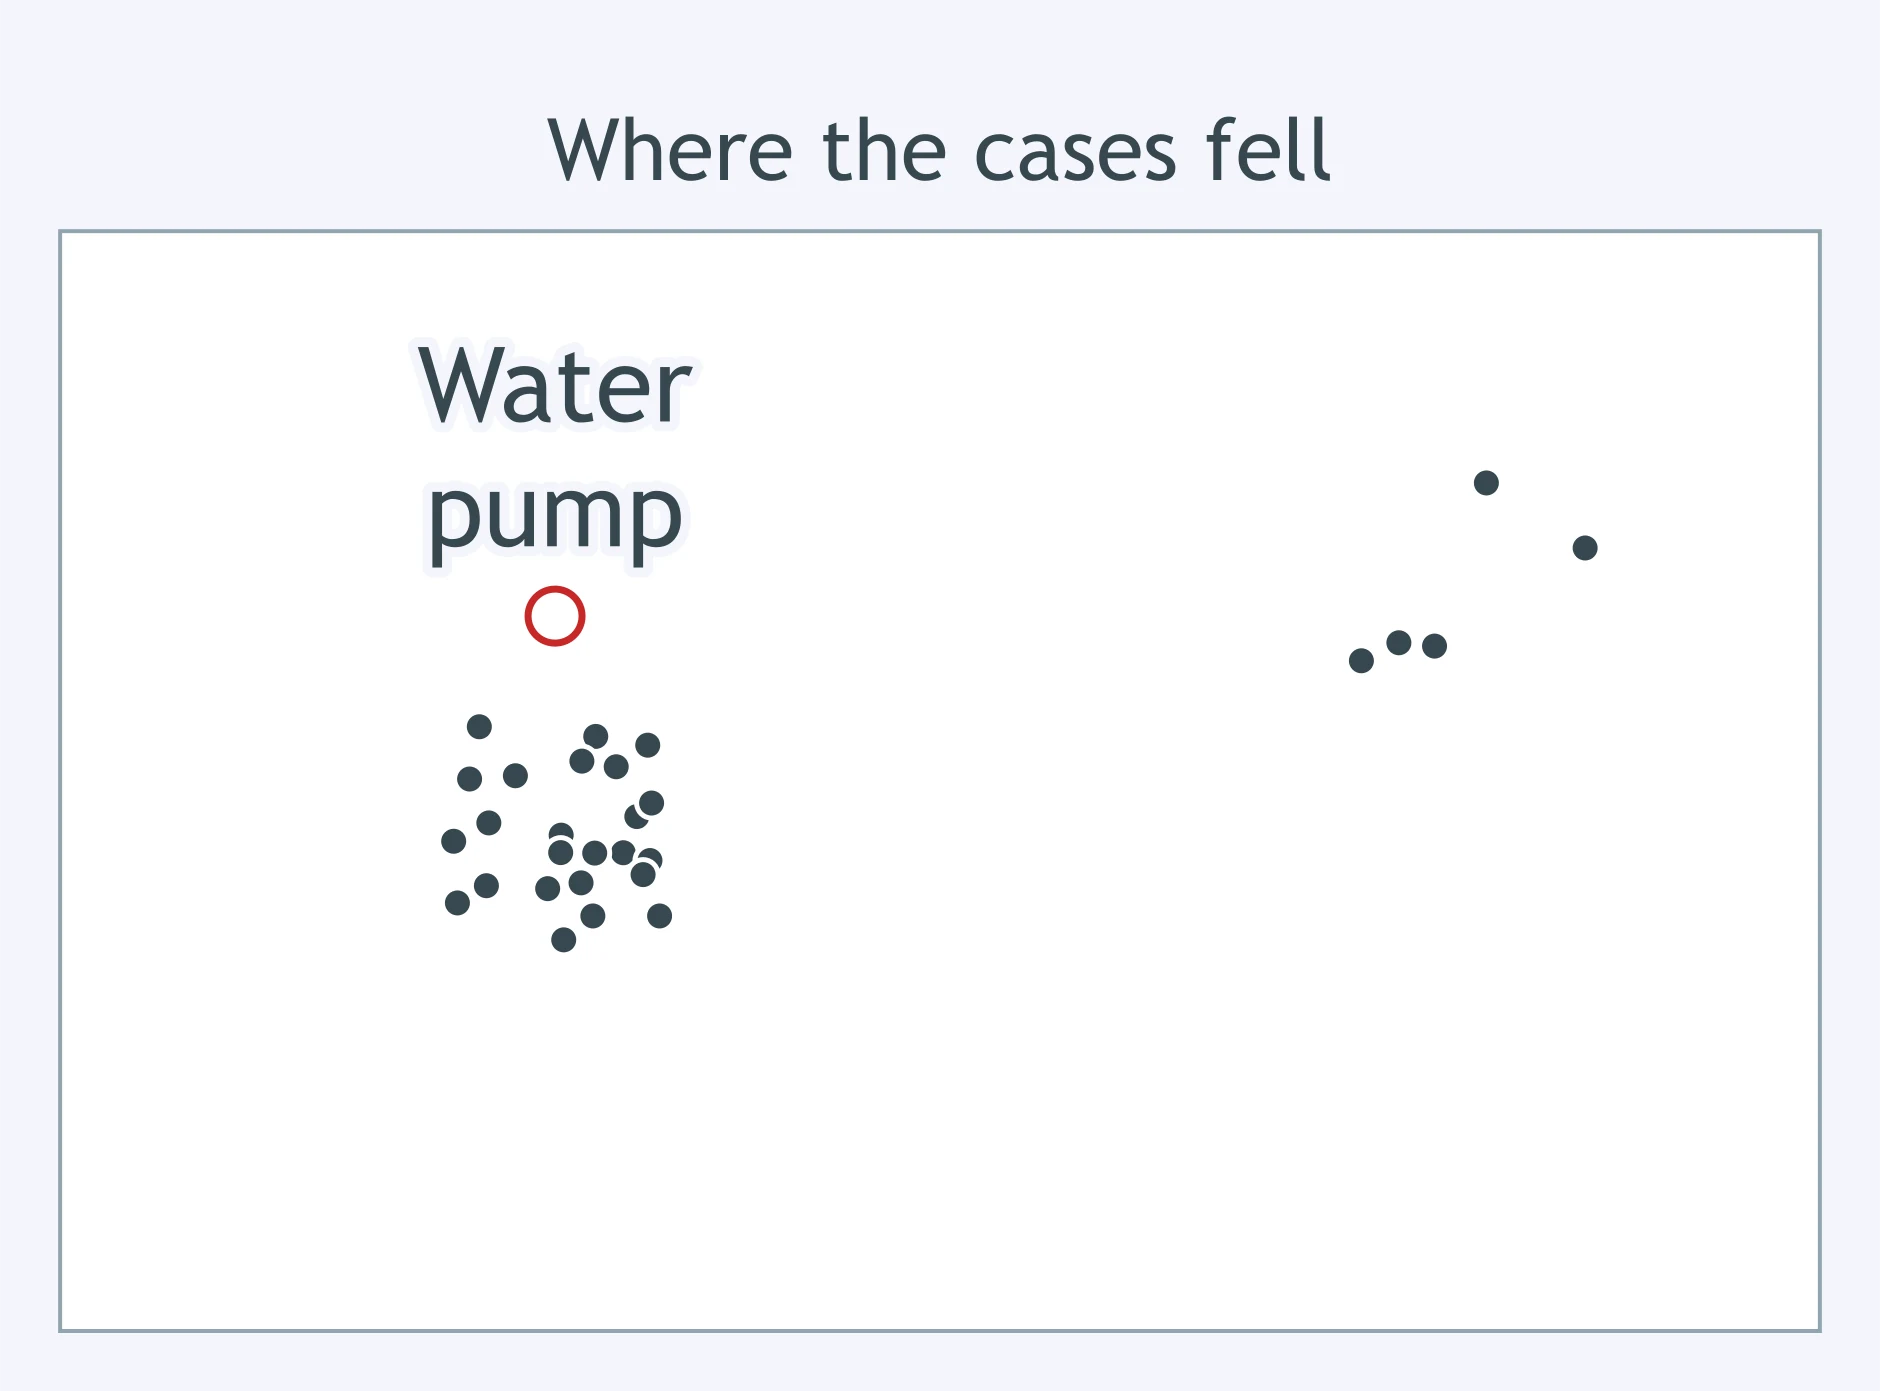
An article says an outbreak centered on one street. What does the map beside it add?
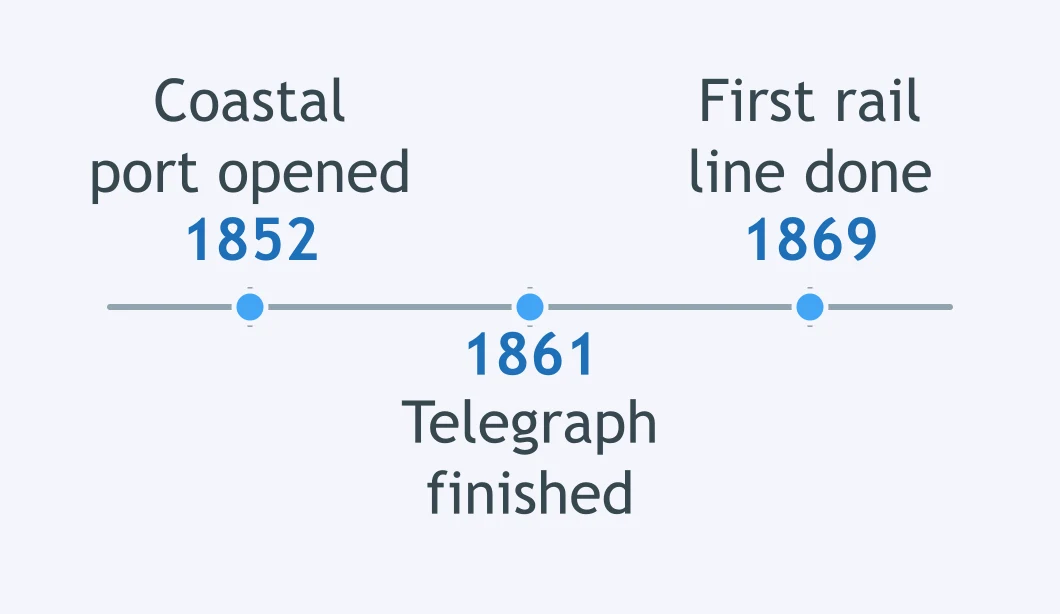
A text says the telegraph reached the coast before the railroad did. What does the timeline beside it confirm?
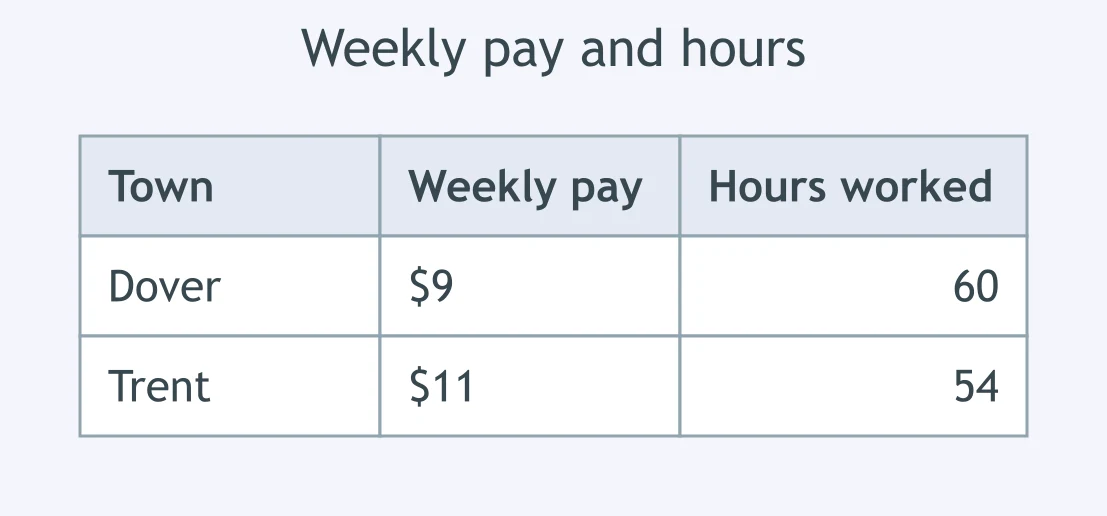
A report says workers in Dover earned more than workers in Trent. What does the table beside it do to the report?
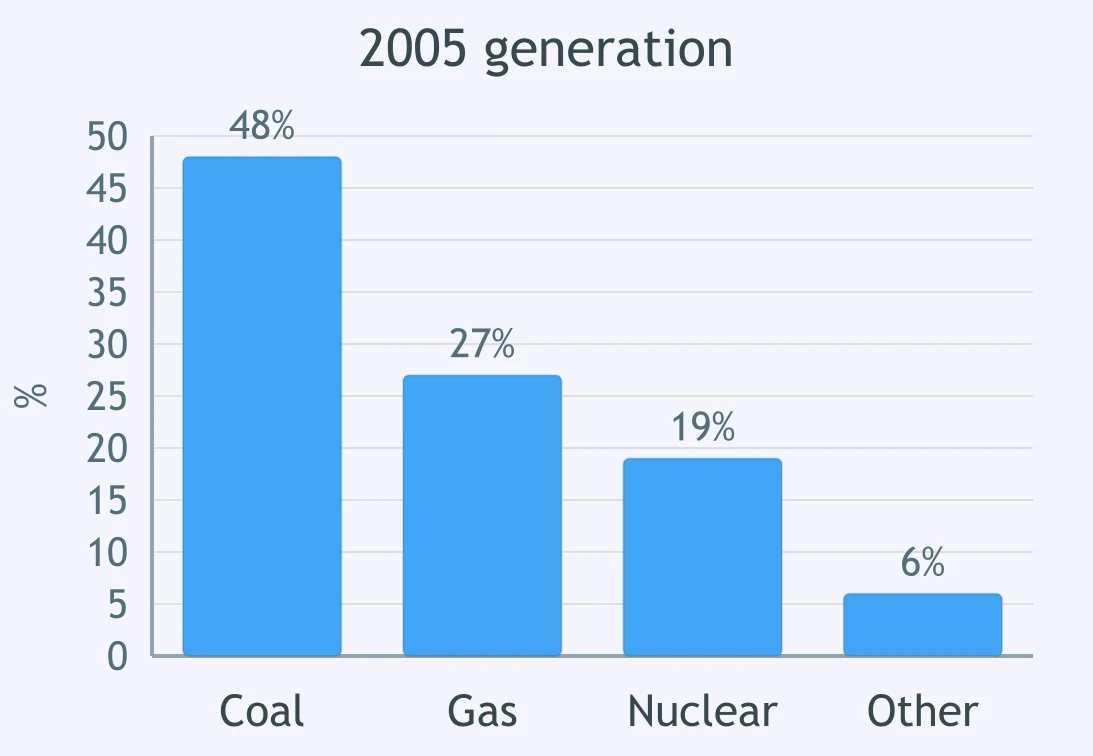
An article says a state drew more power from coal in 2005 than from any other source. What does the bar graph beside it do?
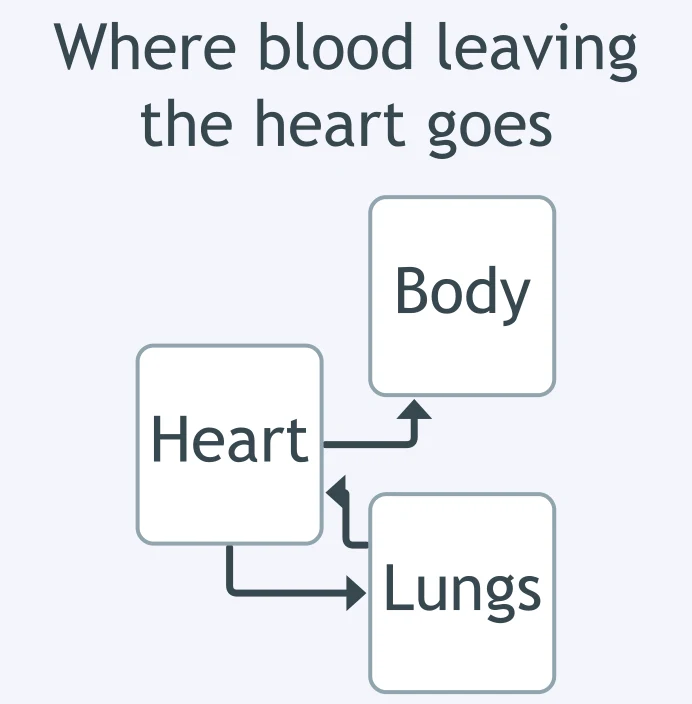
A science text says blood leaves the heart through the aorta and travels to the body. What does the diagram beside it add?
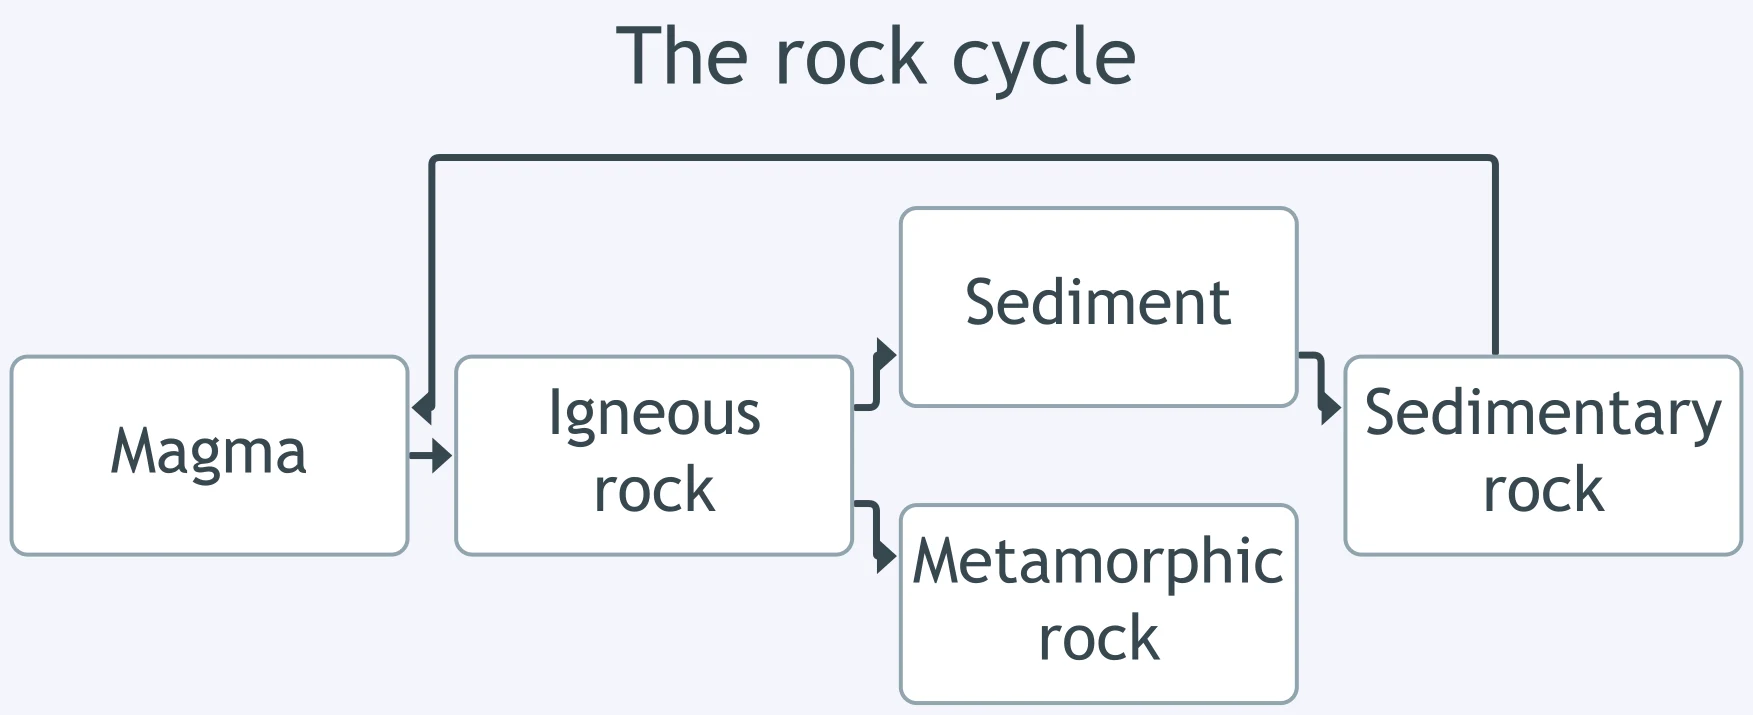
A science text says magma cools into igneous rock, which weathers into sediment and presses into sedimentary rock. What does the flowchart beside it add?
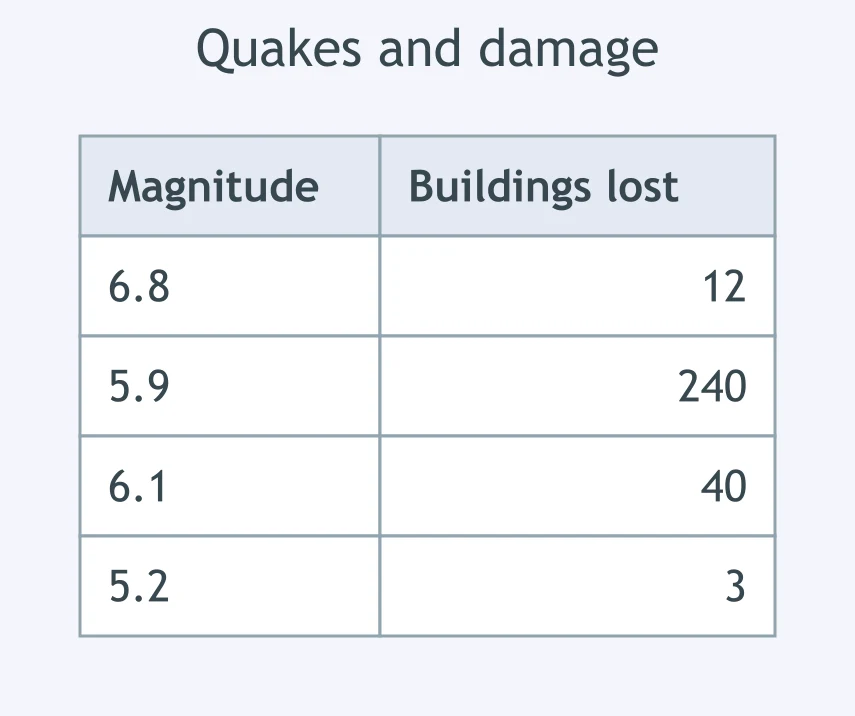
A news article says the strongest quake did the most damage. What does the table beside it do to the claim?
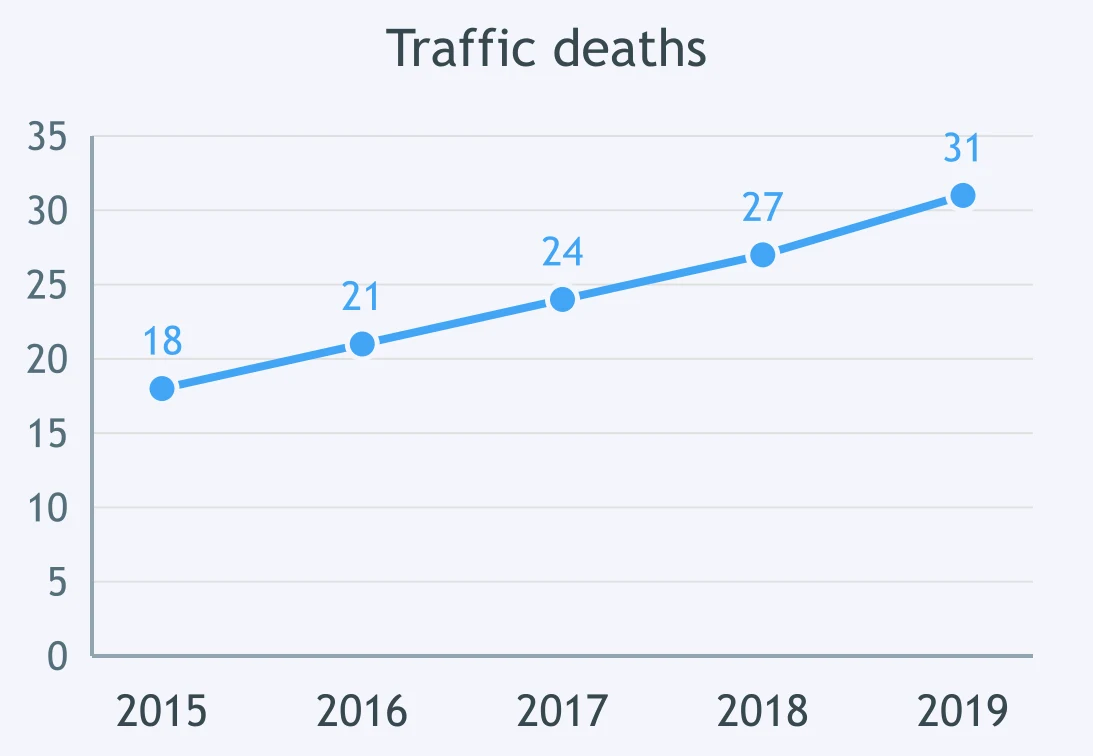
An article claims a city's traffic deaths fell after 2015. True or False: the line graph beside it supports the article's claim.
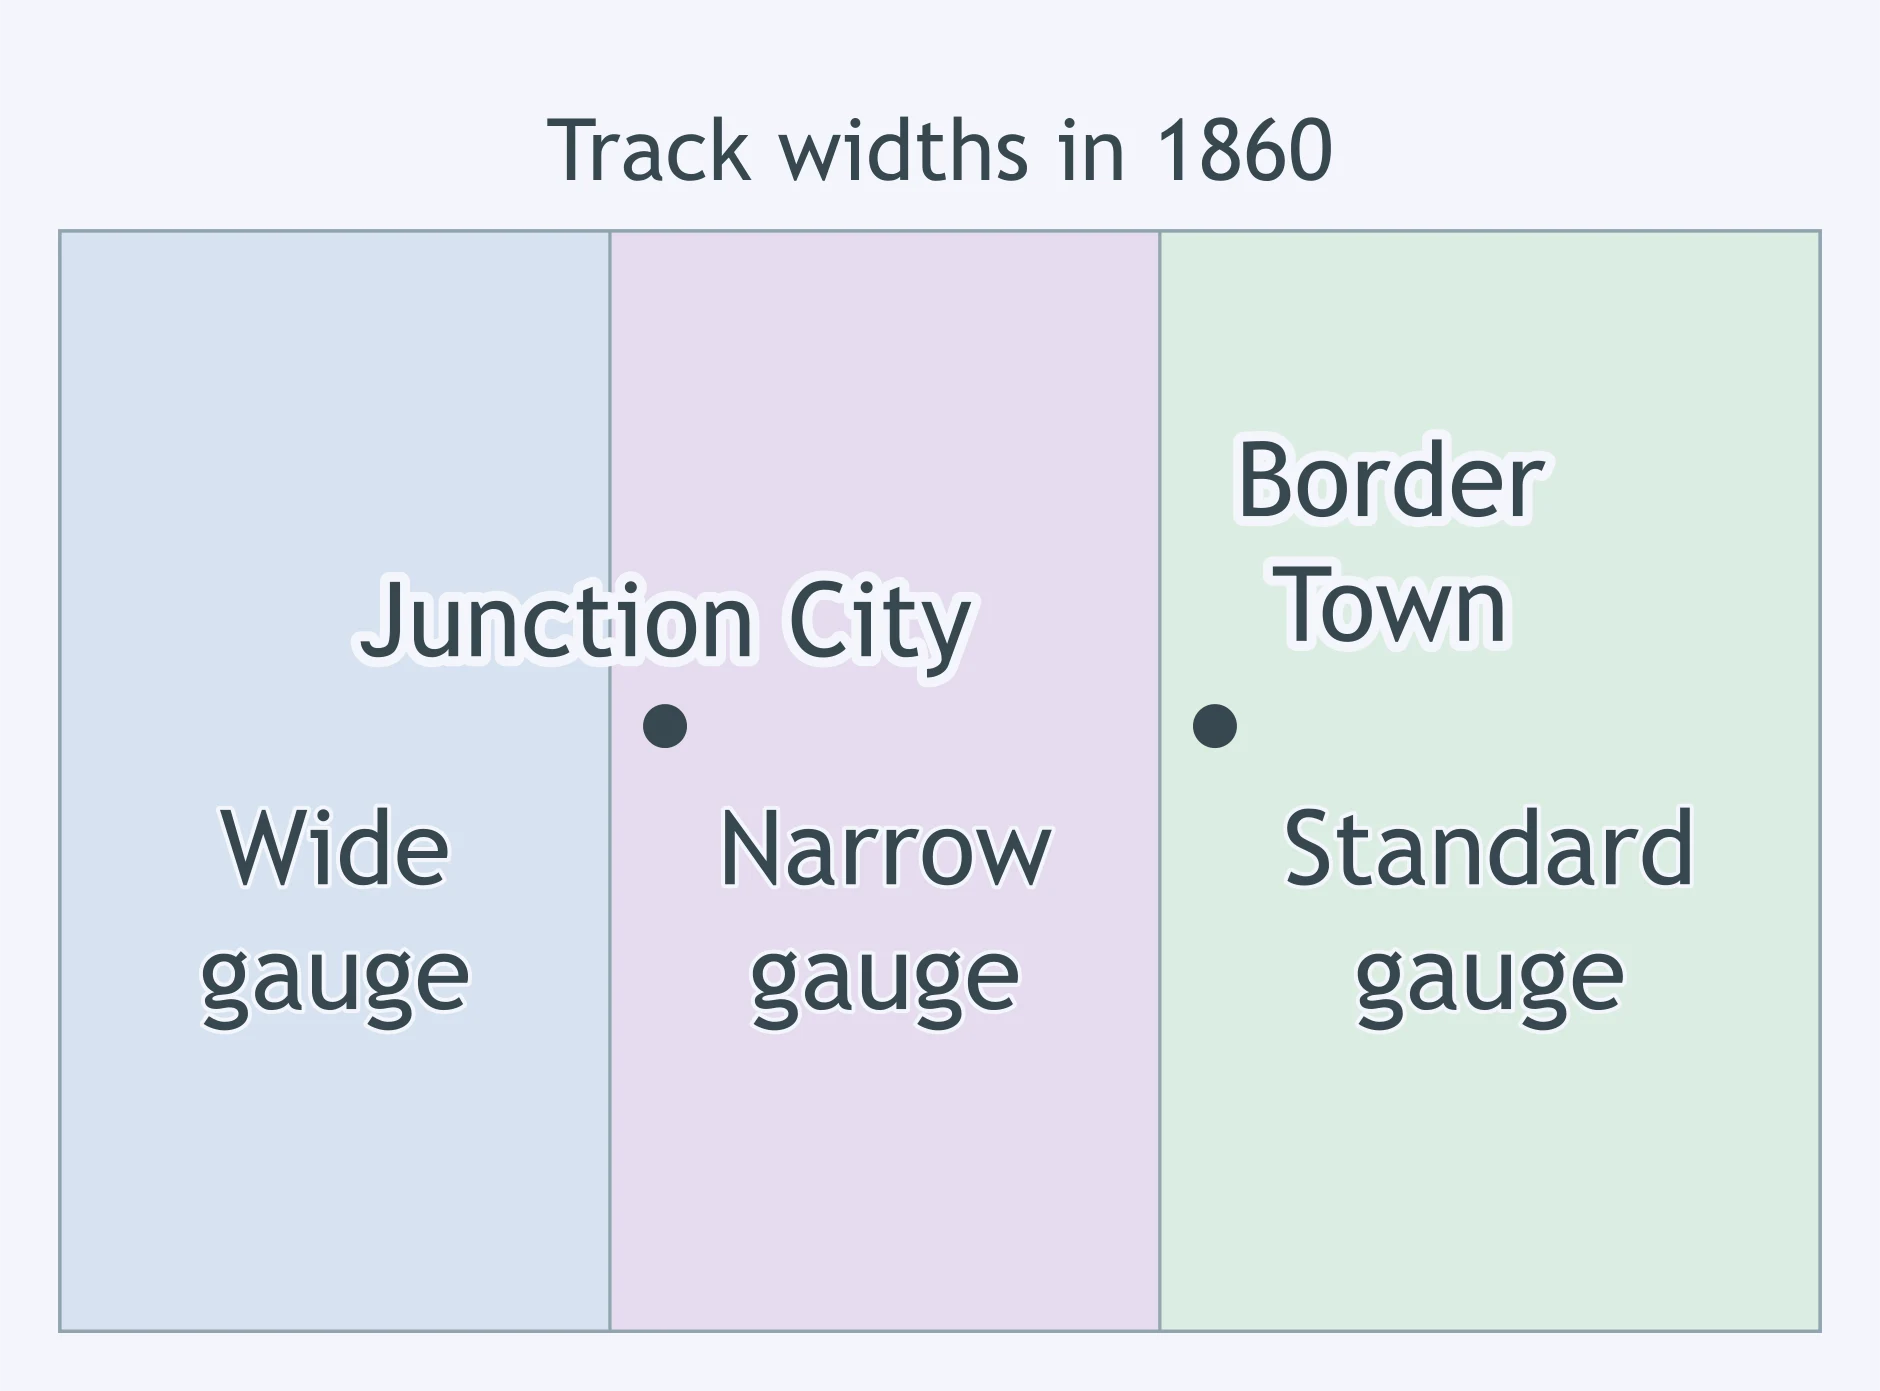
A history text says goods moved freely by rail across a region in 1860. What does the map beside it do to the text?
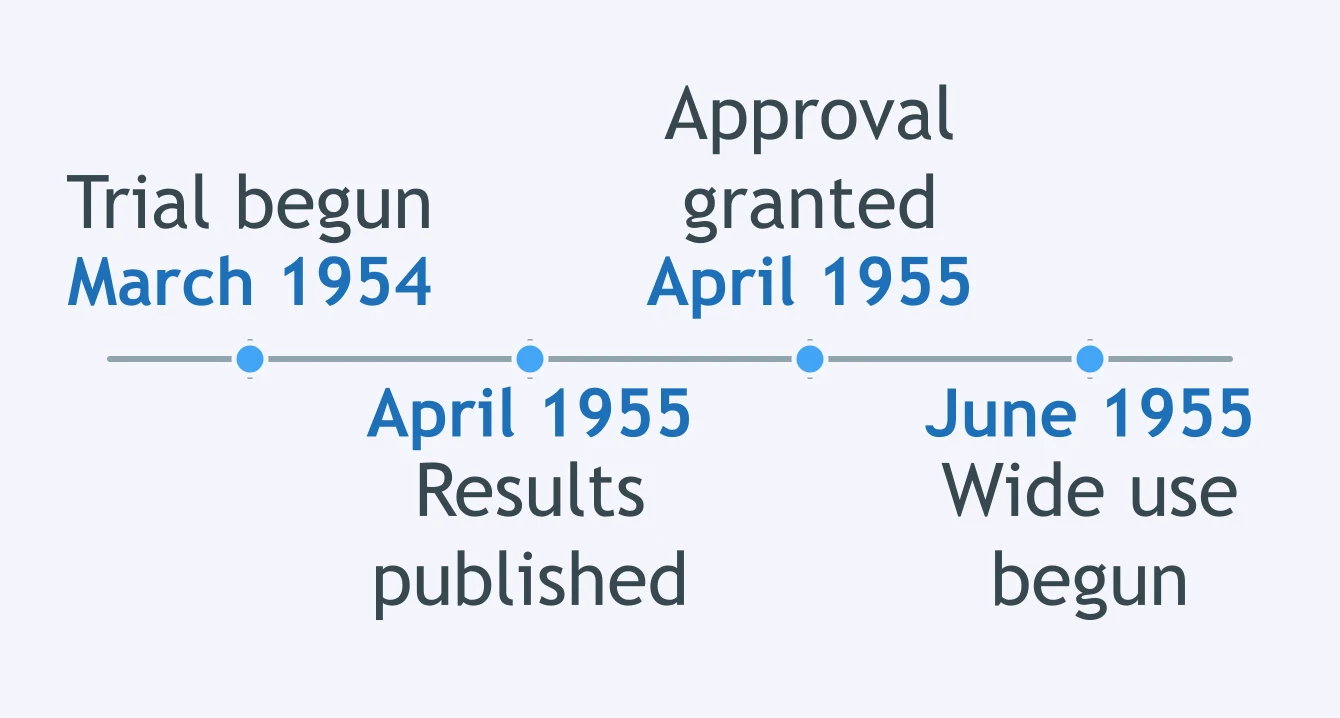
A text says a vaccine trial ran about a year before approval. What does the timeline beside it confirm?
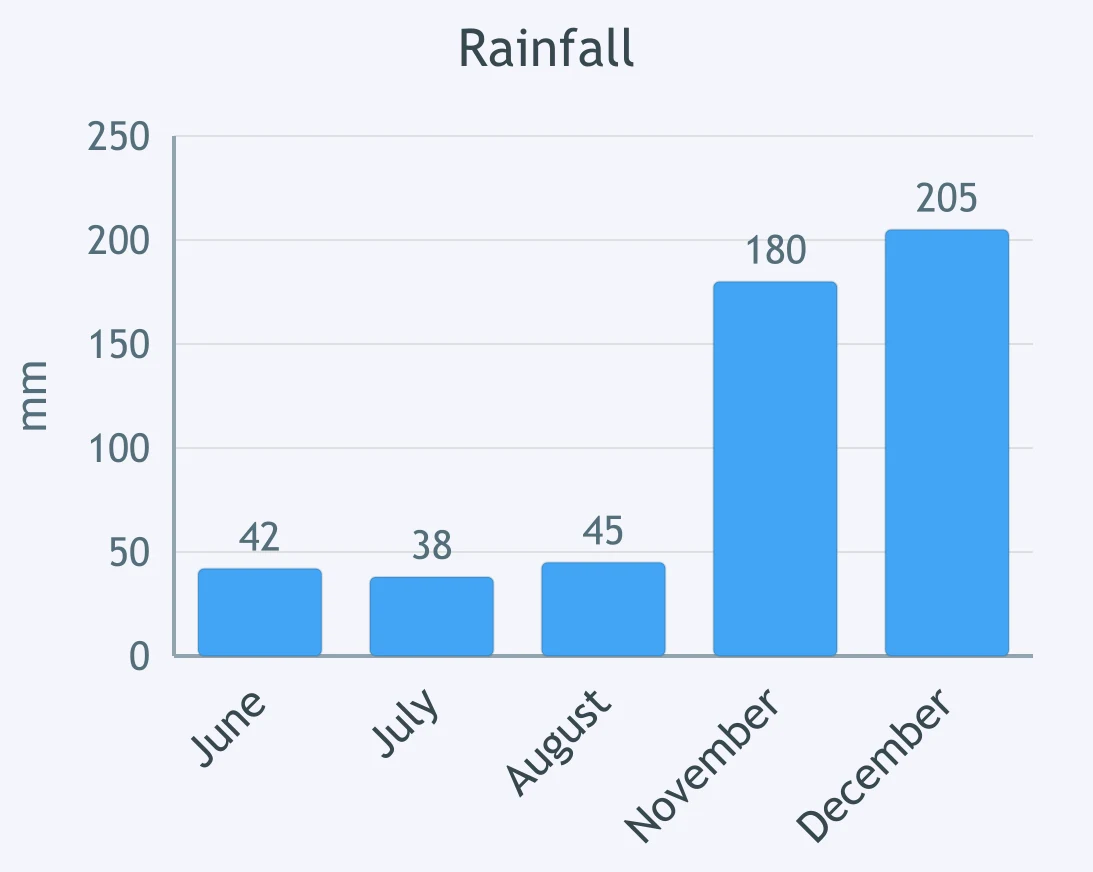
An article says an island is wettest in summer. The bar graph beside it gives the island's rainfall for five months. What does the graph do to the claim?
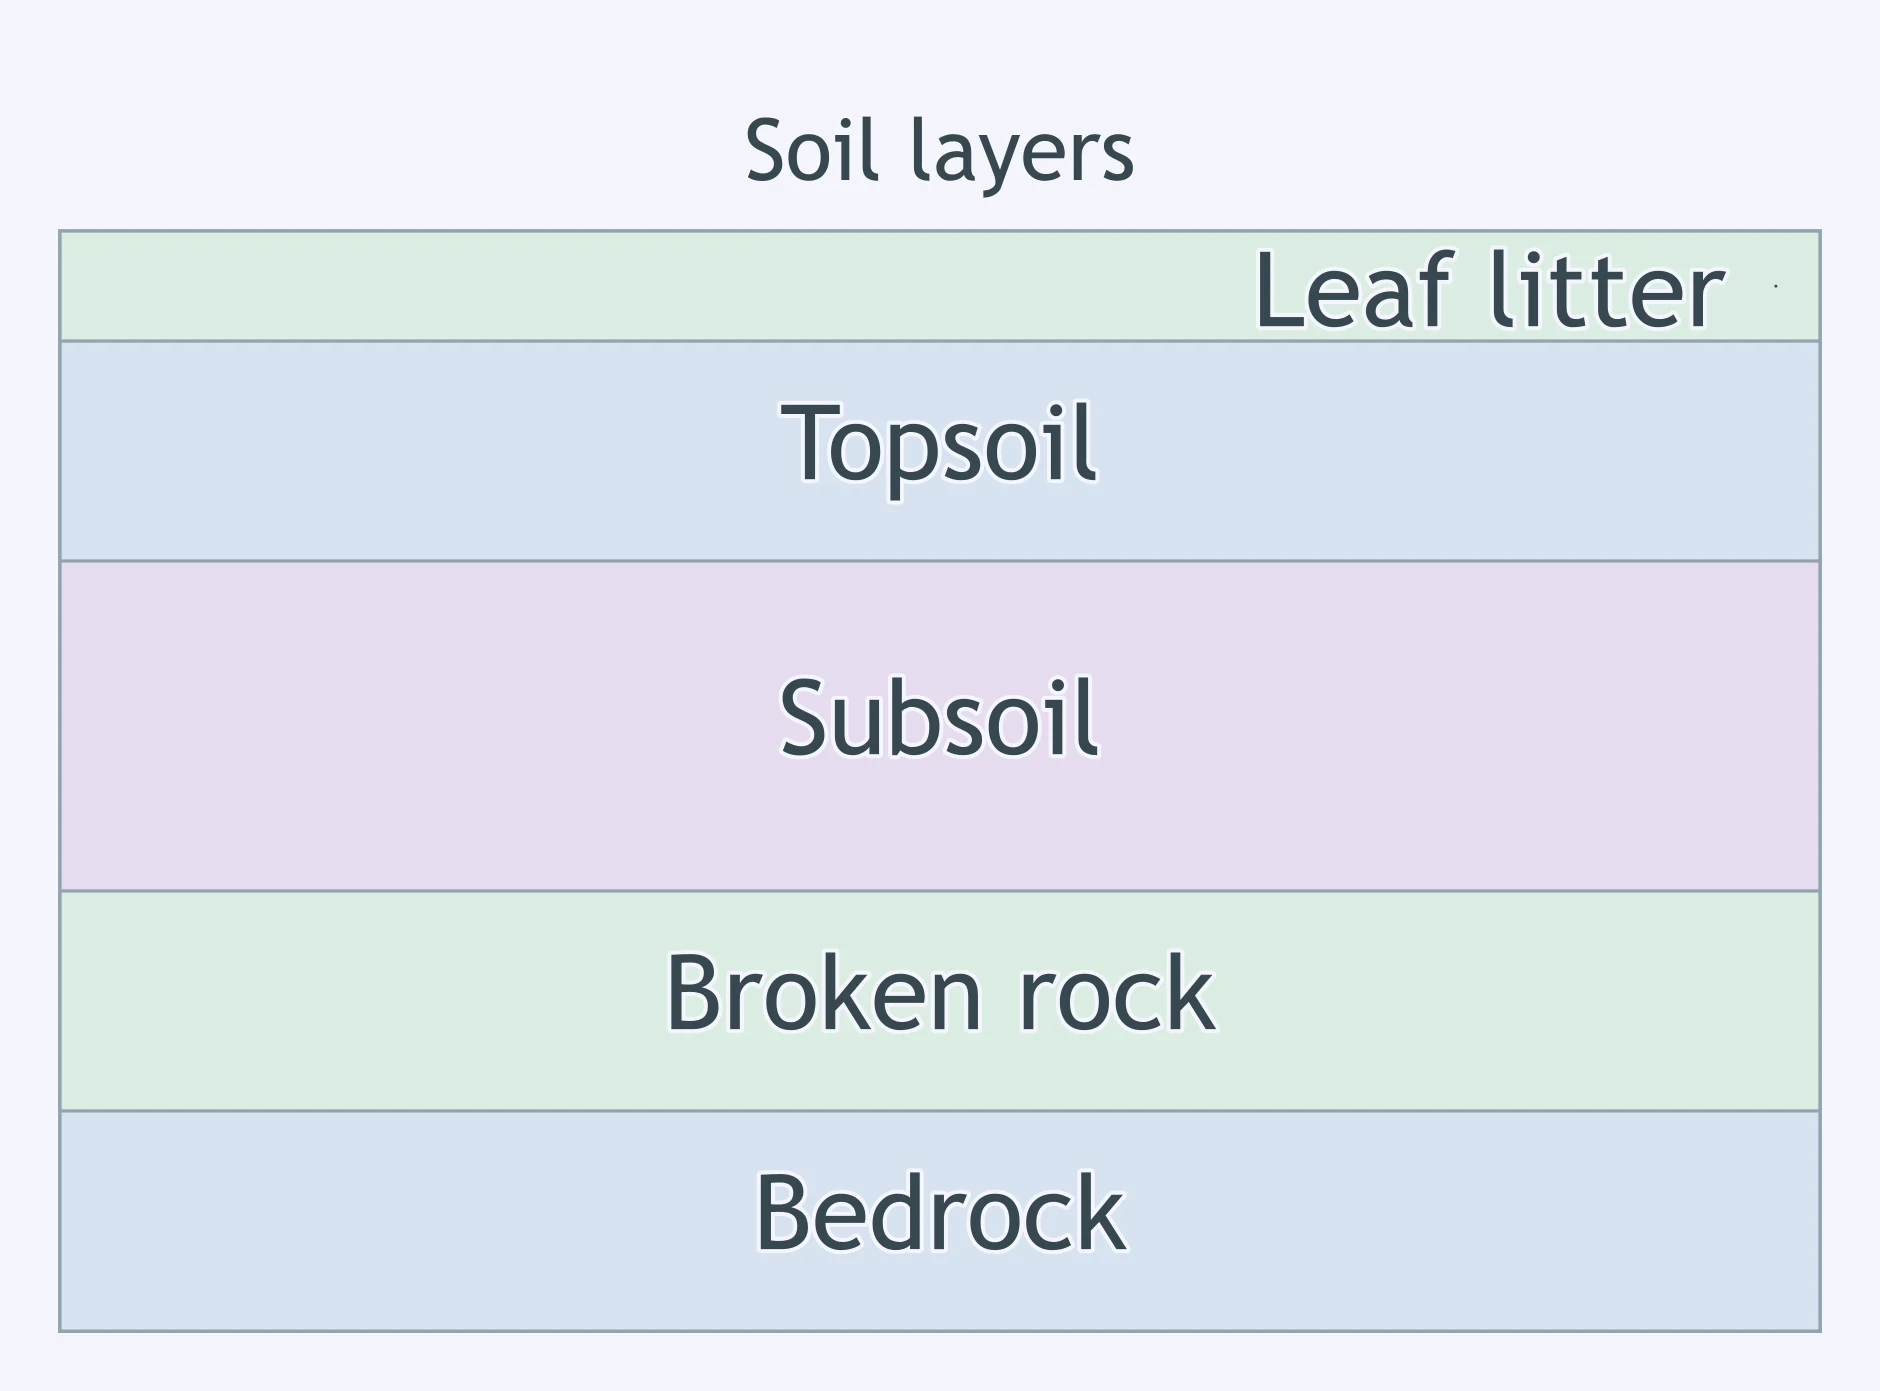
A science text names topsoil, subsoil, and bedrock in order downward. What does the diagram beside it add?
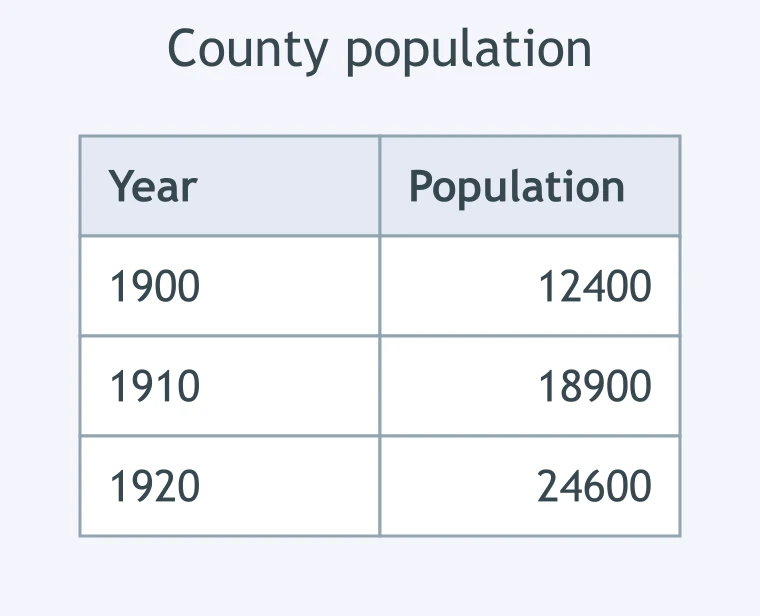
A text says a county's population doubled between 1900 and 1920. What does the table beside it do to the claim?
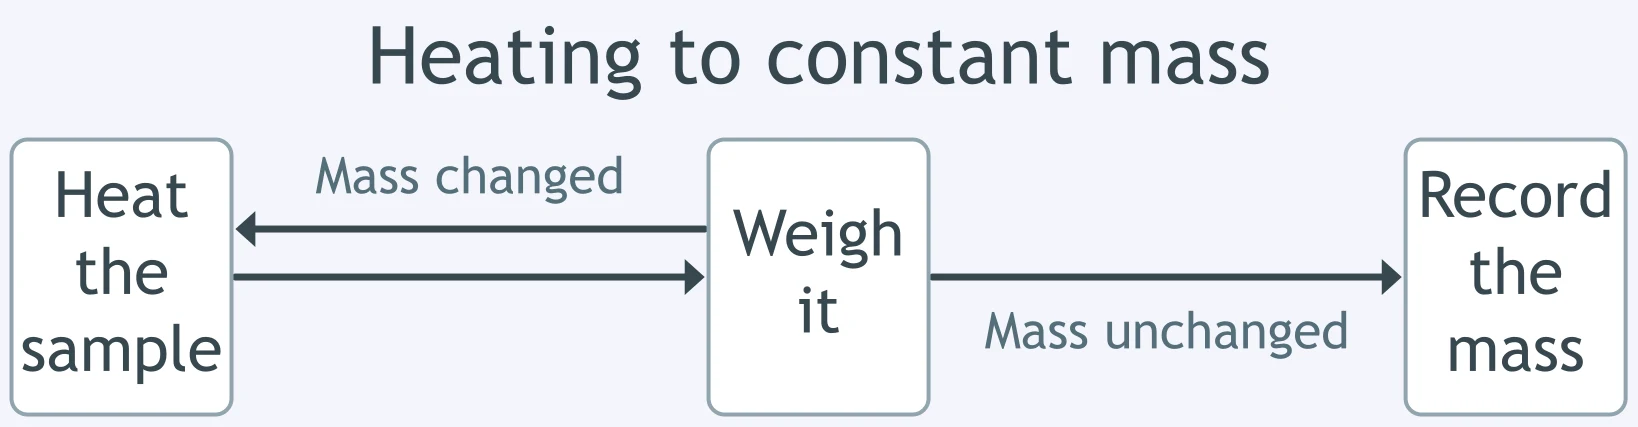
A lab text lists three steps: heat the sample, weigh it, record the mass. What does the flowchart beside it add?
An article says dust storms of the 1930s buried farm machinery. A photograph beside it shows a plow with only its handles standing above a drift of soil. What does the photograph add to the article?
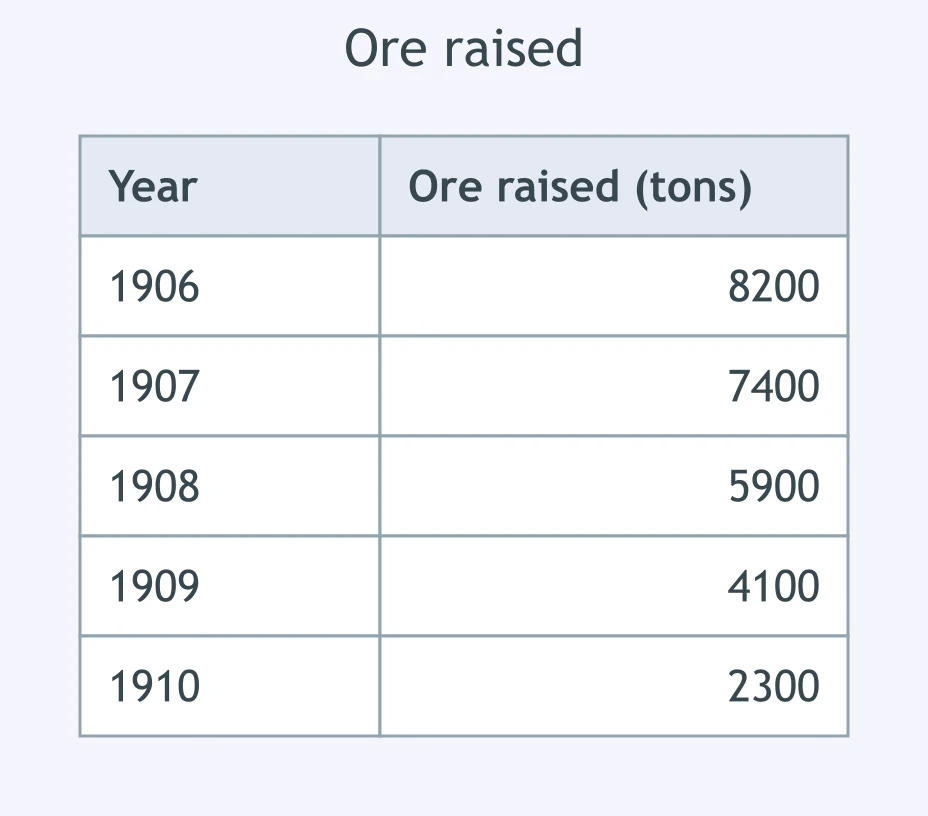
An article explains why a mine closed. Which question does the table beside it answer?
A student writing about a storm has a graph of wind speed by the hour. Which sentence integrates the graph with the written report?
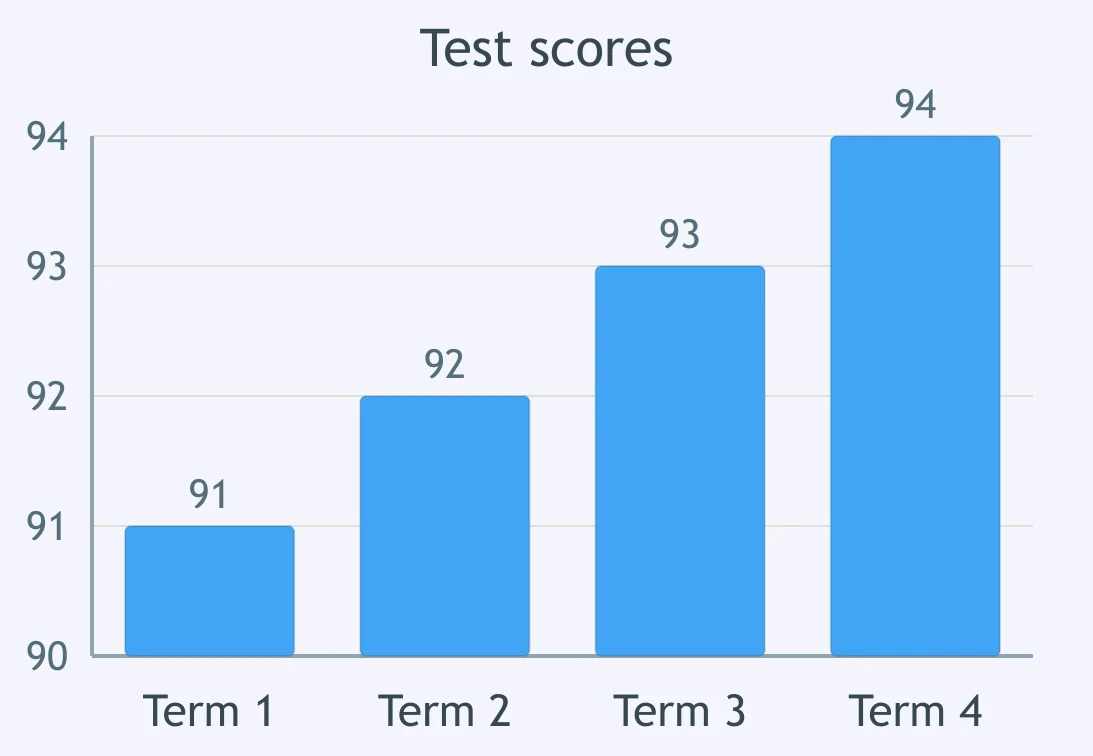
A report says test scores soared. What should a careful reader note about the bar graph beside it and the report together?
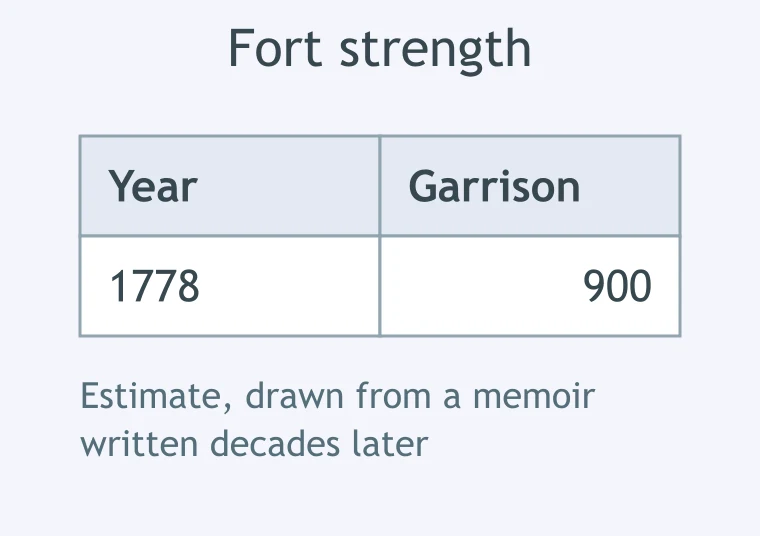
A text states that a fort held exactly 900 soldiers in 1778. A table beside it gives the garrison's strength, with a note on where the figure comes from. What should a reader conclude?
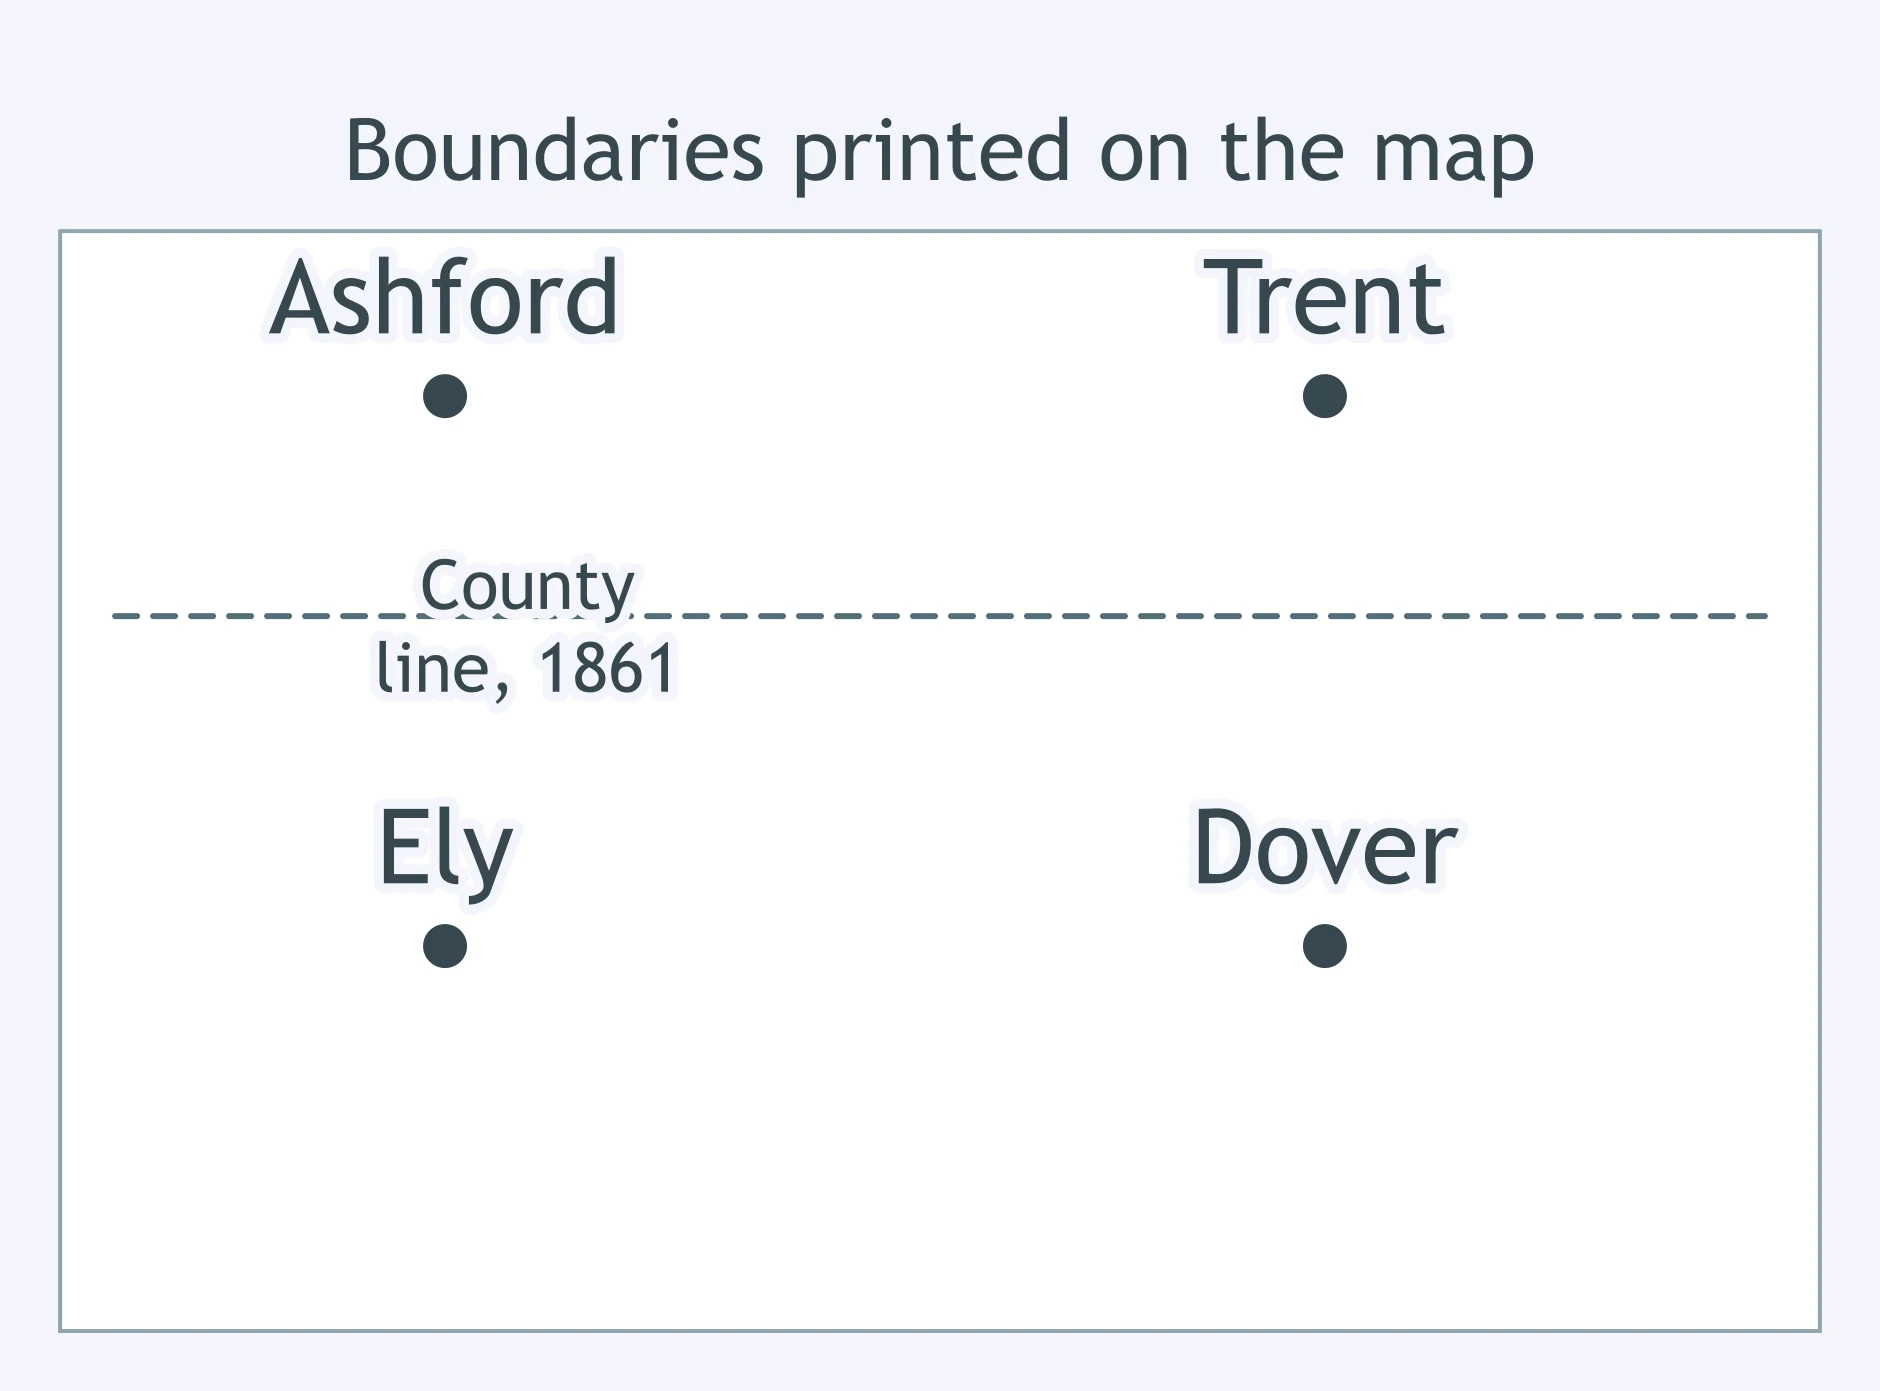
An article discusses county boundaries as they stood in 1890. How should a reader use the map beside it together with the article?
A text says an epidemic ended when a well was closed. A timeline beside it marks the well closed on May 3 and the last case on May 1, while a table shows cases peaking on April 20. What do the two displays together show?
Crack the passcode before the zombies get in.

Pick a tile, answer, hit bonuses and steals.

Revising, Editing, and Trying a New Approach
40 questions