Loading
by BlastRoom
Naming the shape of a distribution from a display, and saying where the tail lies.
#probability_and_statistics
40 questions
One question set, multiple game modes. Tap any game to see it in action. Not sure which to pick?
Answer to place stones and capture territory.
Outrun the snow together.
Earn blasts, then hunt the other team.
Answer to earn energy, then climb.

The class blasts through walls together.
Bid on mystery lots. Most money wins.
Sell tours. Nice, standard, or a total scam.

Answer, restock, and serve the rush.
More correct answers pulls the rope your way.
Answer, then shoot down the alien wave.
Answer, then tap to leap the frozen ridge.
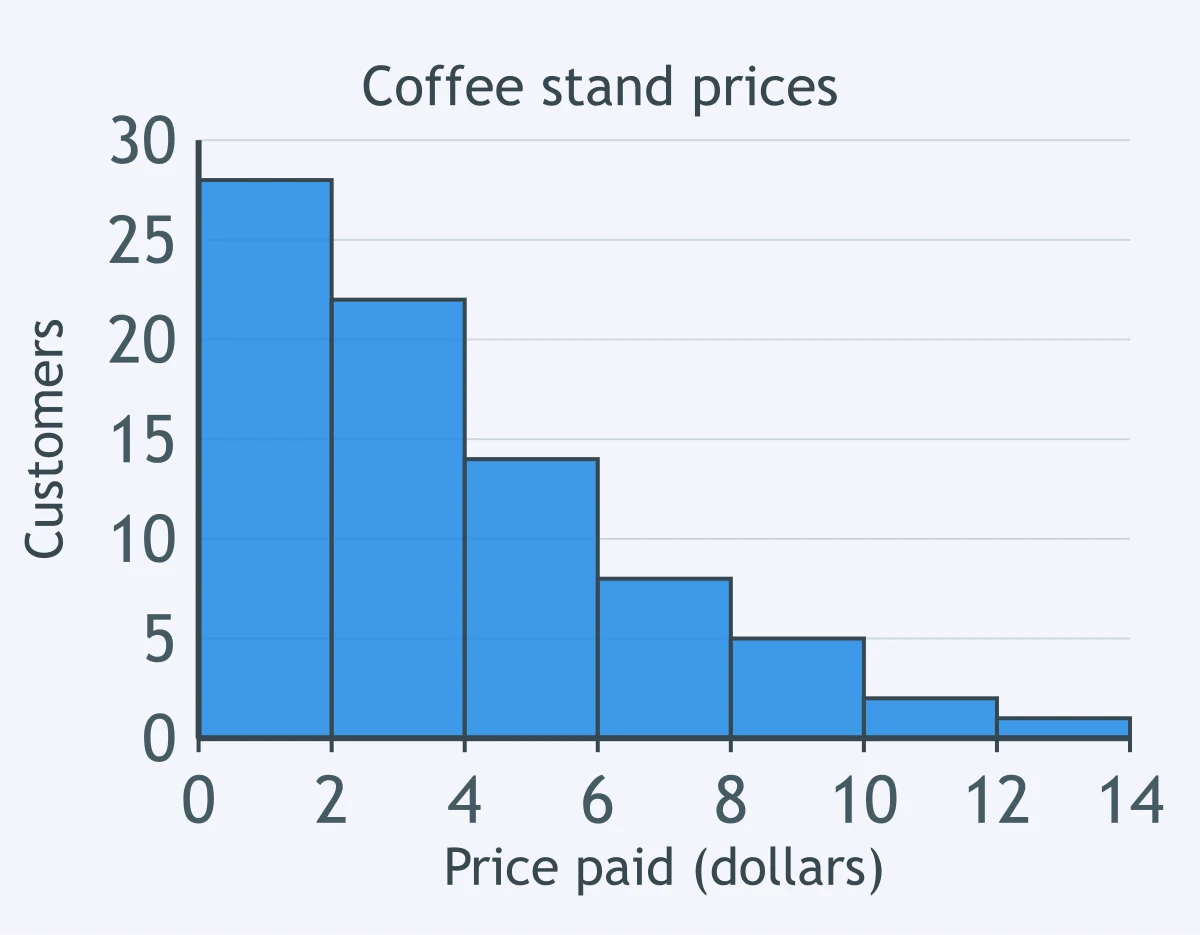
A histogram shows prices in dollars paid by 80 coffee stand customers, with class width 2 from $0 to $14. What shape does the display show?
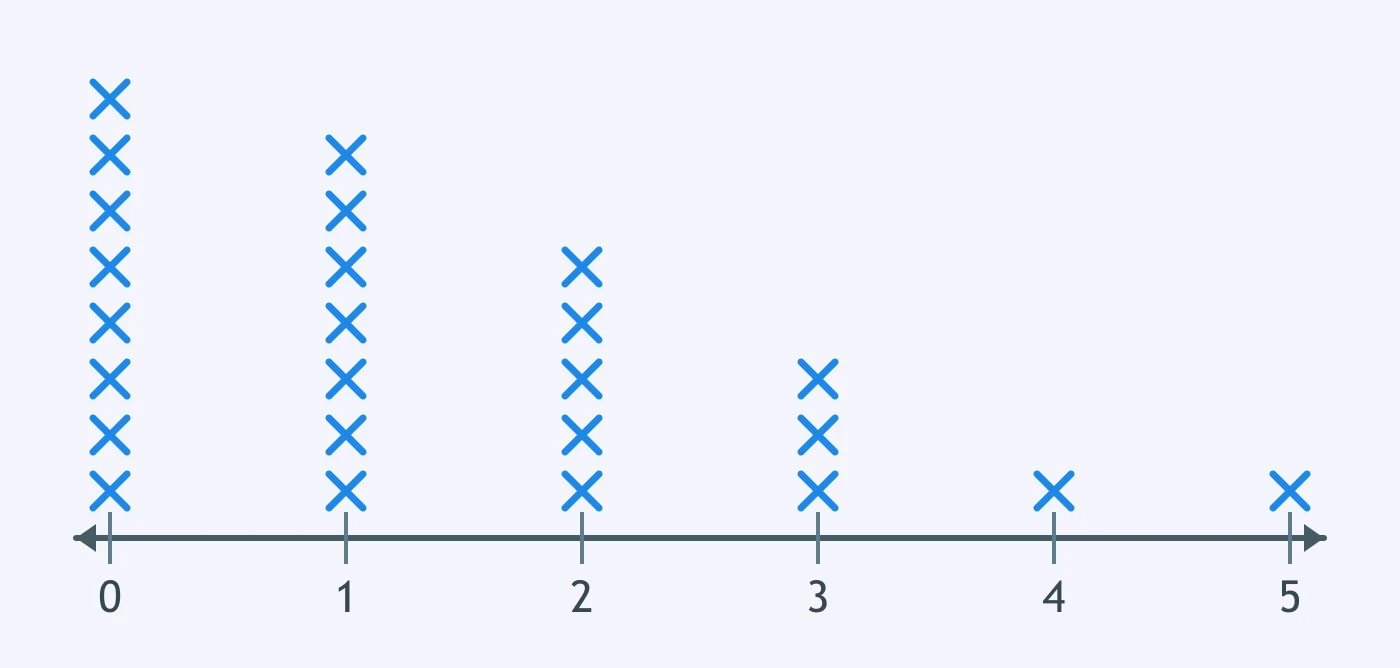
The dot plot shows numbers of siblings reported by 25 students. What shape best describes the distribution?
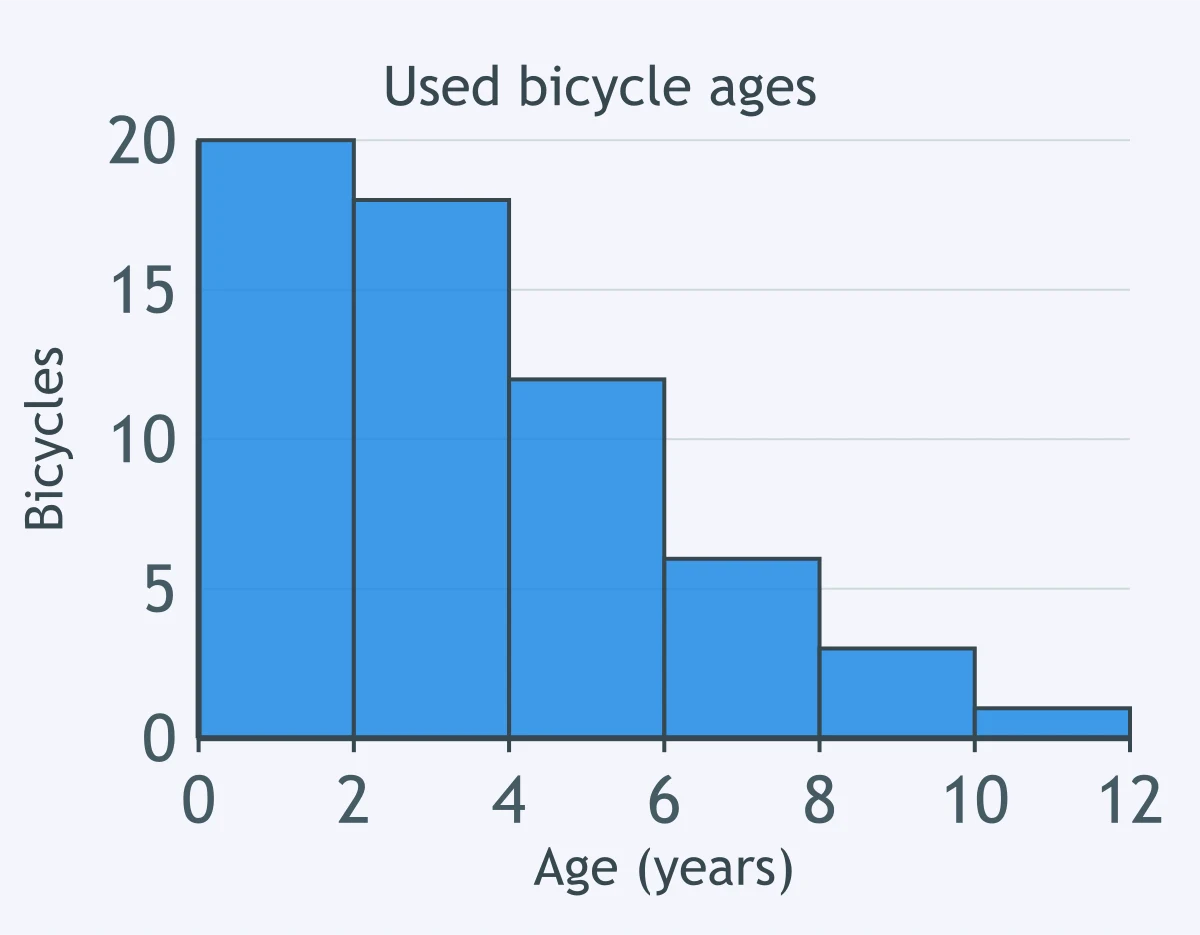
Use the histogram of ages, in years, of 60 used bicycles for sale. On which side does the distribution's tail lie?
For 200 household incomes in one town, the mean is $78,400 and the median is $54,100. What shape is suggested by the mean being much larger than the median?
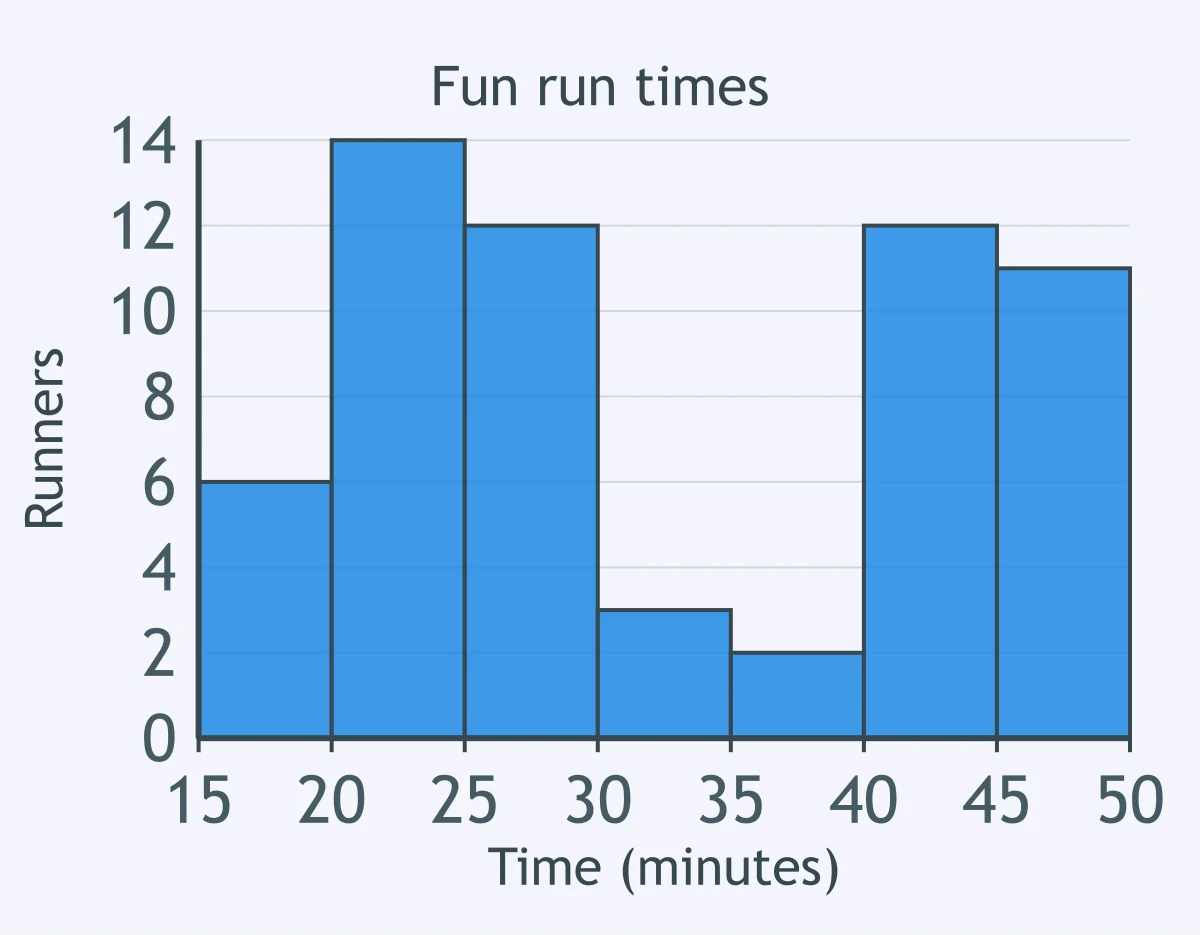
The histogram shows finishing times, in minutes, for 60 runners in a fun run, with class width 5 from 15 to 50. What secondary feature stands out?
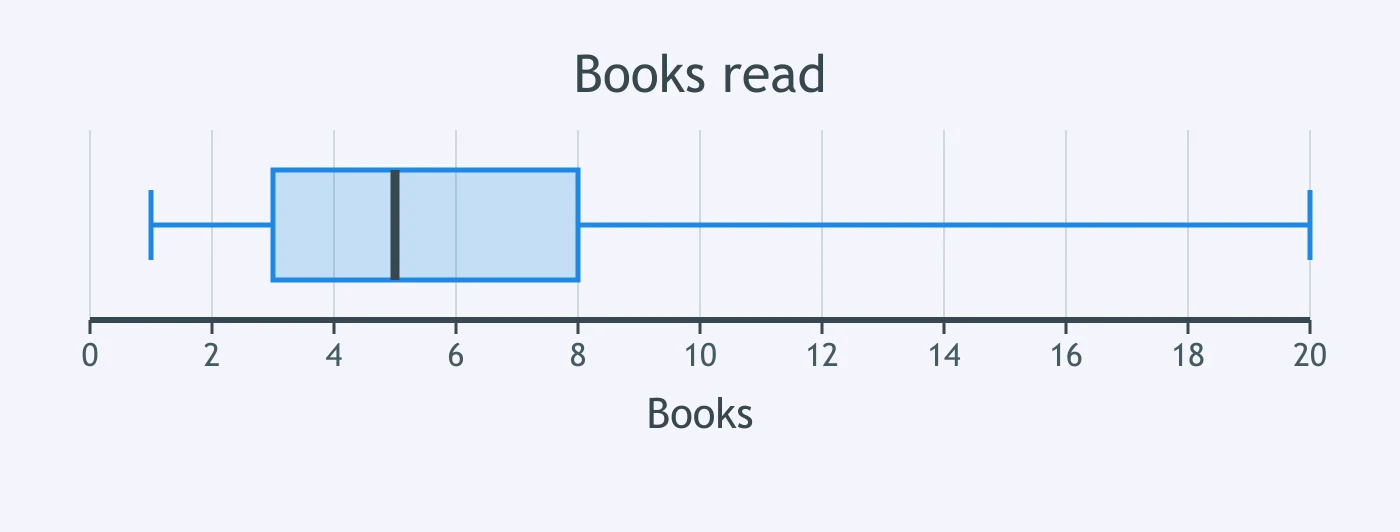
A box plot shows numbers of books read last year by 50 library members, on an axis from 0 to 20 books. What shape does the plot indicate?
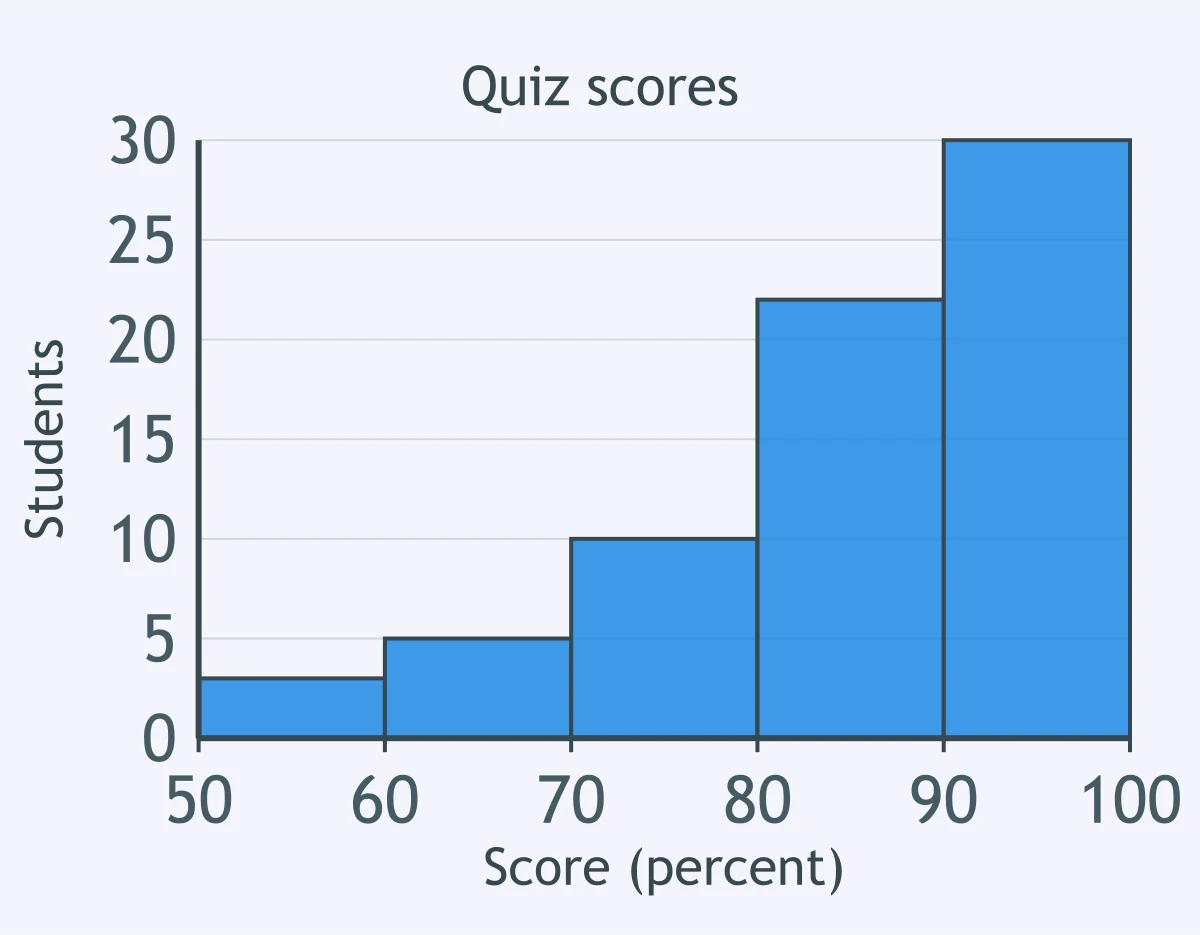
In a histogram of 70 quiz scores, in percent, classes run from 50 to 100 with width 10. What overall shape is shown?
A dot plot records books read this month by 30 students. What shape describes the dot pattern?
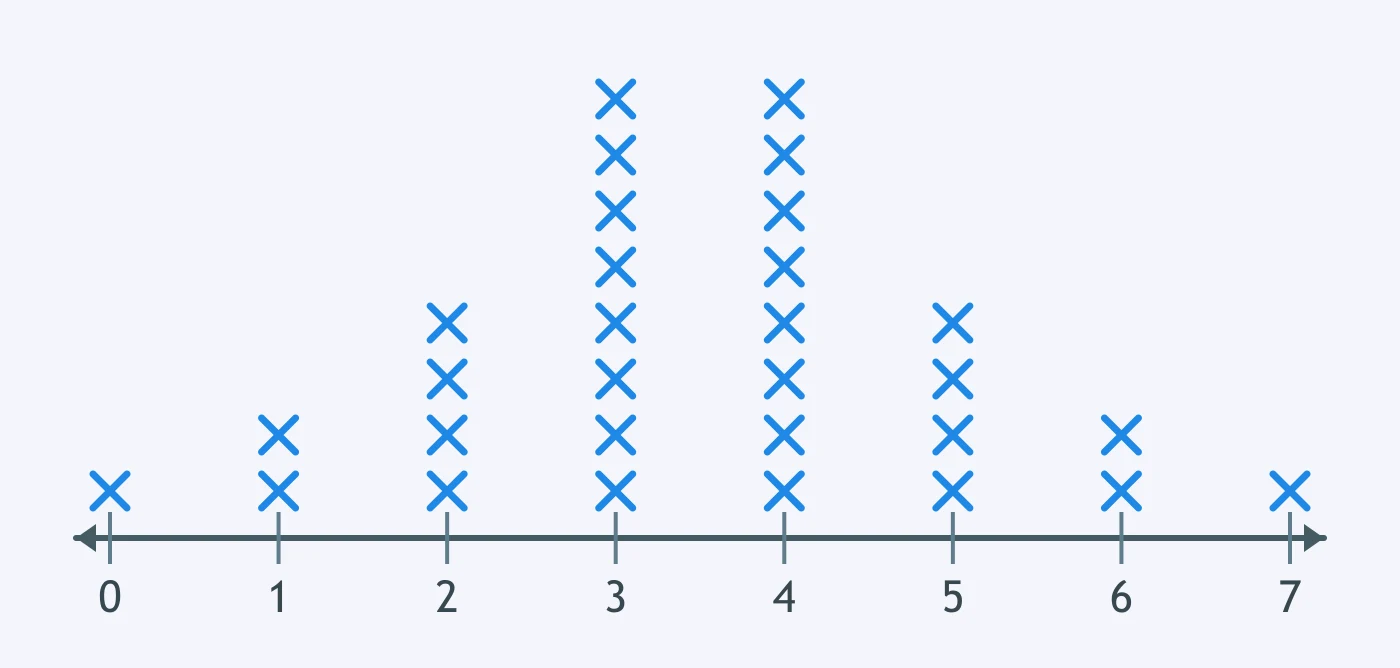
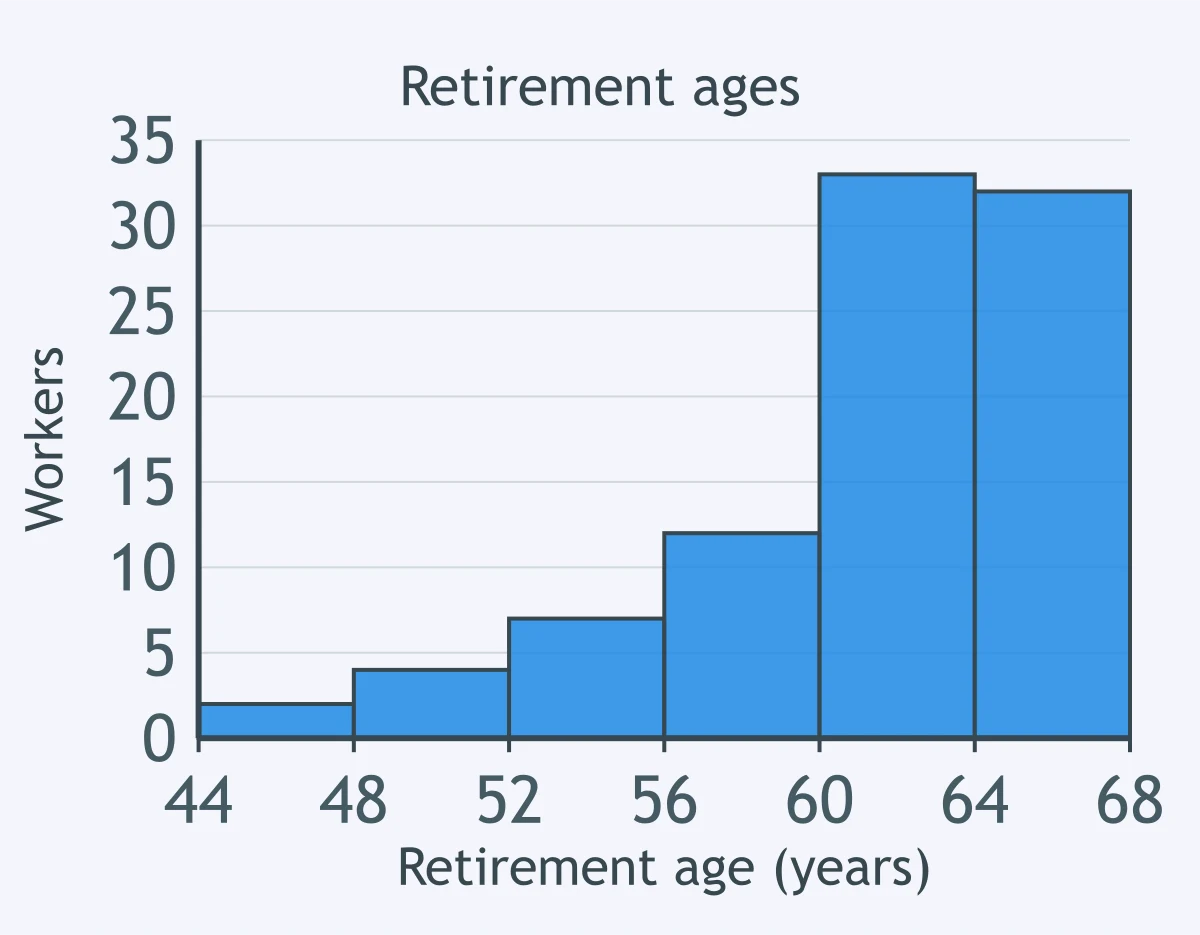
The histogram gives retirement ages, in years, for 90 workers, with four-year classes from 44 to 68. Where is the tail?
For 45 students' times to finish a puzzle, the mean is 6.8 minutes and the median is 8.1 minutes. What shape is suggested by the mean being below the median?
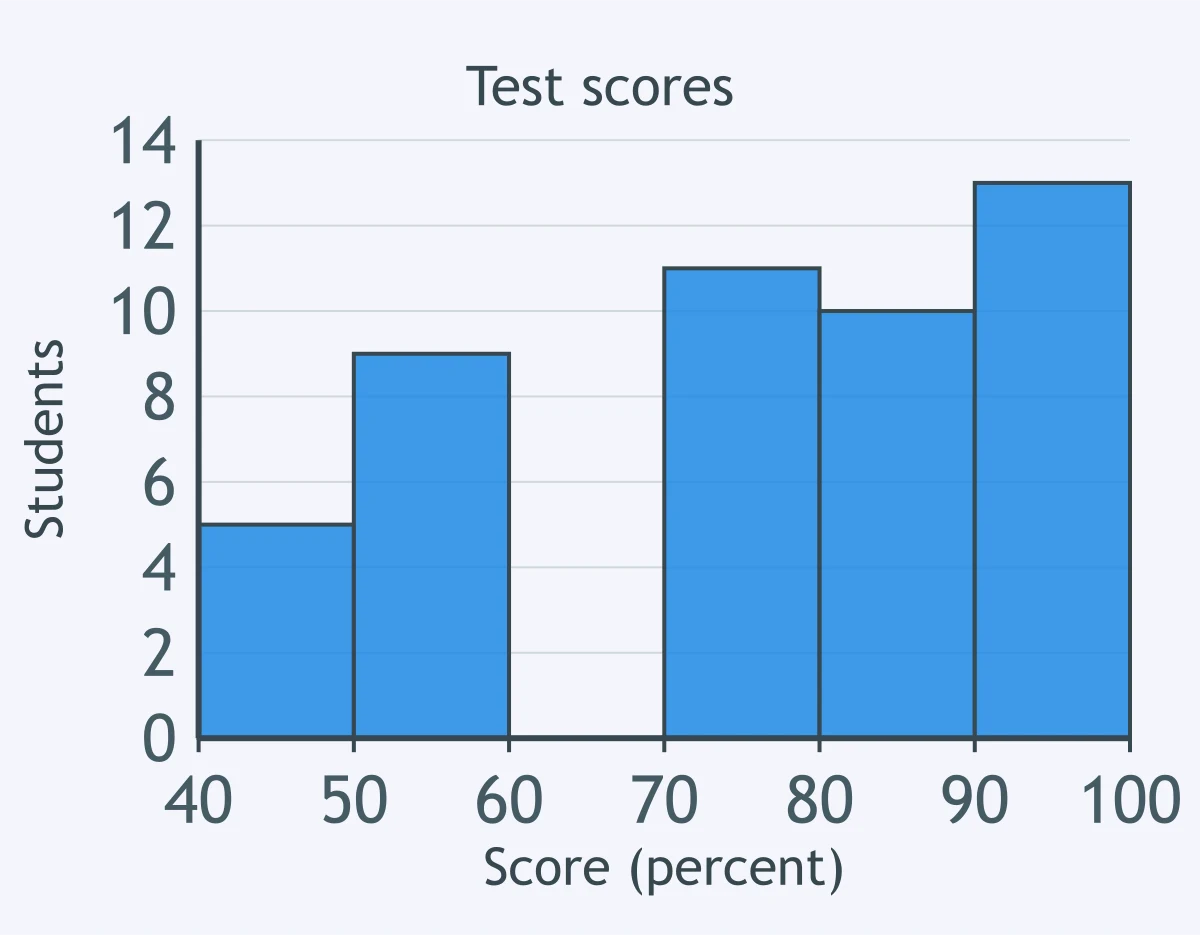
A histogram displays test scores, in percent, for 48 students, using width-10 classes from 40 to 100. What feature is visible?
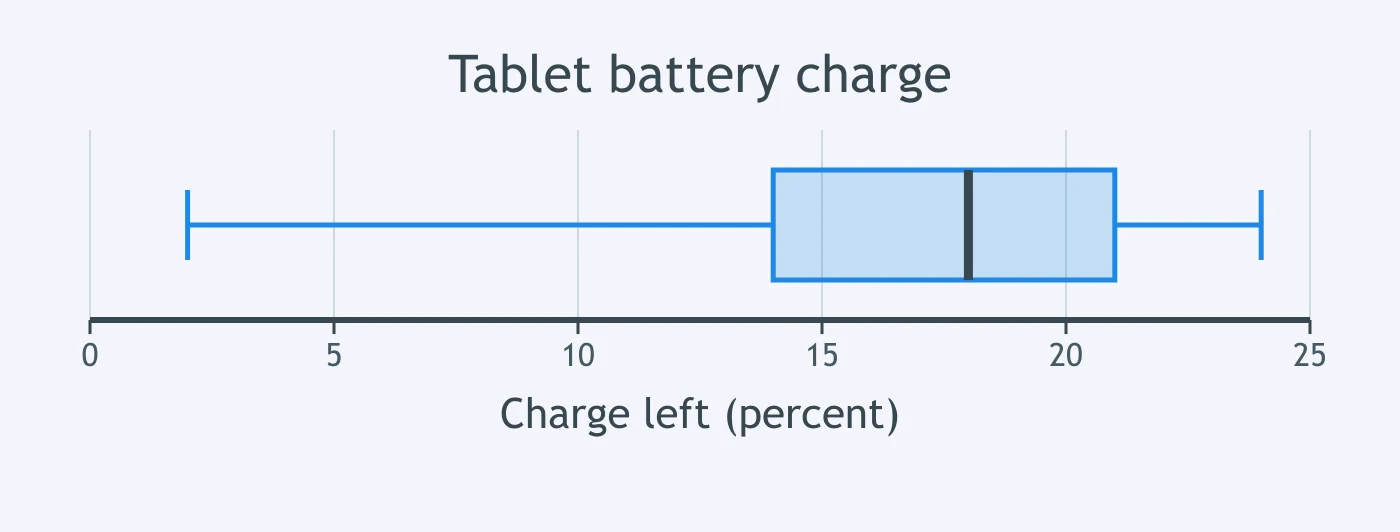
The box plot summarizes battery charge left, in percent, for 40 tablets at day's end, on an axis from 0 to 25 percent. What shape is indicated?
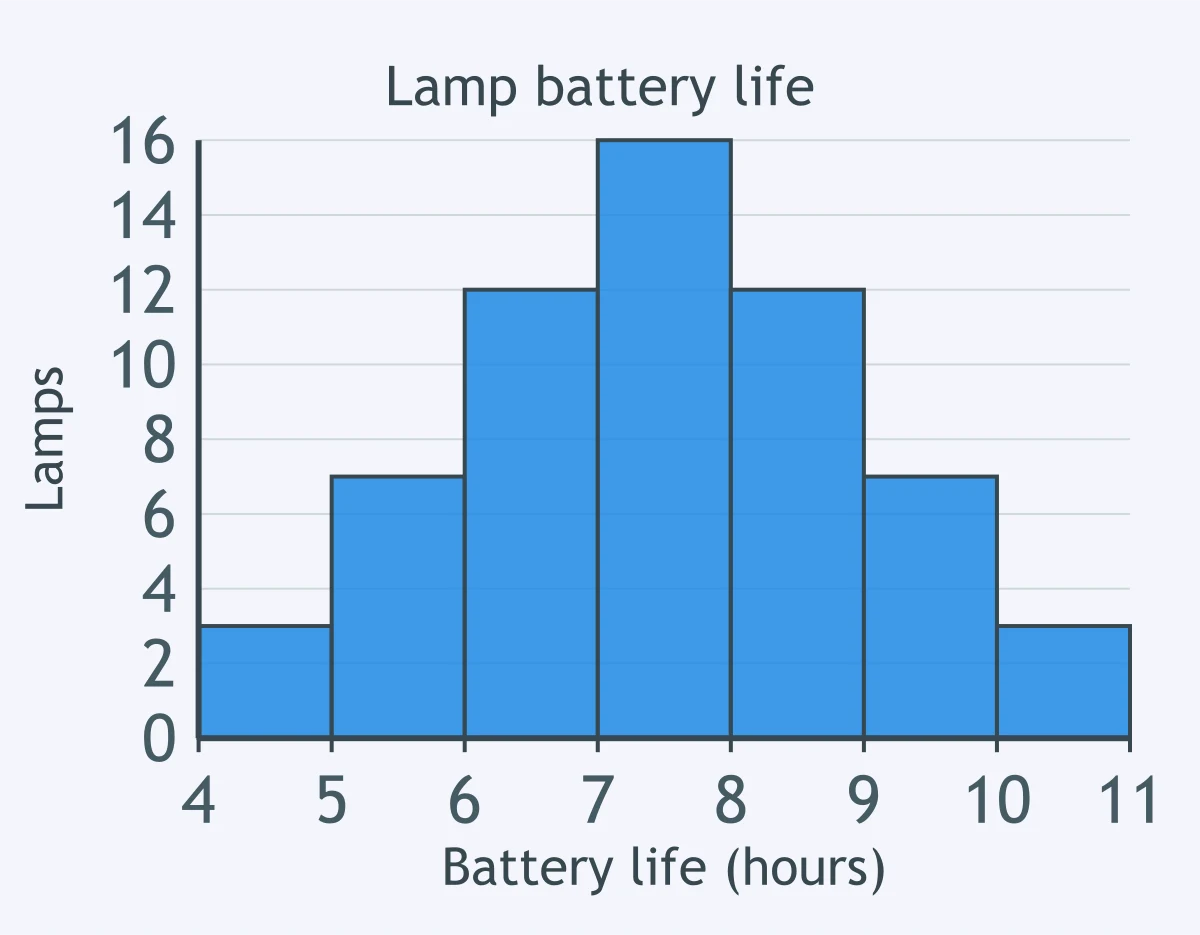
A histogram summarizes battery life, in hours, for 60 rechargeable lamps, with class width 1 from 4 to 11. What shape does the distribution have?
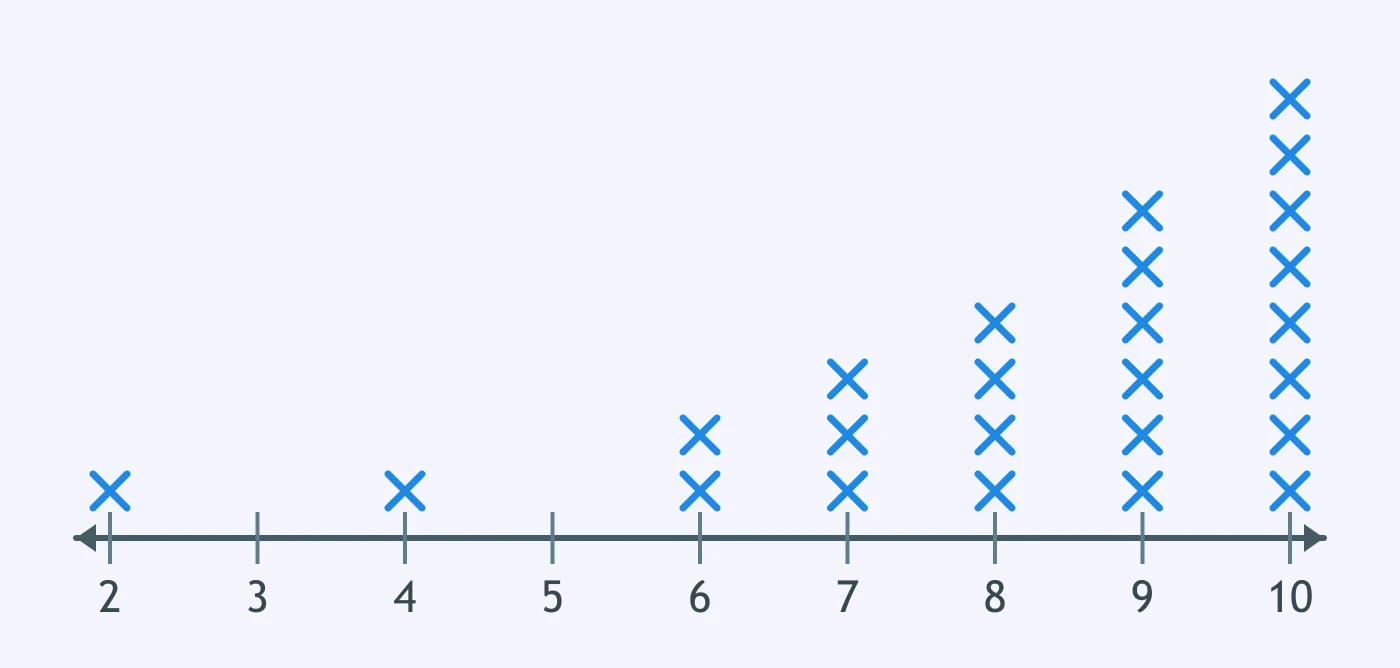
A dot plot shows daily biking distances, in kilometers, for 25 club rides. What shape is shown by the dots?
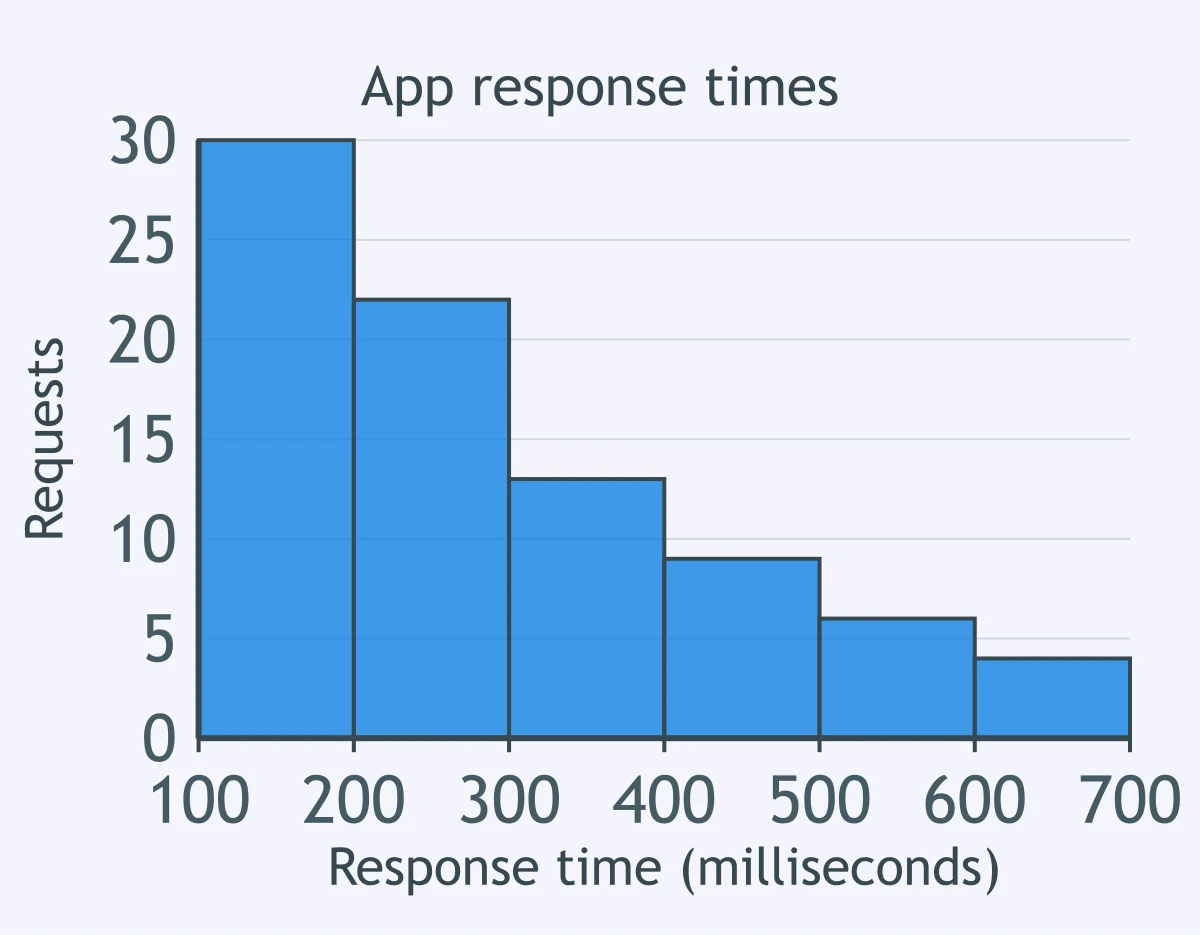
In the histogram of app response times, in milliseconds, for 84 requests, classes run from 100 to 700 by 100. On which side is the tail?
For 90 service ratings on a 1 to 10 scale, the mean is 7.1 and the median is 7.0. What shape is most consistent with those summaries?
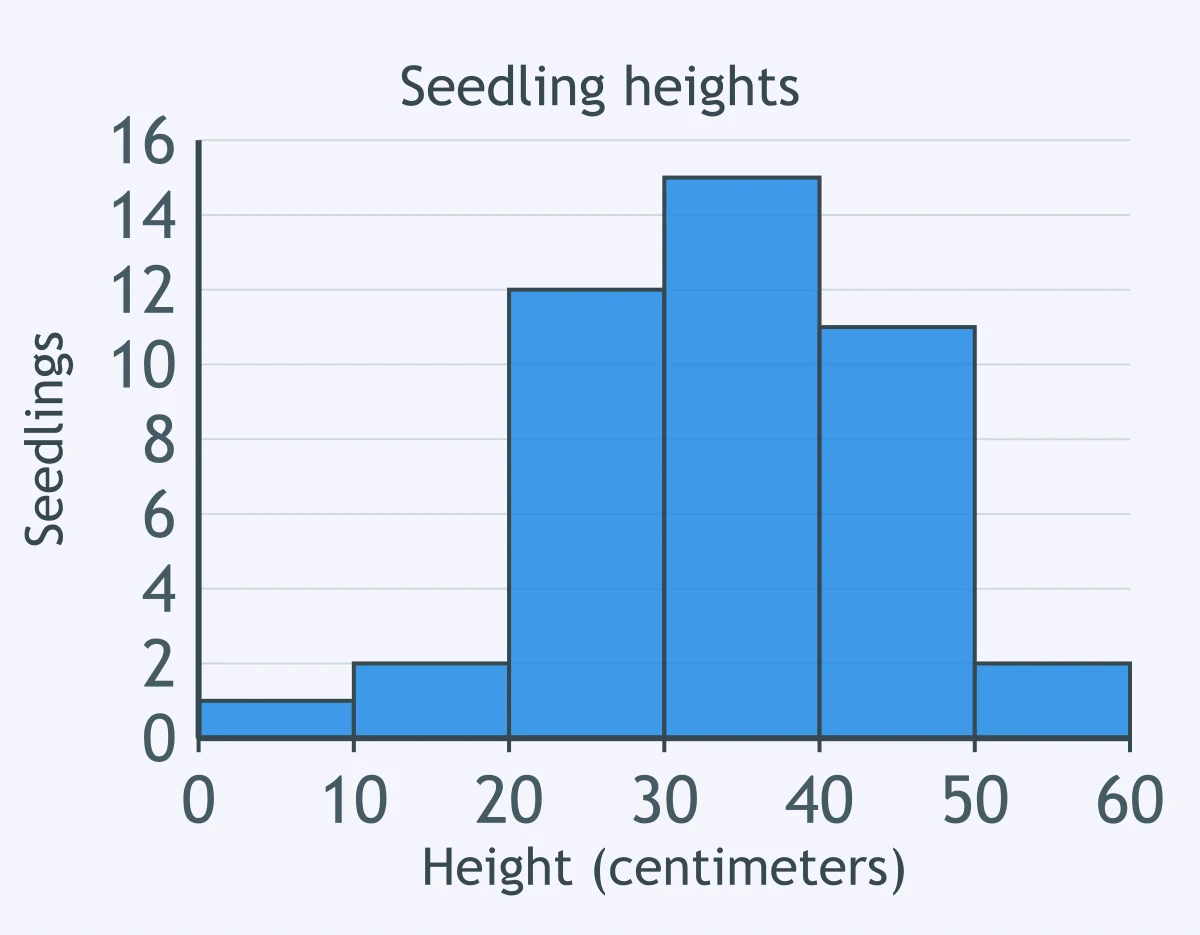
The histogram shows plant heights, in centimeters, for 43 seedlings, with class width 10 from 0 to 60. What feature is most noticeable?
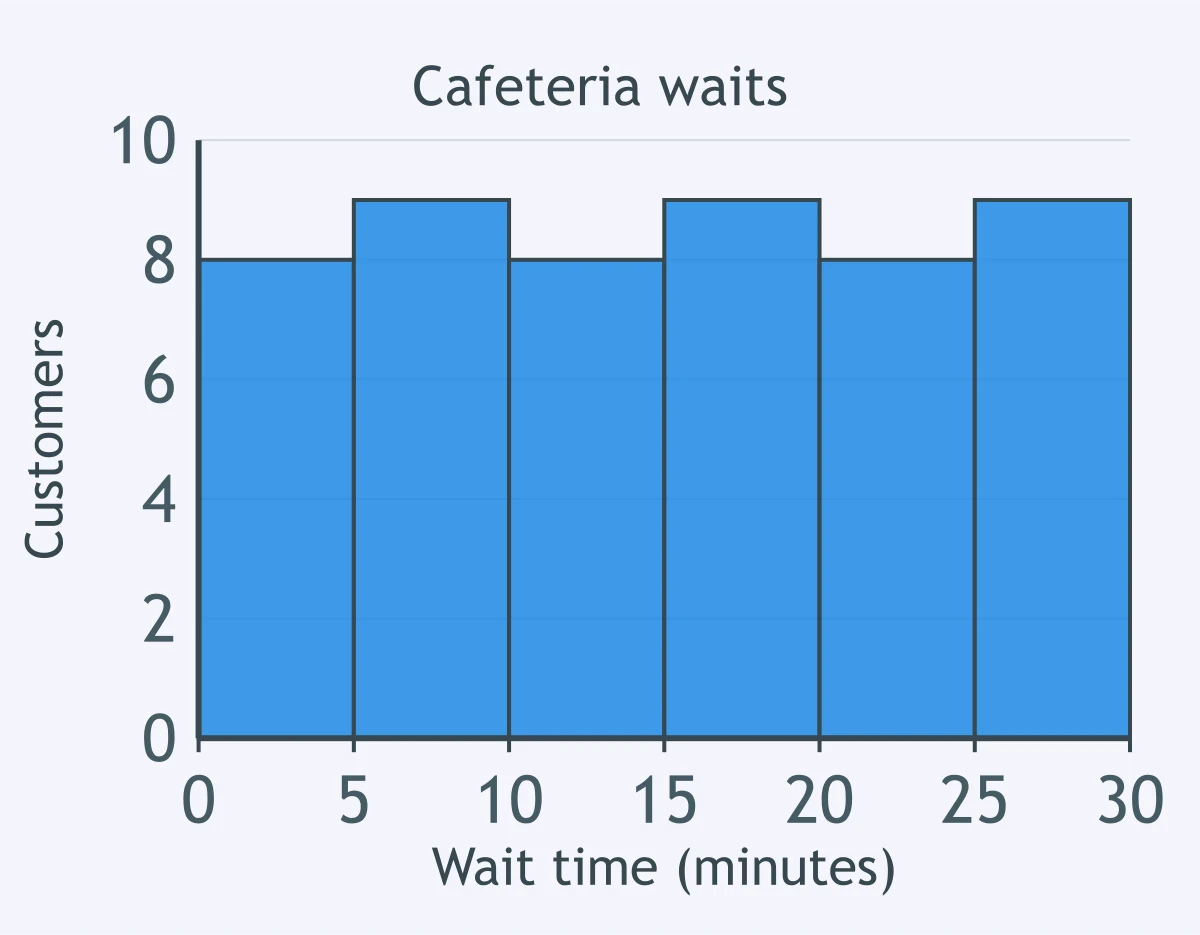
A box plot shows lengths, in centimeters, of 36 pencils, on an axis from 10 to 40 centimeters. What shape does the plot suggest?
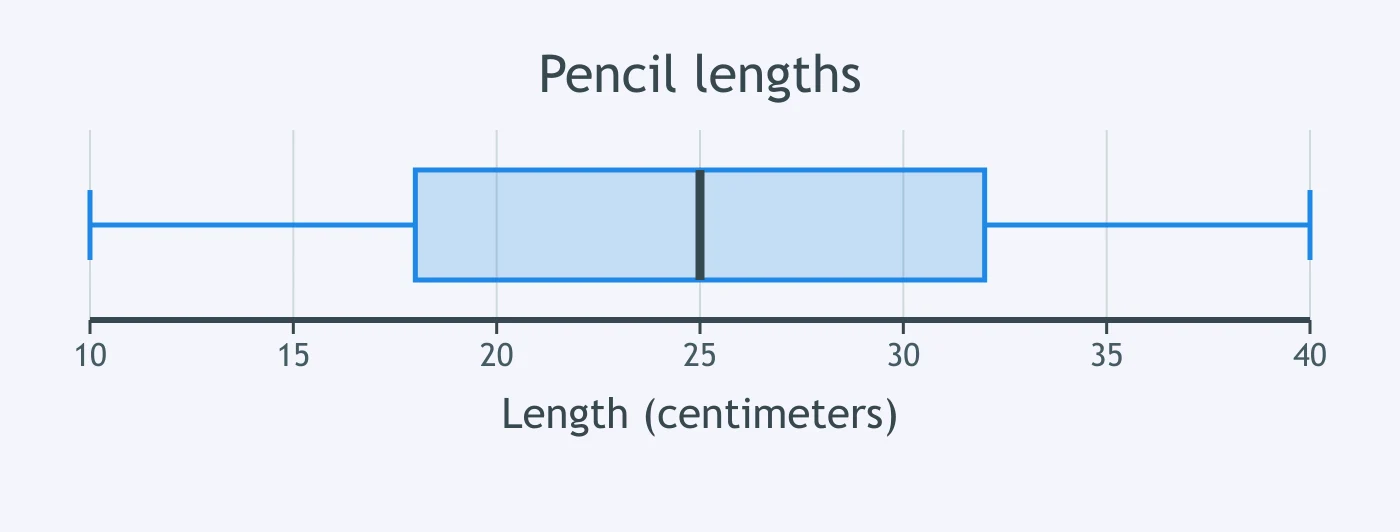
A histogram shows waiting times, in minutes, for 51 cafeteria customers, with class width 5 from 0 to 30. What is the shape?
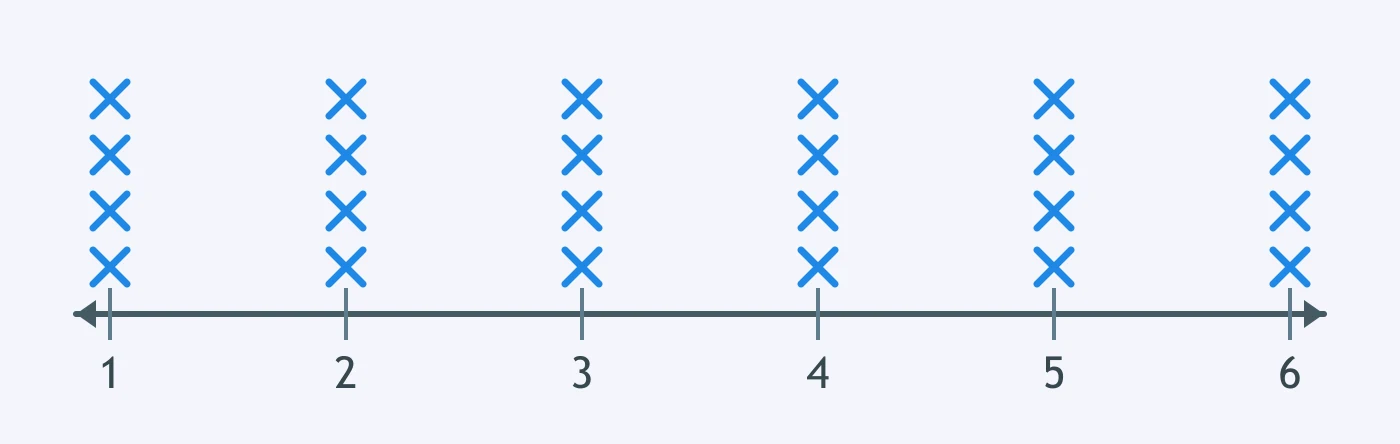
The dot plot records the number of practice problems completed by 24 students, from 1 to 6 problems. What shape does it show?
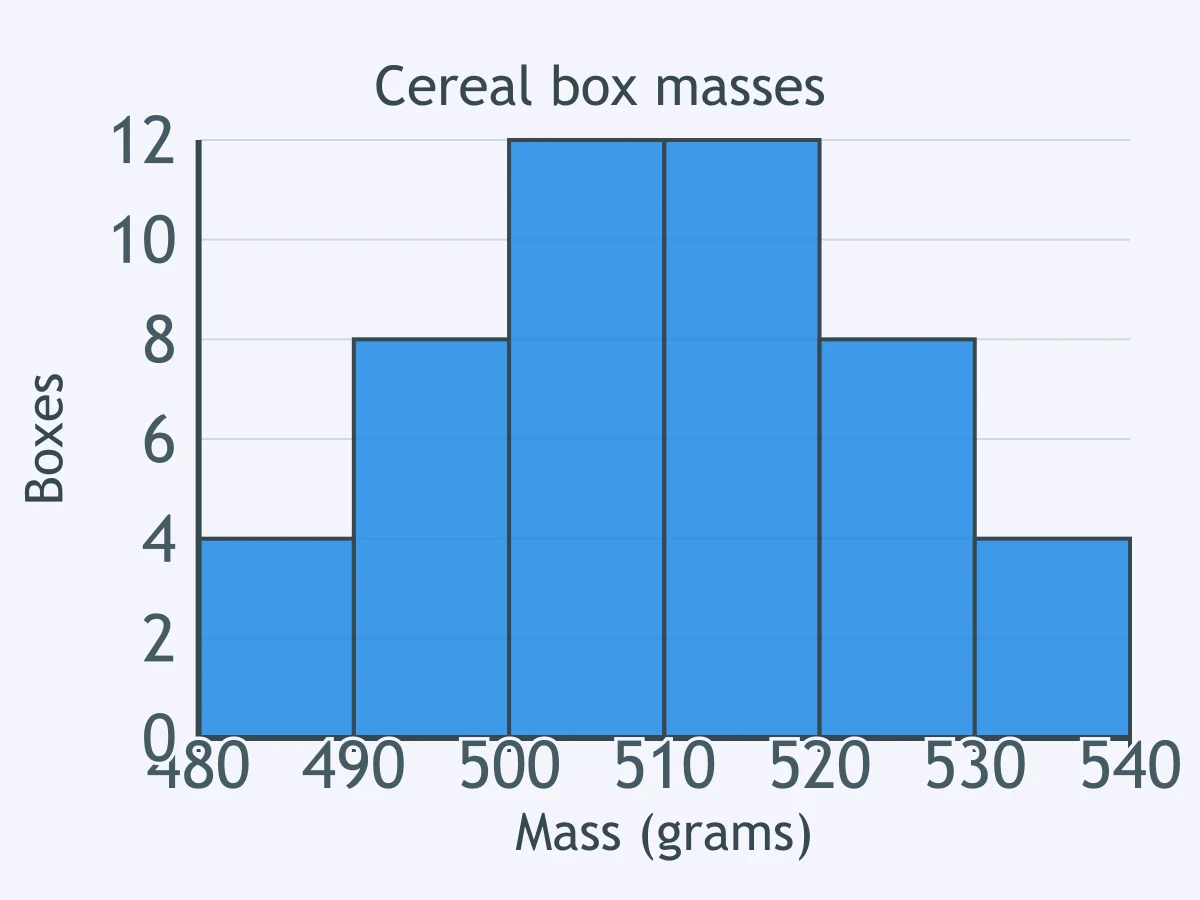
A histogram gives cereal box masses, in grams, for 48 boxes, from 480 to 540 in classes of width 10. How are the tails arranged?
For 120 online donation amounts, the mean is $46 and the median is $25. What shape is suggested by the mean being greater than the median?
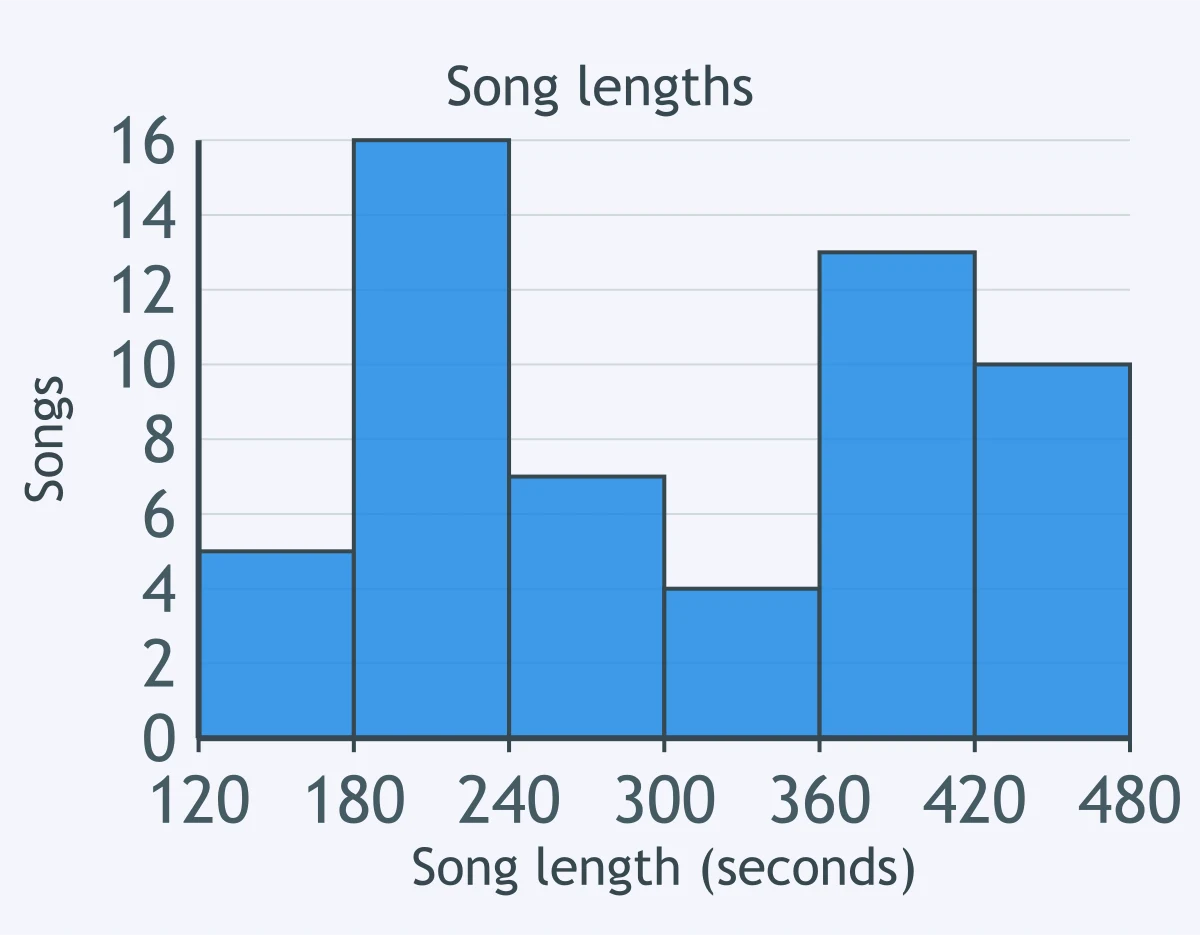
A histogram shows song lengths, in seconds, for 55 streamed songs, with one-minute classes from 120 to 480. What secondary feature appears?
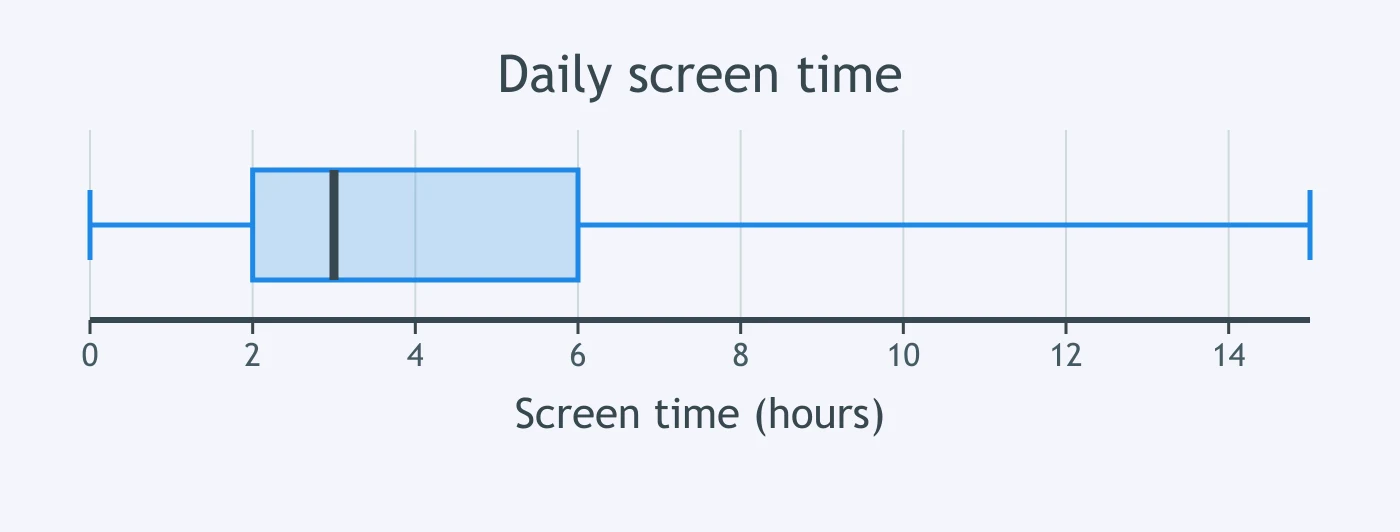
The box plot summarizes daily screen time, in hours, for 45 students, on an axis from 0 to 15 hours. What shape is indicated?
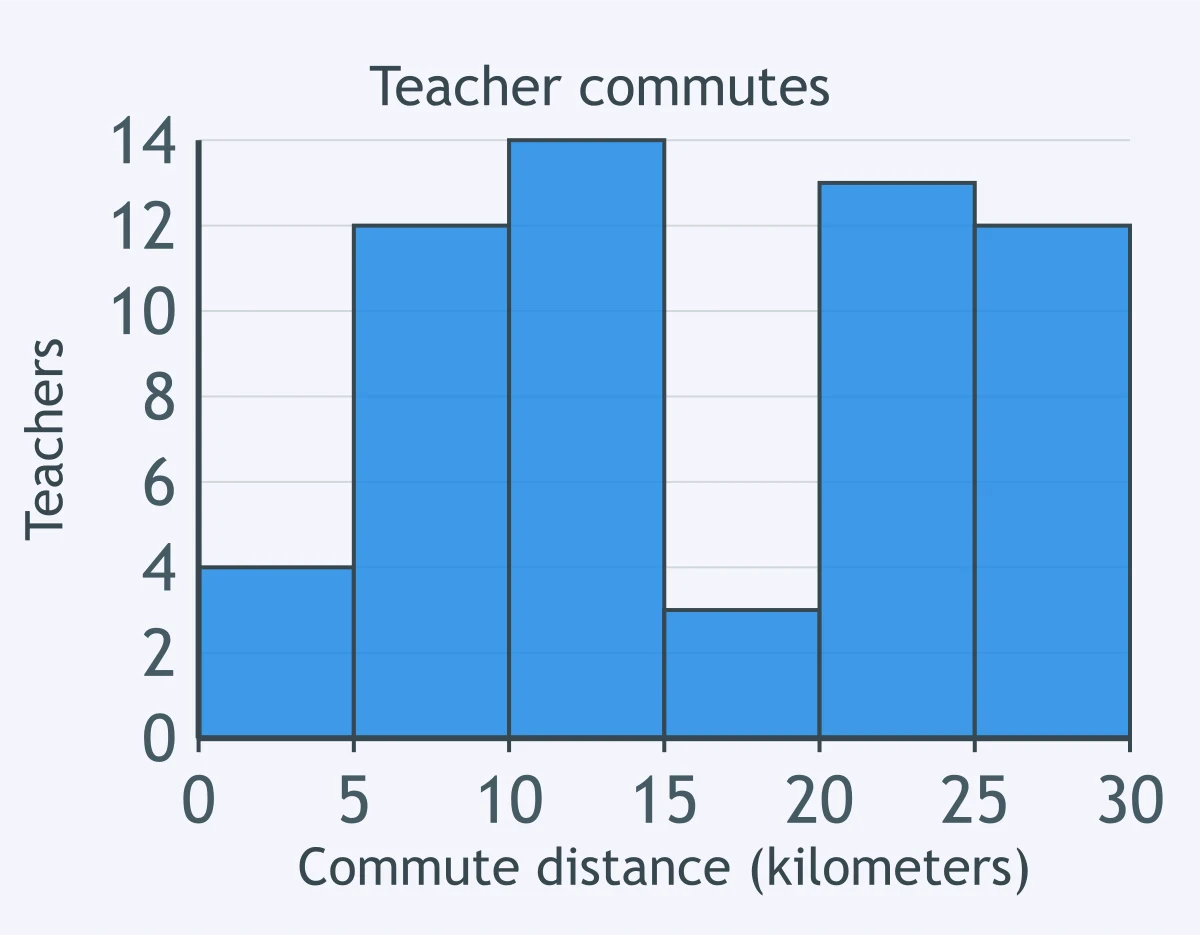
Use the histogram of commute distances, in kilometers, for 58 teachers, with class width 5 from 0 to 30. What shape is shown?
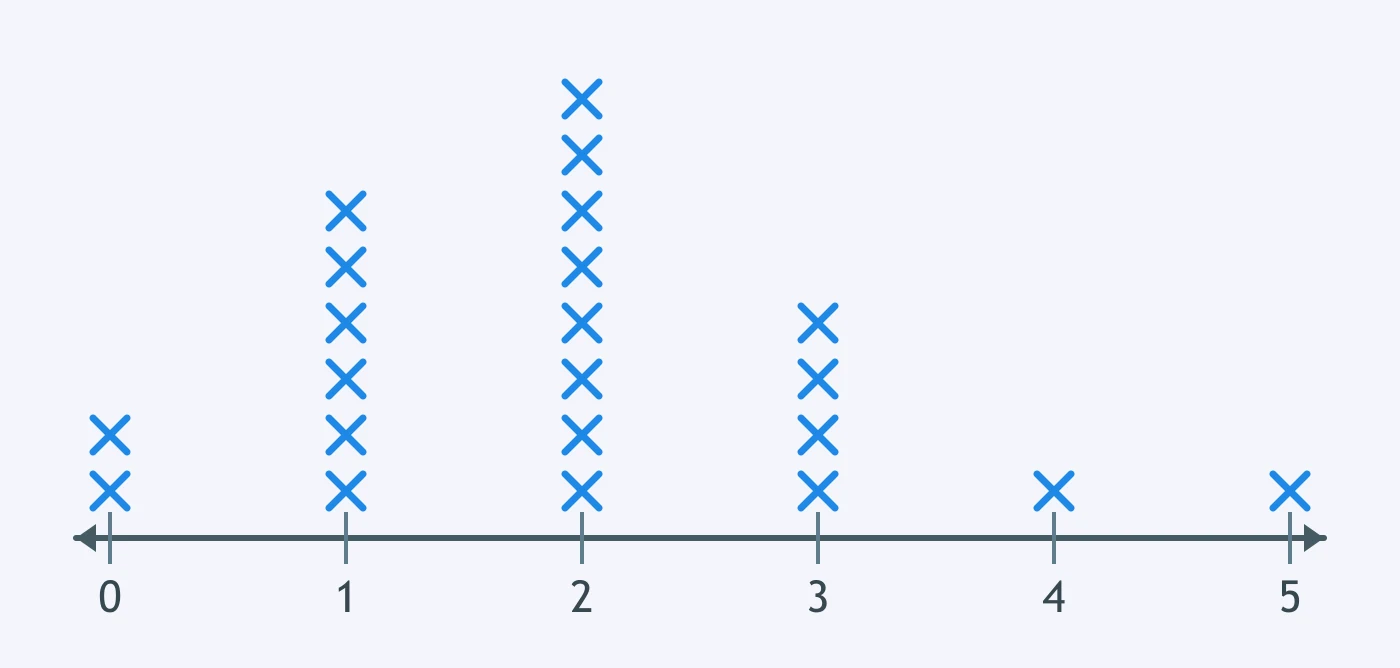
A dot plot shows monthly museum visits reported by 22 students. What shape best describes the distribution?
The histogram shows cactus heights, in centimeters, in a greenhouse, with 10-centimeter classes from 20 to 80. Where does the tail lie?
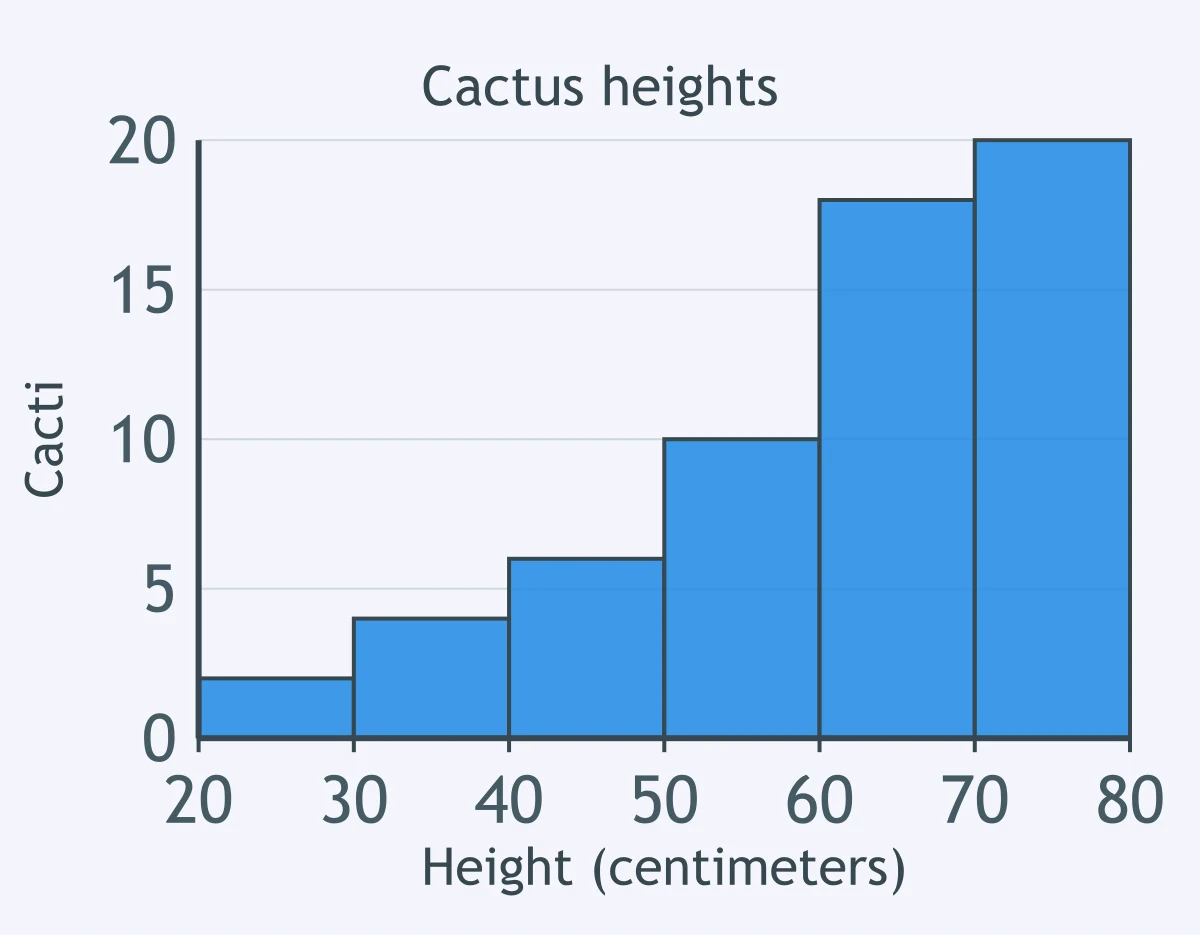
For 80 exam scores, the mean is 76 percent and the median is 84 percent. What shape is suggested by the mean being lower than the median?
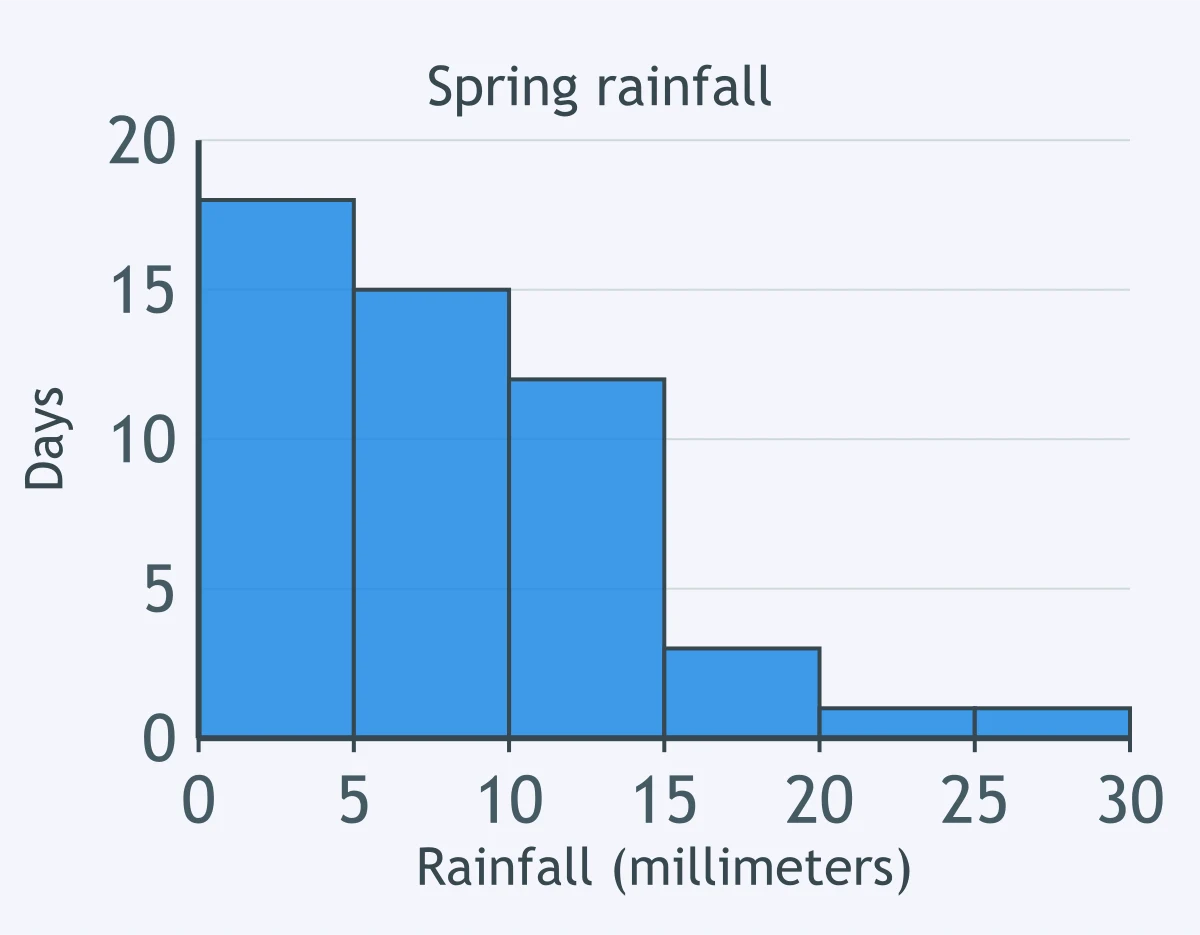
A histogram displays daily rainfall, in millimeters, for 50 spring days, with class width 5 from 0 to 30. What feature stands out?
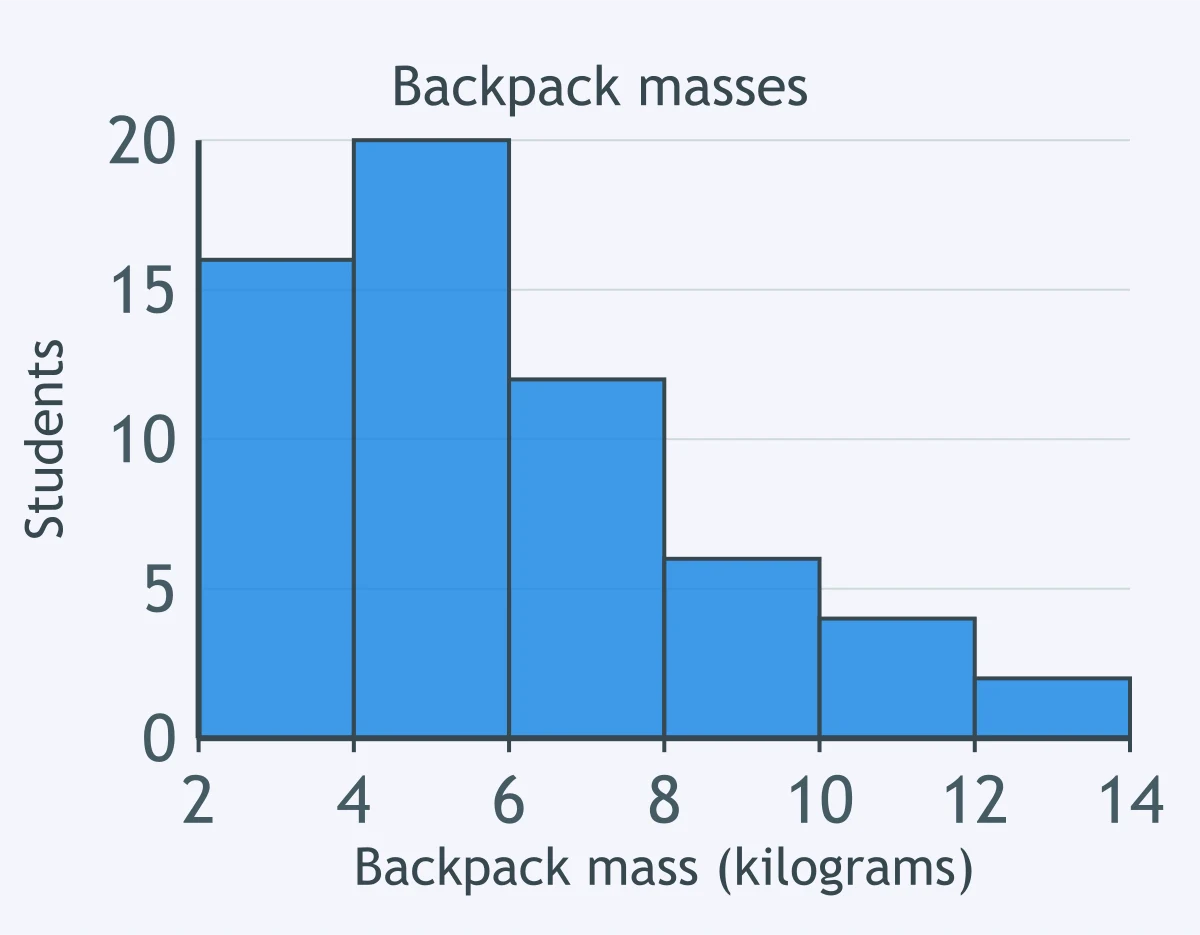
A histogram displays backpack masses, in kilograms, for 60 students, with class width 2 from 2 to 14. What overall shape appears?
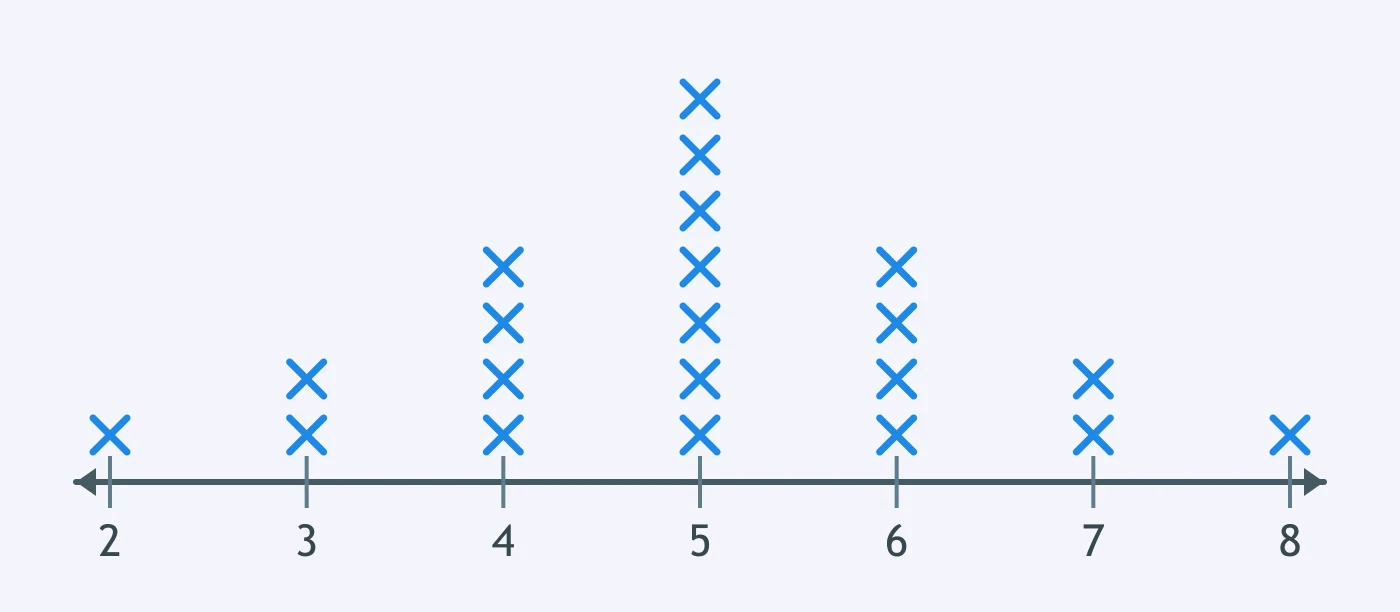
The dot plot shows free throws made out of 10 by 21 players. What shape does the dot plot suggest?
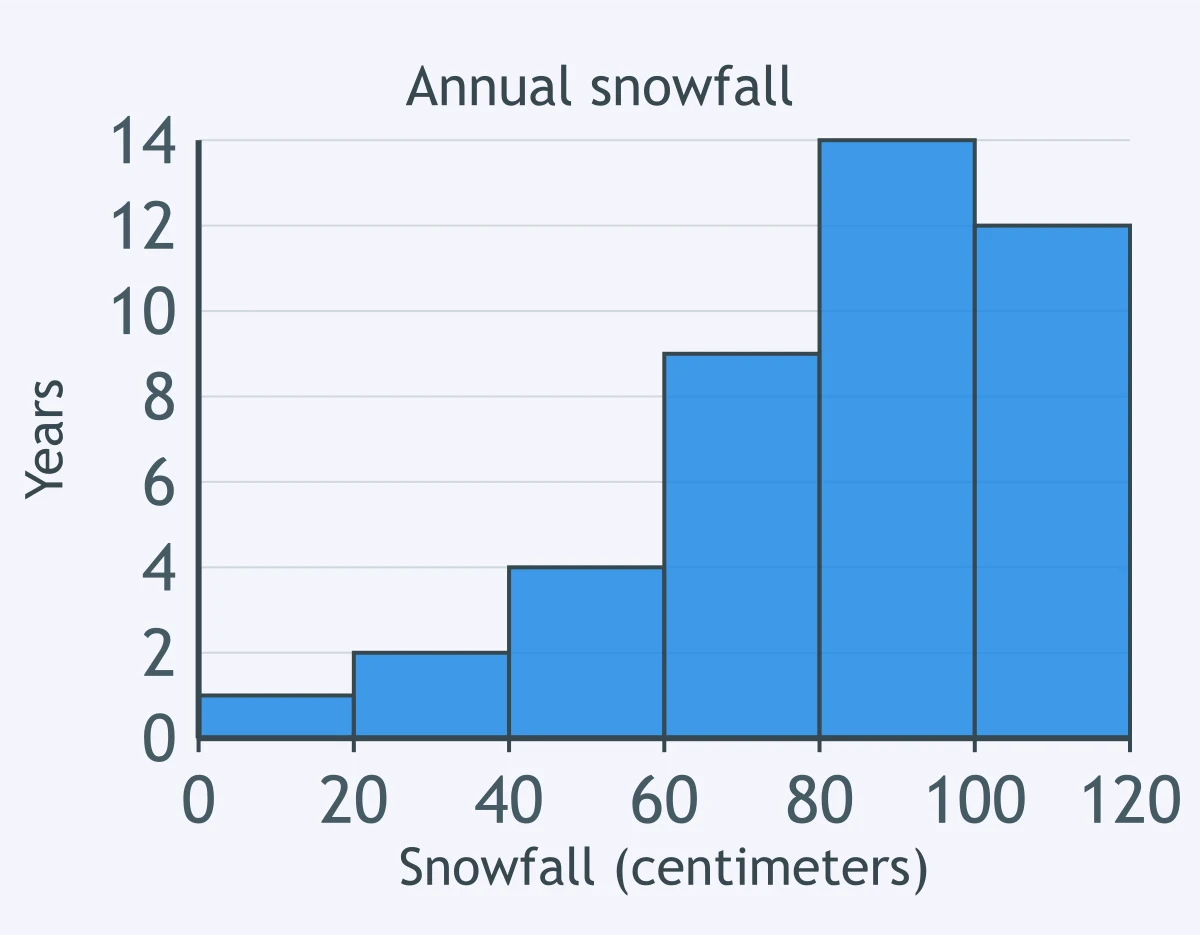
For annual snowfall totals, in centimeters, the histogram uses 20-centimeter classes from 0 to 120. On which side does the tail lie?
For 75 commute distances, in kilometers, the mean is 12.8 and the median is 12.9. What shape do these summaries suggest?
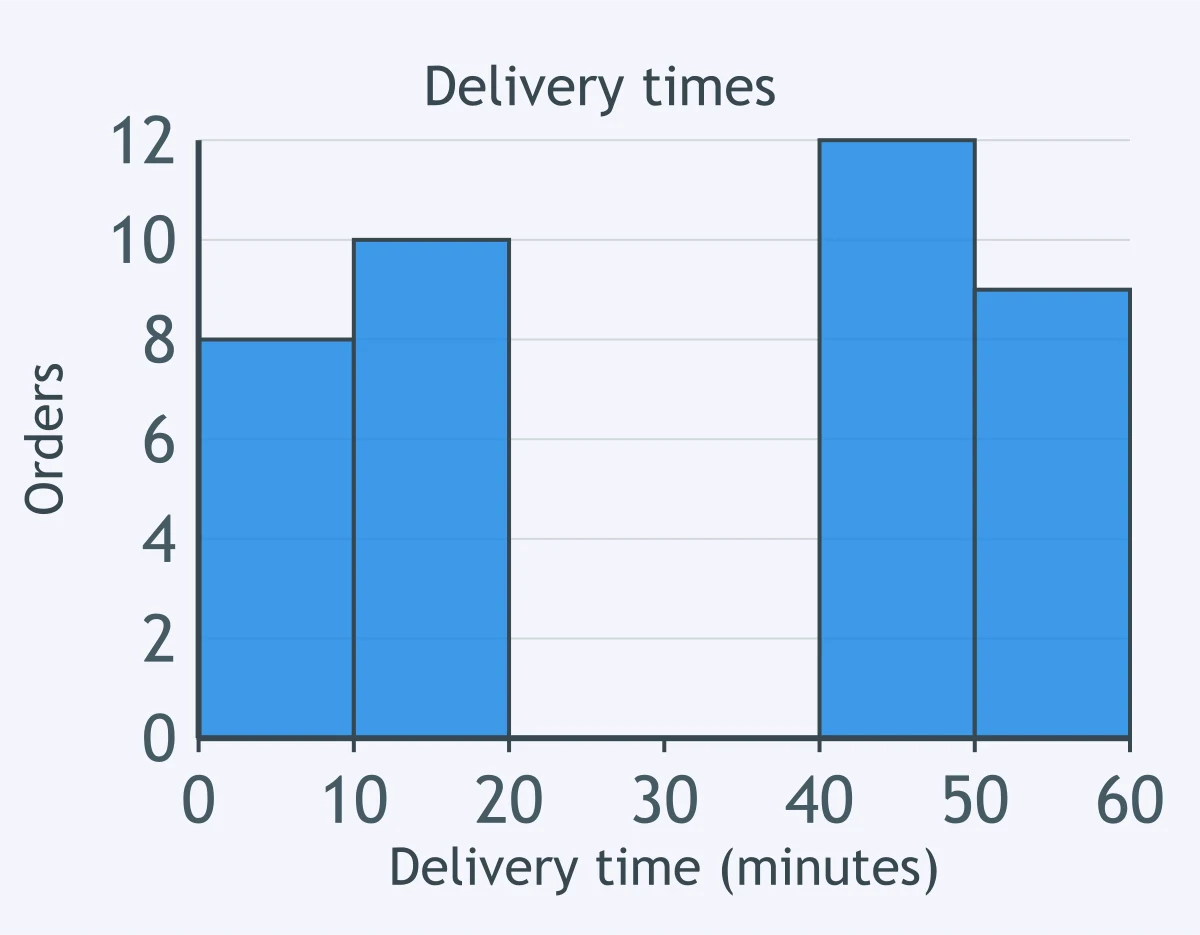
A histogram shows delivery times, in minutes, for 39 orders, with class width 10 from 0 to 60. What feature is present?
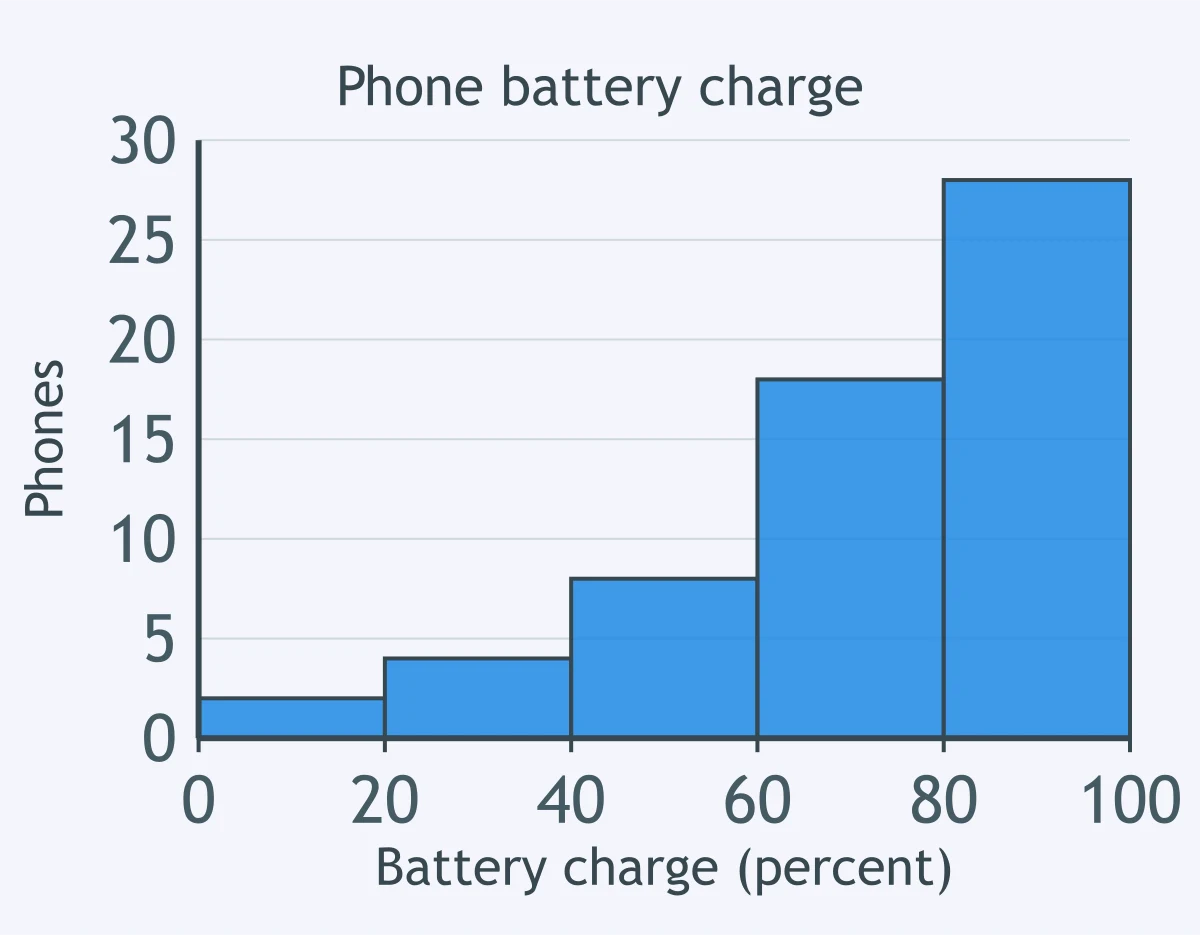
The histogram summarizes phone battery charge, in percent, for 60 phones, using 20-point classes from 0 to 100. What shape is shown?
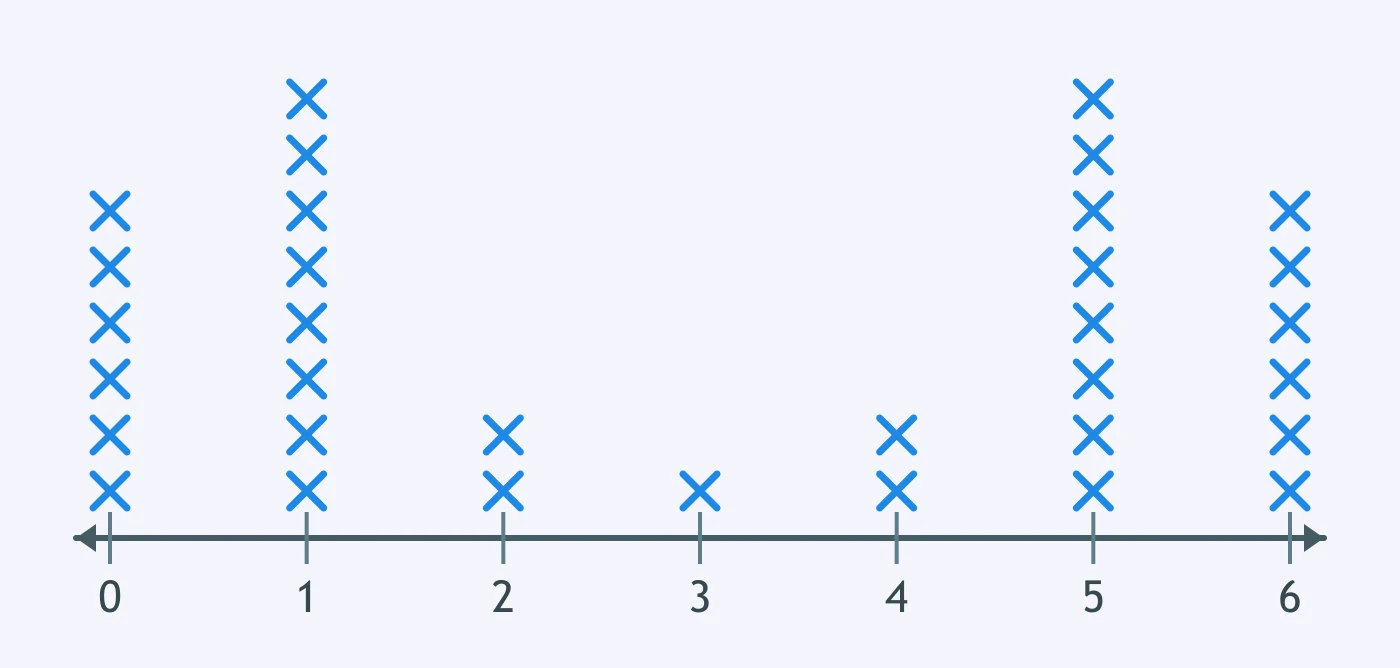
A dot plot records the number of pets in 33 households surveyed by a class. What shape describes the distribution?
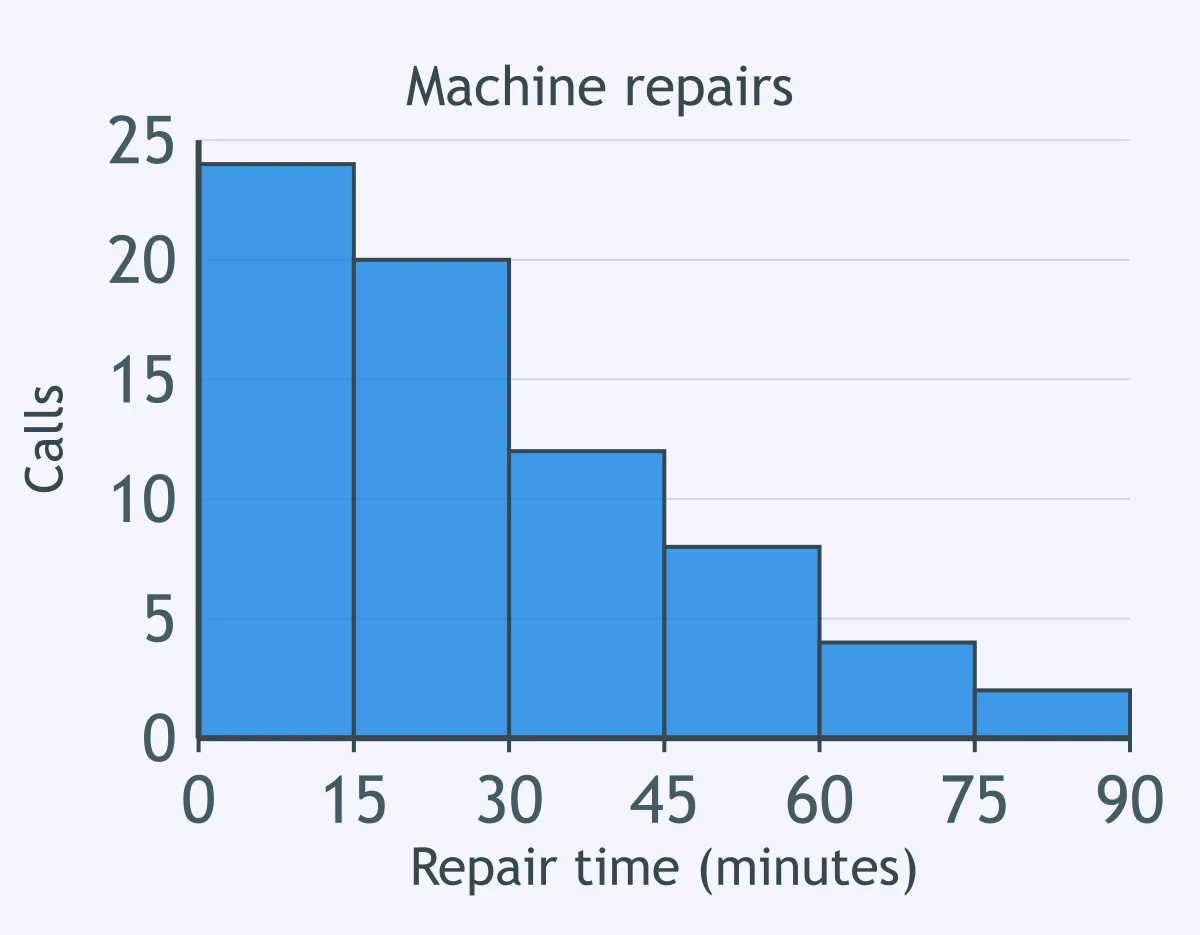
The histogram shows machine repair times, in minutes, for 70 service calls, with width-15 classes from 0 to 90. On which side is the tail?
For 100 monthly mobile data usages, in gigabytes, the mean is 9.6 and the median is 6.4. What shape is suggested by these summaries?
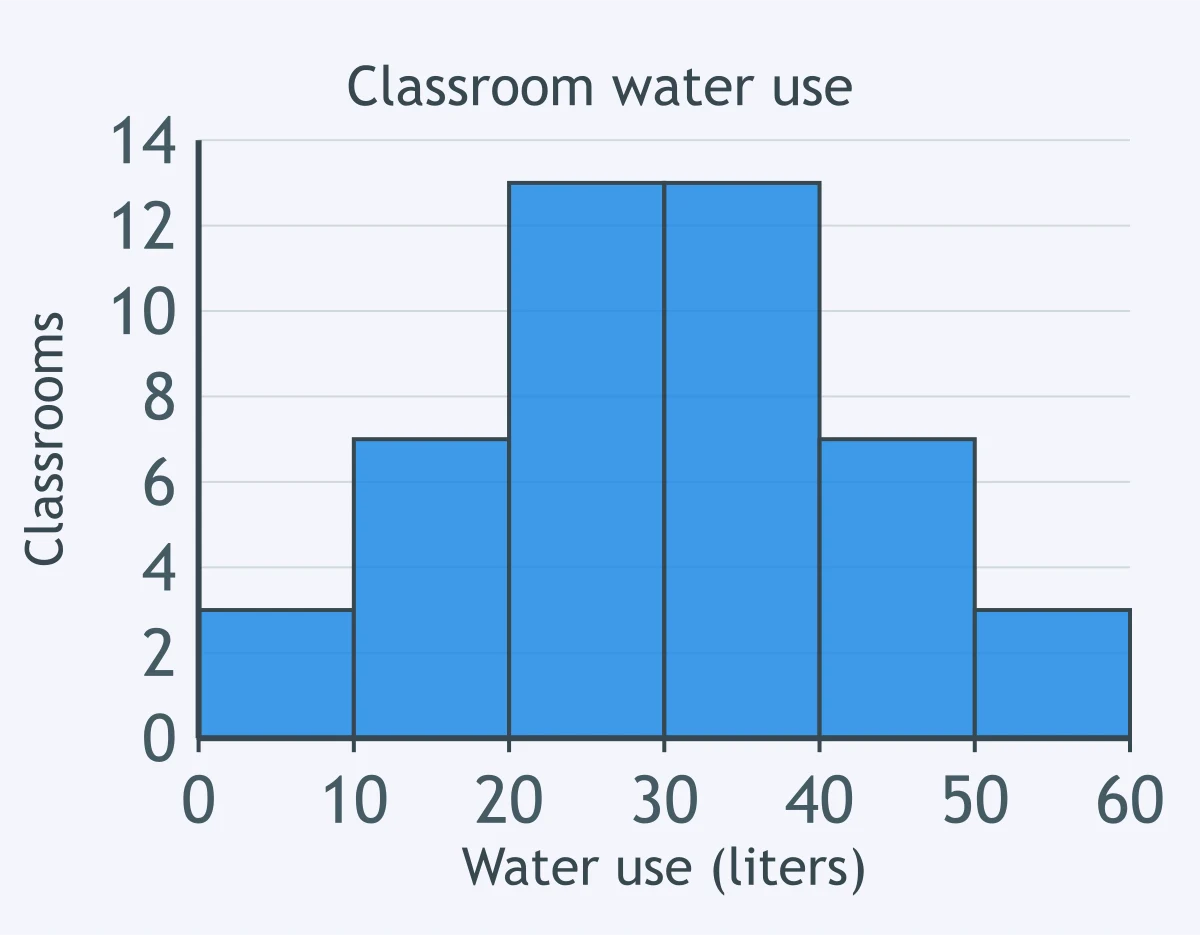
A histogram shows water use, in liters, by 46 classrooms in one day, with 10-liter classes from 0 to 60. What shape does it show?
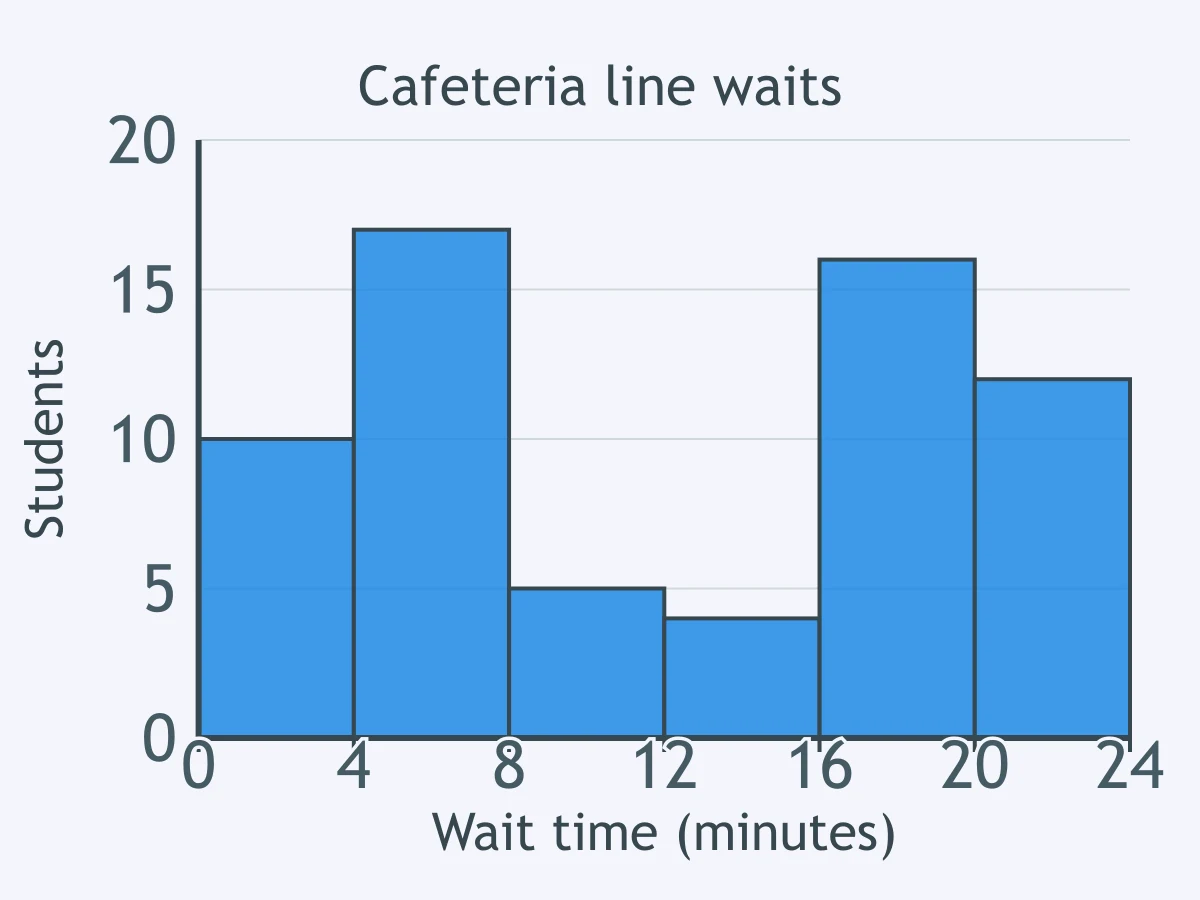
A histogram displays cafeteria line waits, in minutes, for 64 students, with class width 4 from 0 to 24. What shape is shown?
Crack the passcode before the zombies get in.
Answer, then swat bugs for bonus points.
Race through questions at your own speed.
Same question on every screen. Fastest wins.

Pick a tile, answer, hit bonuses and steals.
Misleading Graphs
20 questions