Loading
by BlastRoom
Finding the feature that exaggerates a difference: a truncated axis, unequal intervals, area scaling or a missing label.
#probability_and_statistics
20 questions
One question set, multiple game modes. Tap any game to see it in action. Not sure which to pick?
Answer to place stones and capture territory.
Outrun the snow together.
Earn blasts, then hunt the other team.
Answer to earn energy, then climb.

The class blasts through walls together.
Bid on mystery lots. Most money wins.
Sell tours. Nice, standard, or a total scam.

Answer, restock, and serve the rush.
More correct answers pulls the rope your way.
Answer, then shoot down the alien wave.
Answer, then tap to leap the frozen ridge.
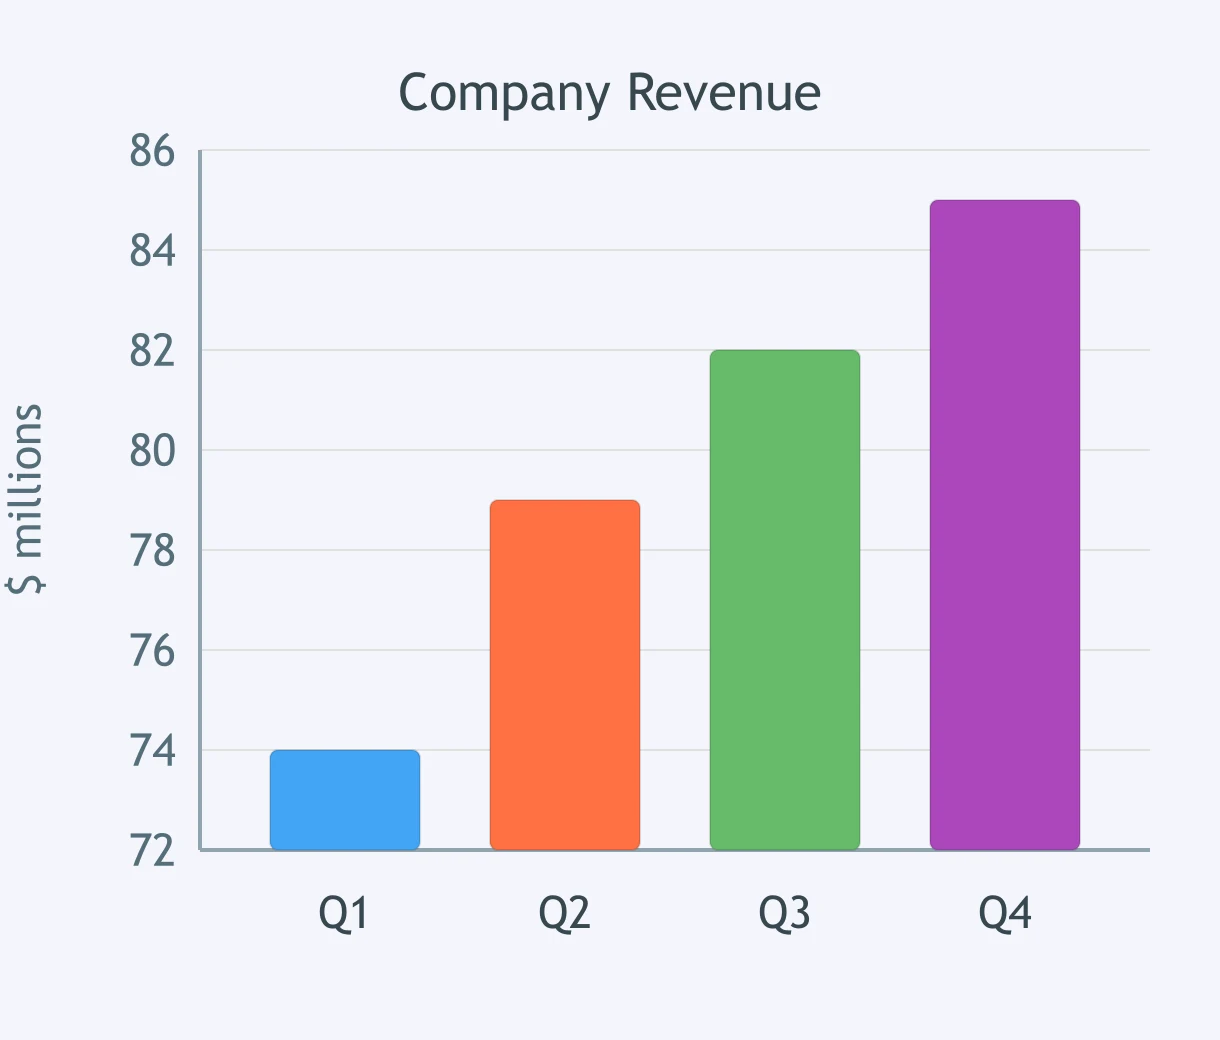
A bar graph for a company shows quarterly revenue in millions of dollars. The display makes the quarters look dramatically different. What feature of the figure is misleading?
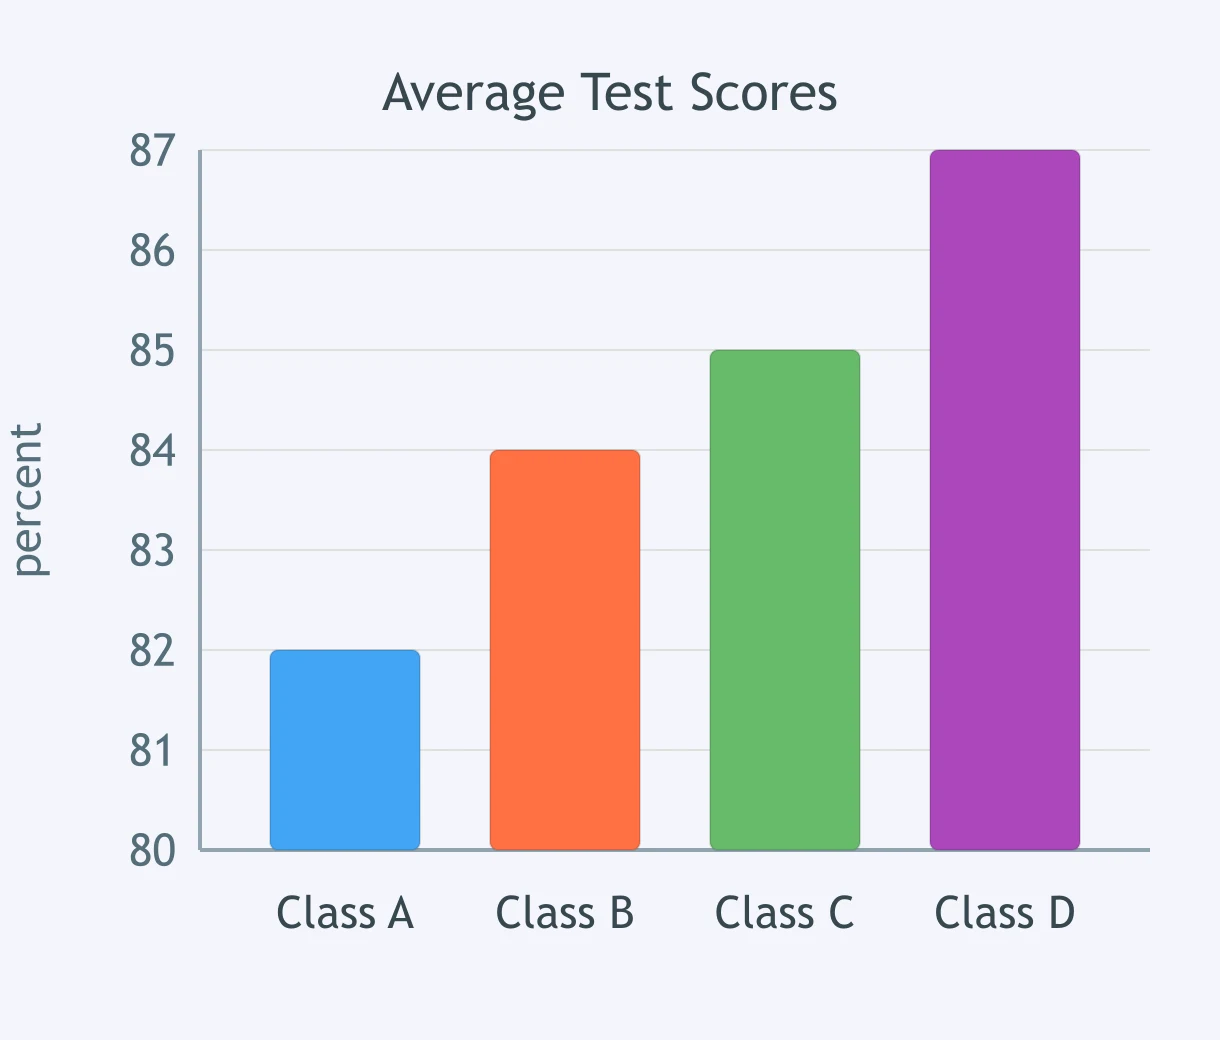
A bar graph for four Algebra classes shows average test scores in percent. Class D looks far ahead of the others. What feature exaggerates the difference?
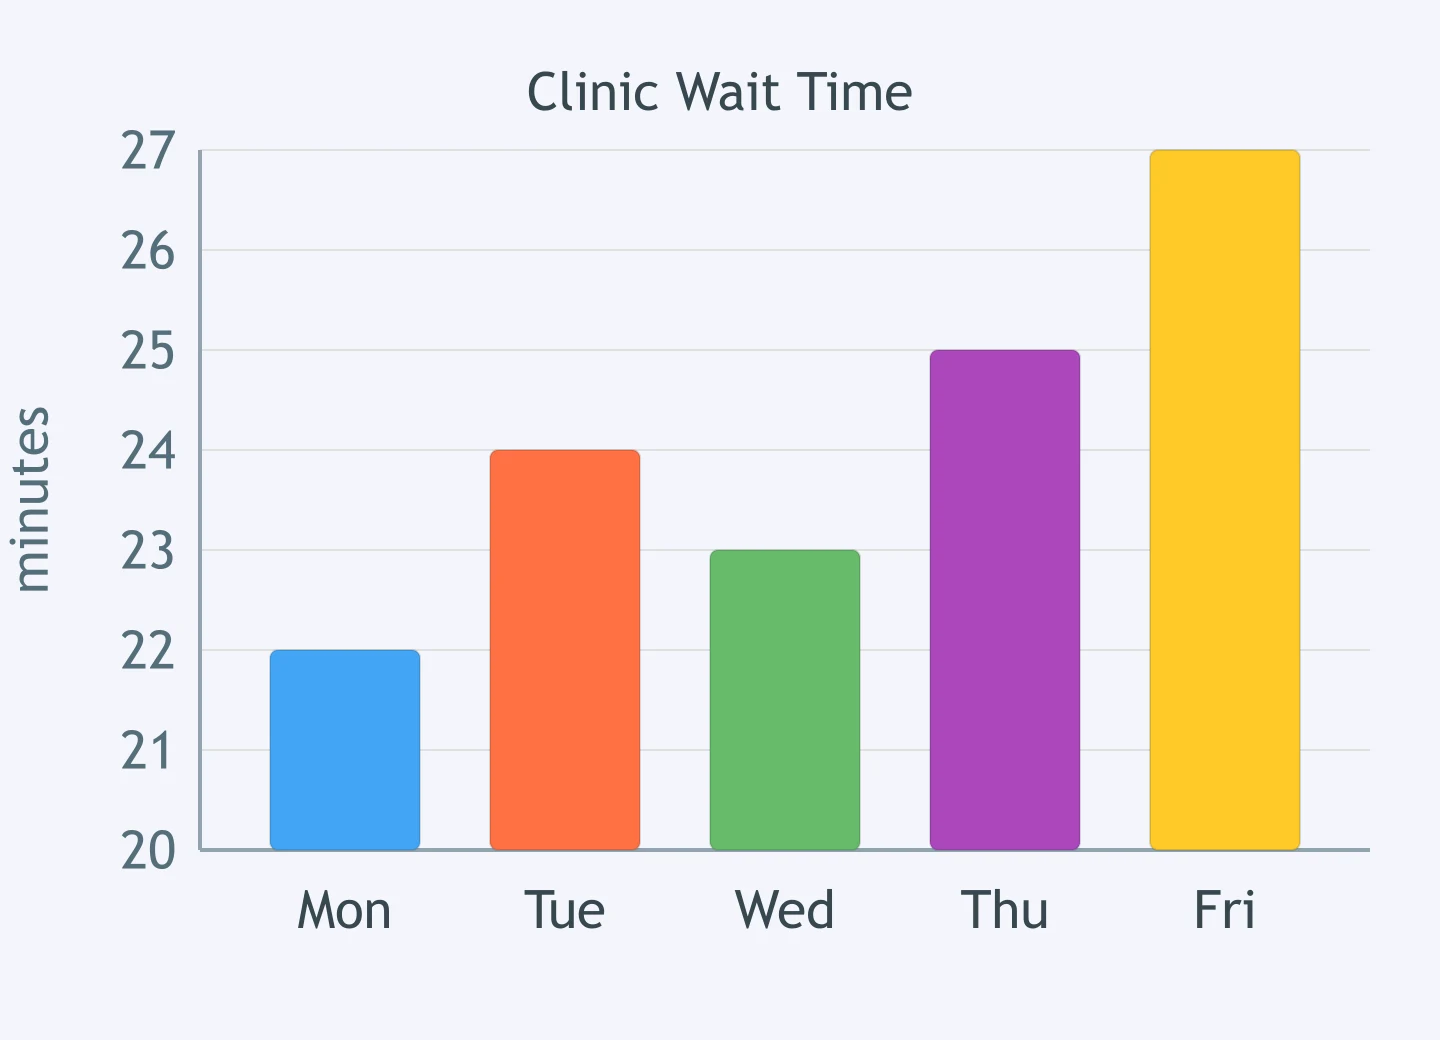
A clinic's bar graph shows average patient wait time in minutes by weekday. Friday appears much longer than the other days. What makes the graph misleading?
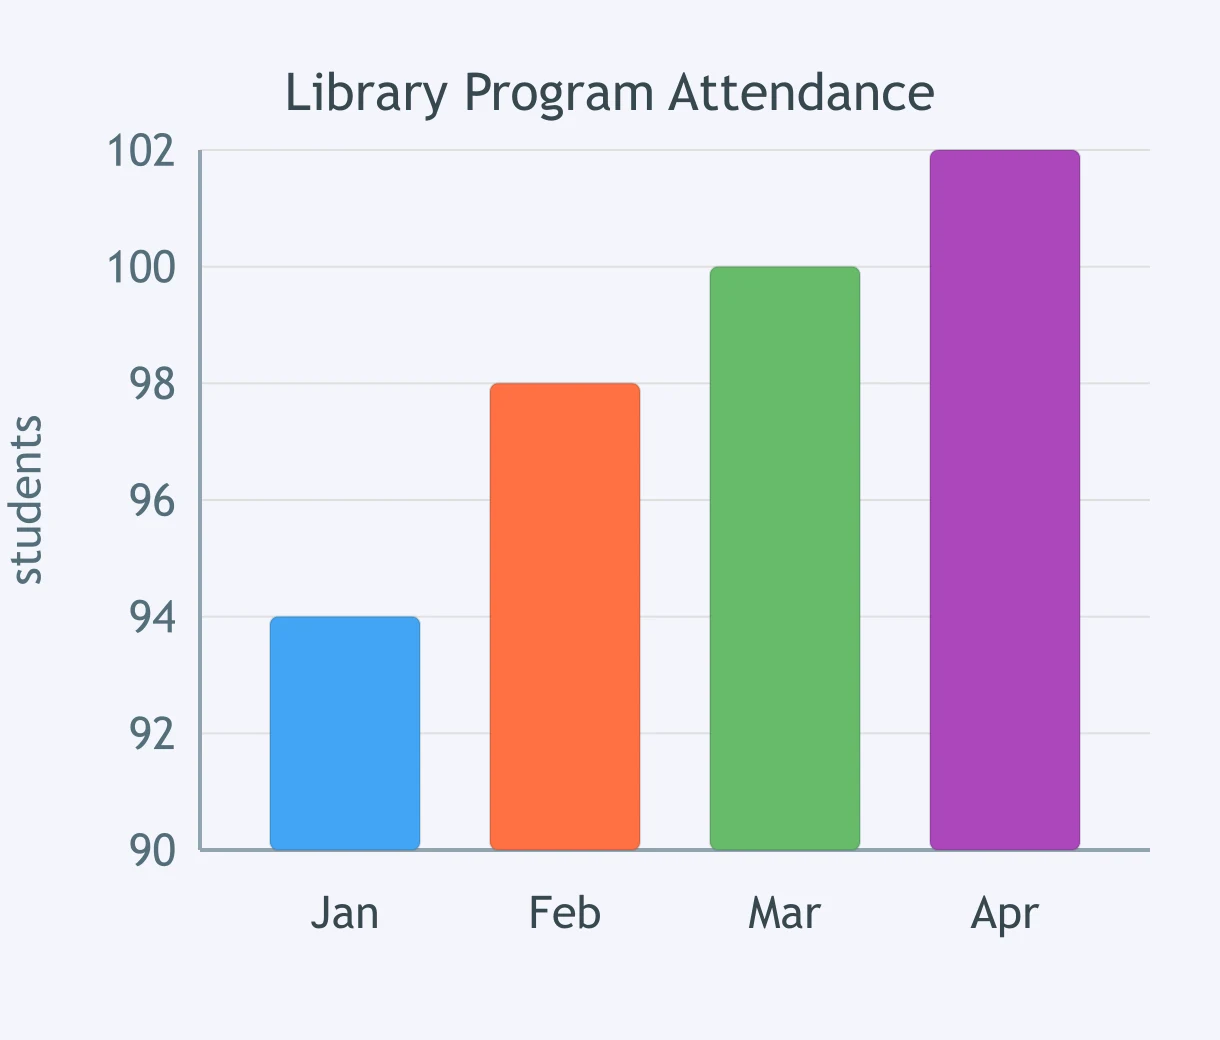
A bar graph for a library shows program attendance in students by month. The increase from January to April looks dramatic. Which feature causes that impression?
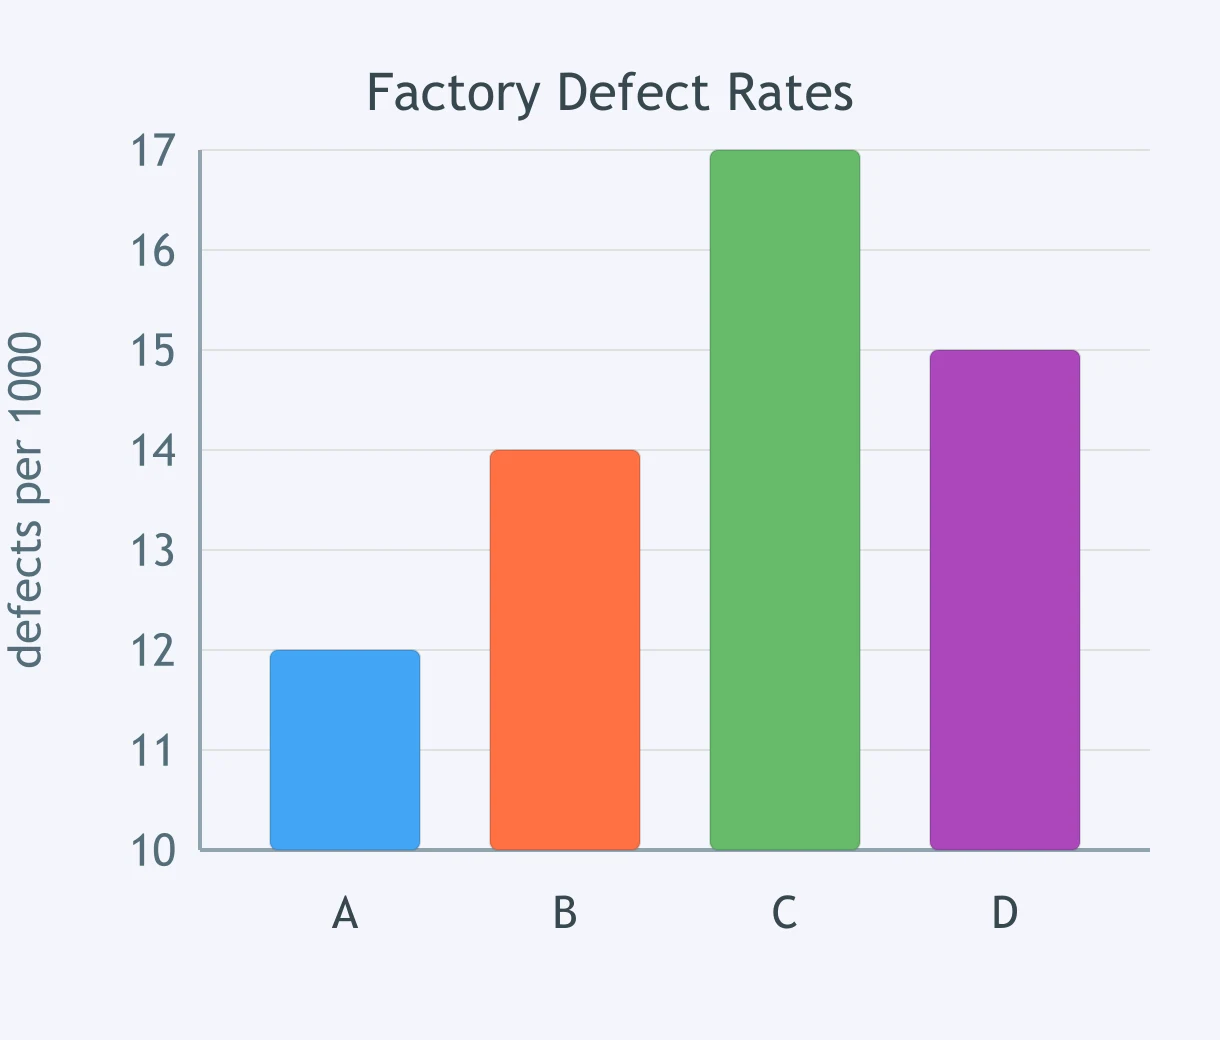
A factory bar graph shows defect rates per 1000 items for four machines. Machine C seems far worse than the others. What feature makes the comparison misleading?
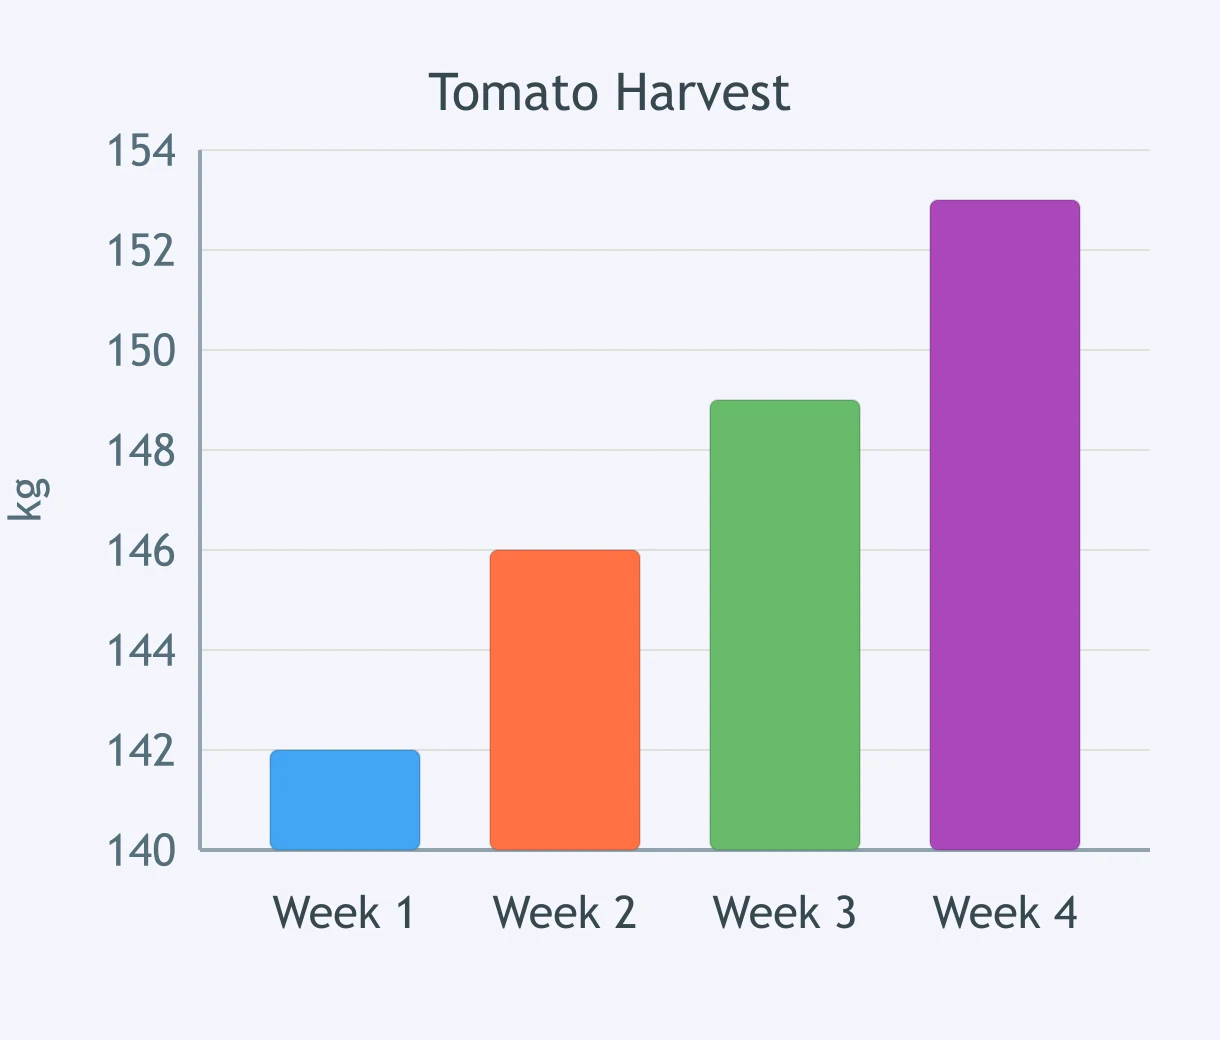
A farm bar graph shows tomato harvest in kilograms by week. Week 4 looks much taller than Week 1. What display feature exaggerates the change?
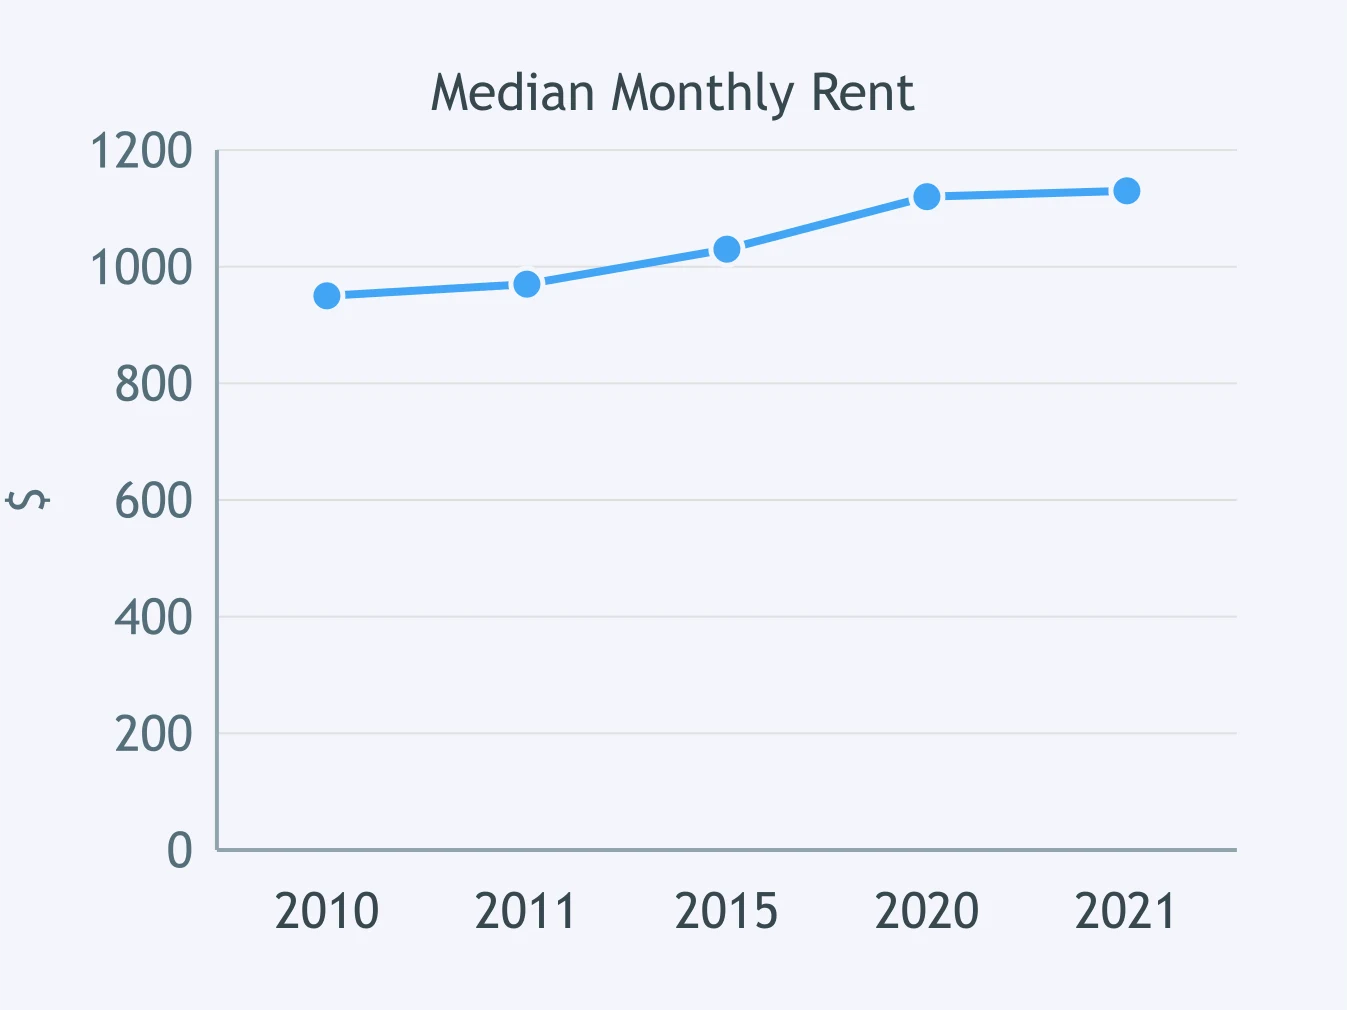
A line graph for one city's median monthly rent in dollars makes changes over the years look evenly timed. What feature is misleading?
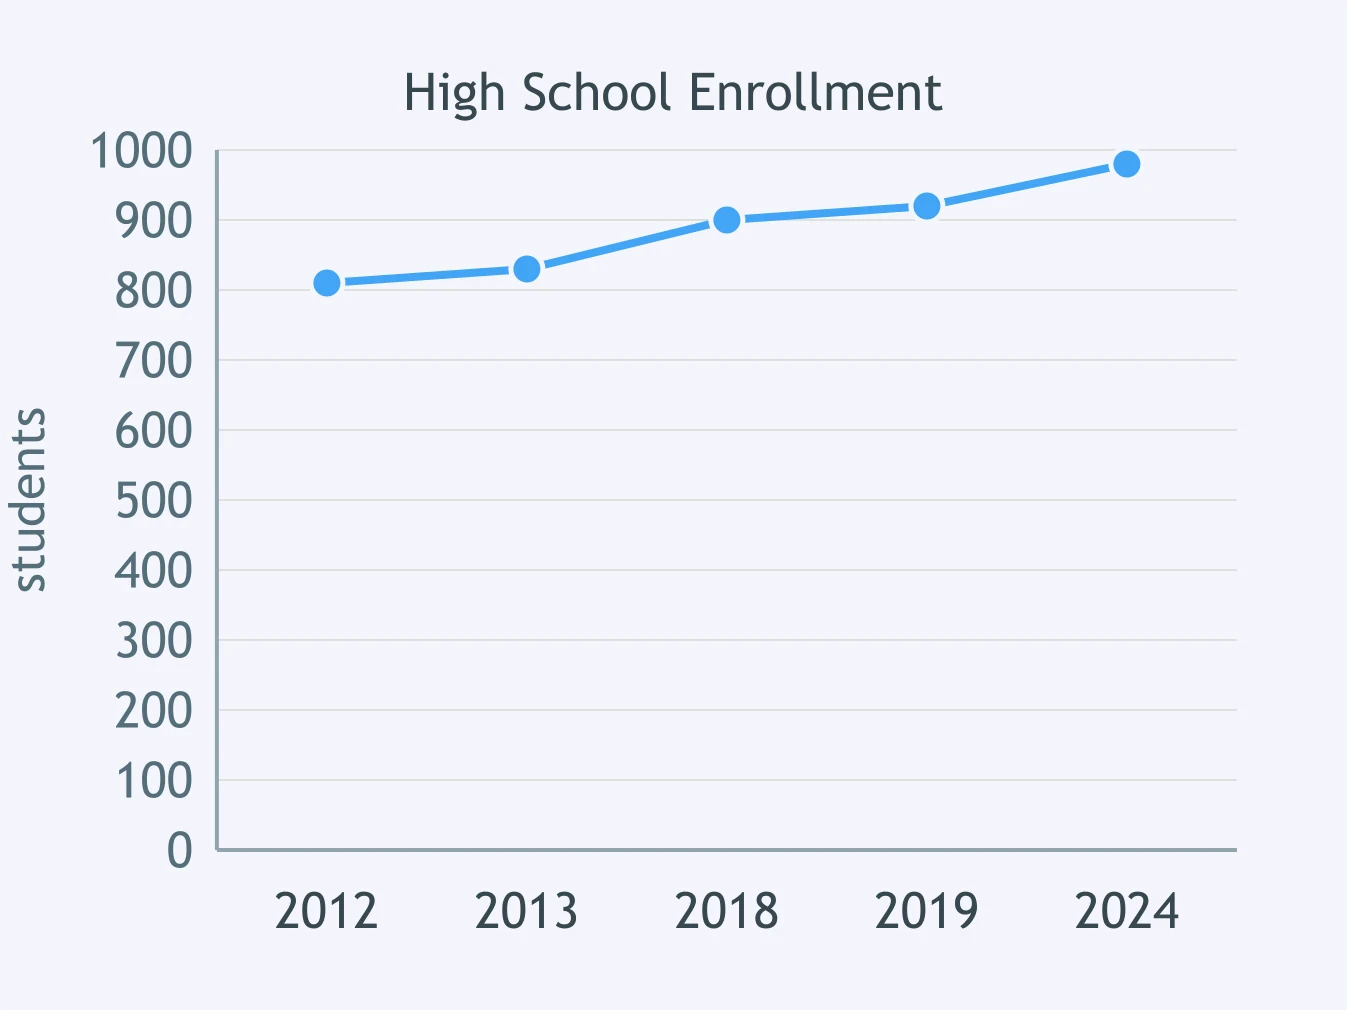
A line graph for a high school shows enrollment in students across several years. The growth appears to occur at a steady pace. What feature of the graph is misleading?
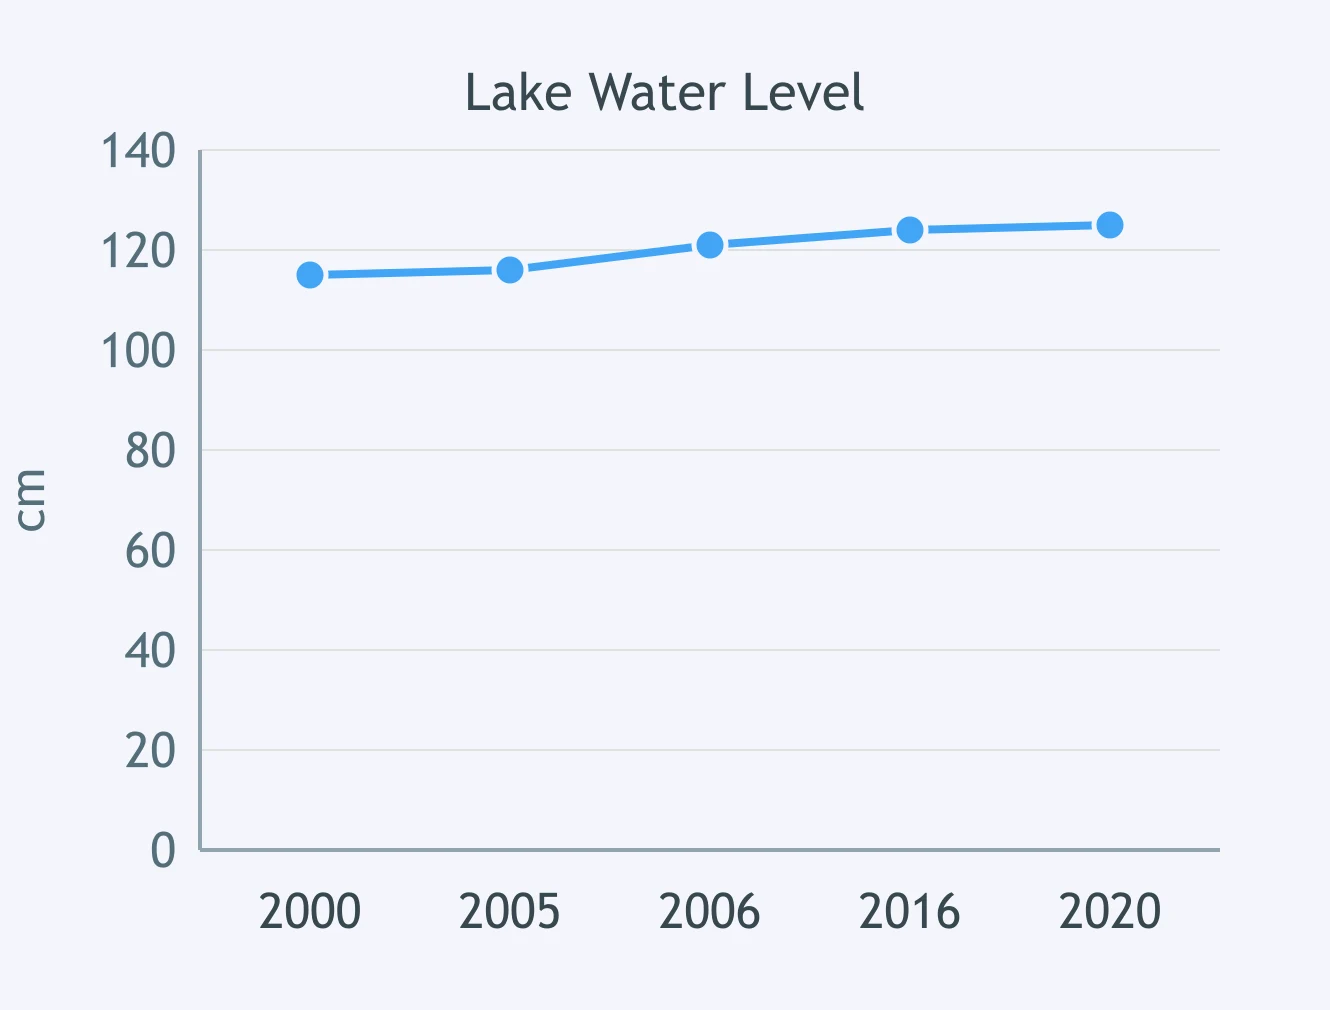
A line graph shows a lake's water level in centimeters over selected years. The timing of rises looks uniform. What feature makes that impression misleading?
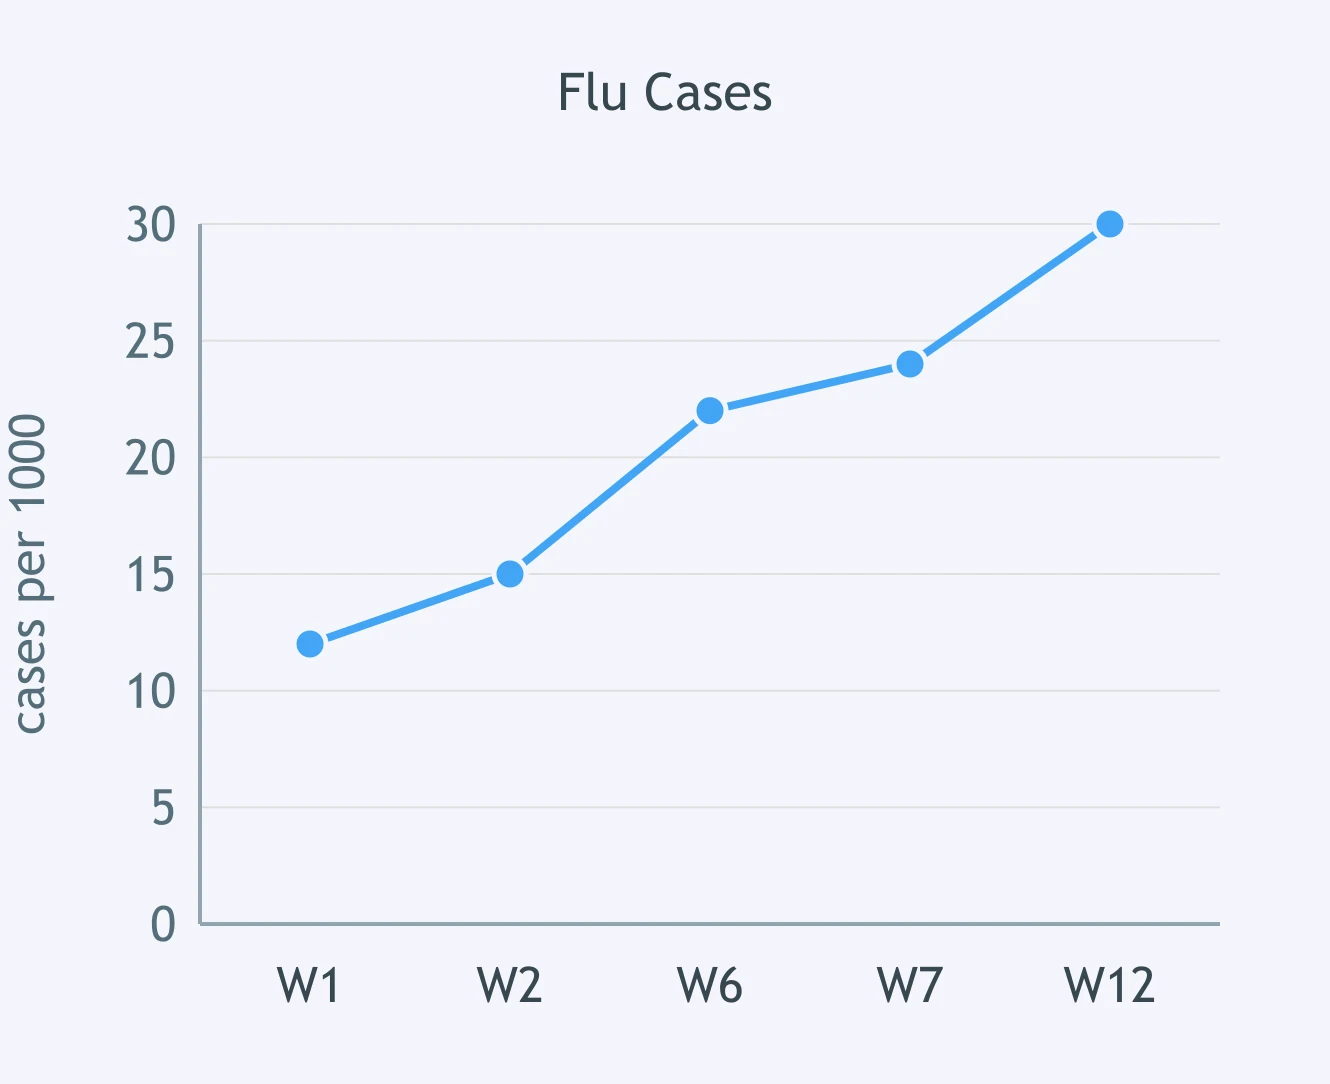
A clinic line graph shows flu cases per 1000 visits by week number. The increases look evenly spaced through the season. What feature is misleading?
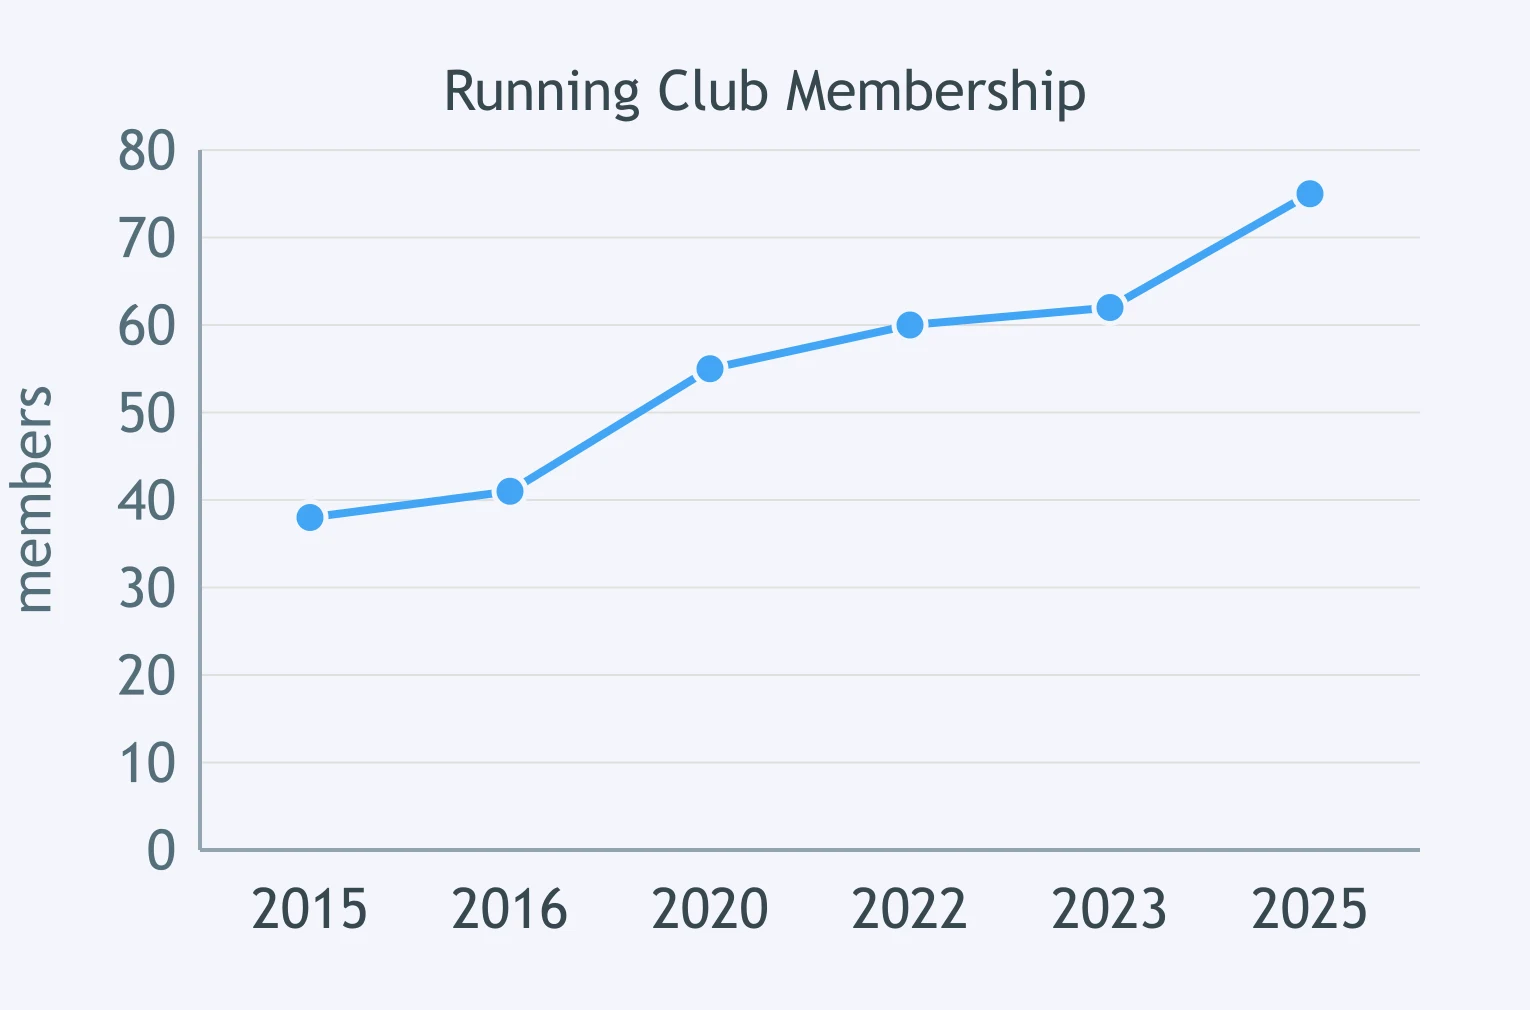
A running club's line graph shows membership in members over selected years. The line makes growth look smooth from year to year. What feature should be questioned?
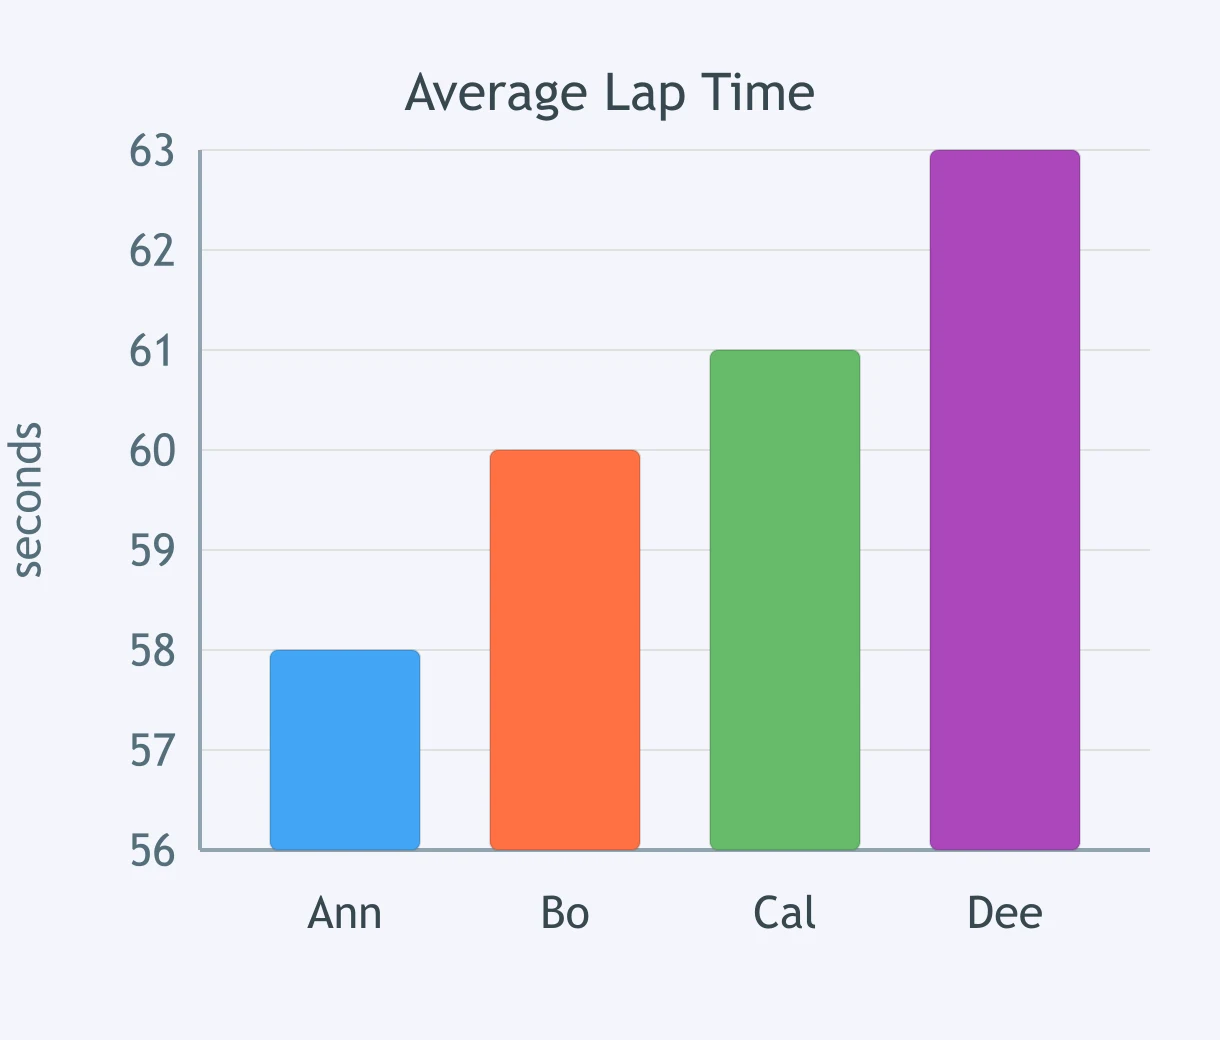
A bar graph for a swim team shows average lap times in seconds for four swimmers. Dee looks far slower than the rest. What feature of the display exaggerates the difference?
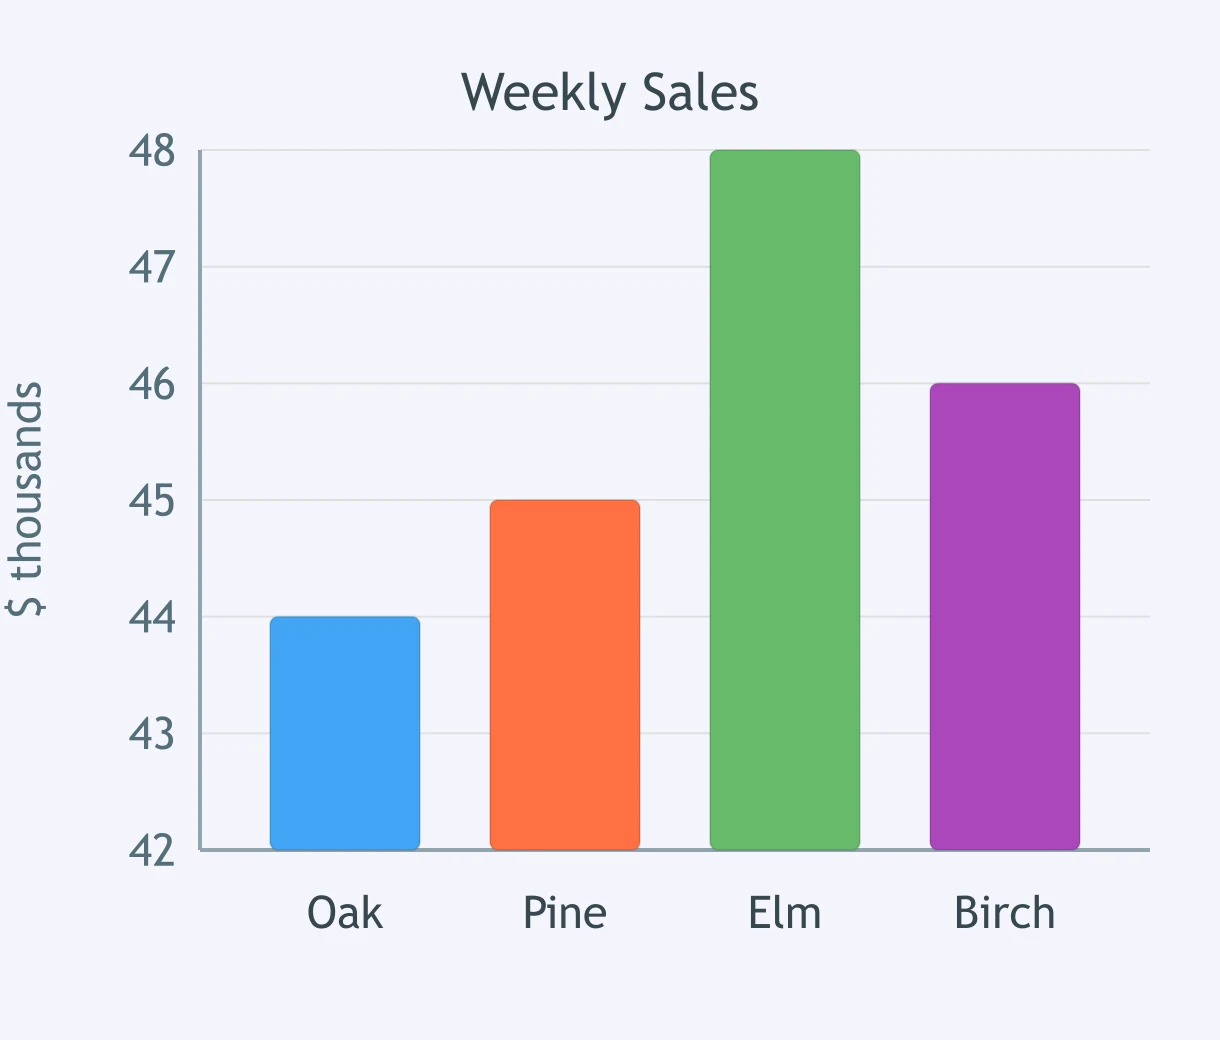
A bar graph for a bookstore shows weekly sales in thousands of dollars at four branches. Elm looks far ahead of the others. What feature makes the comparison misleading?
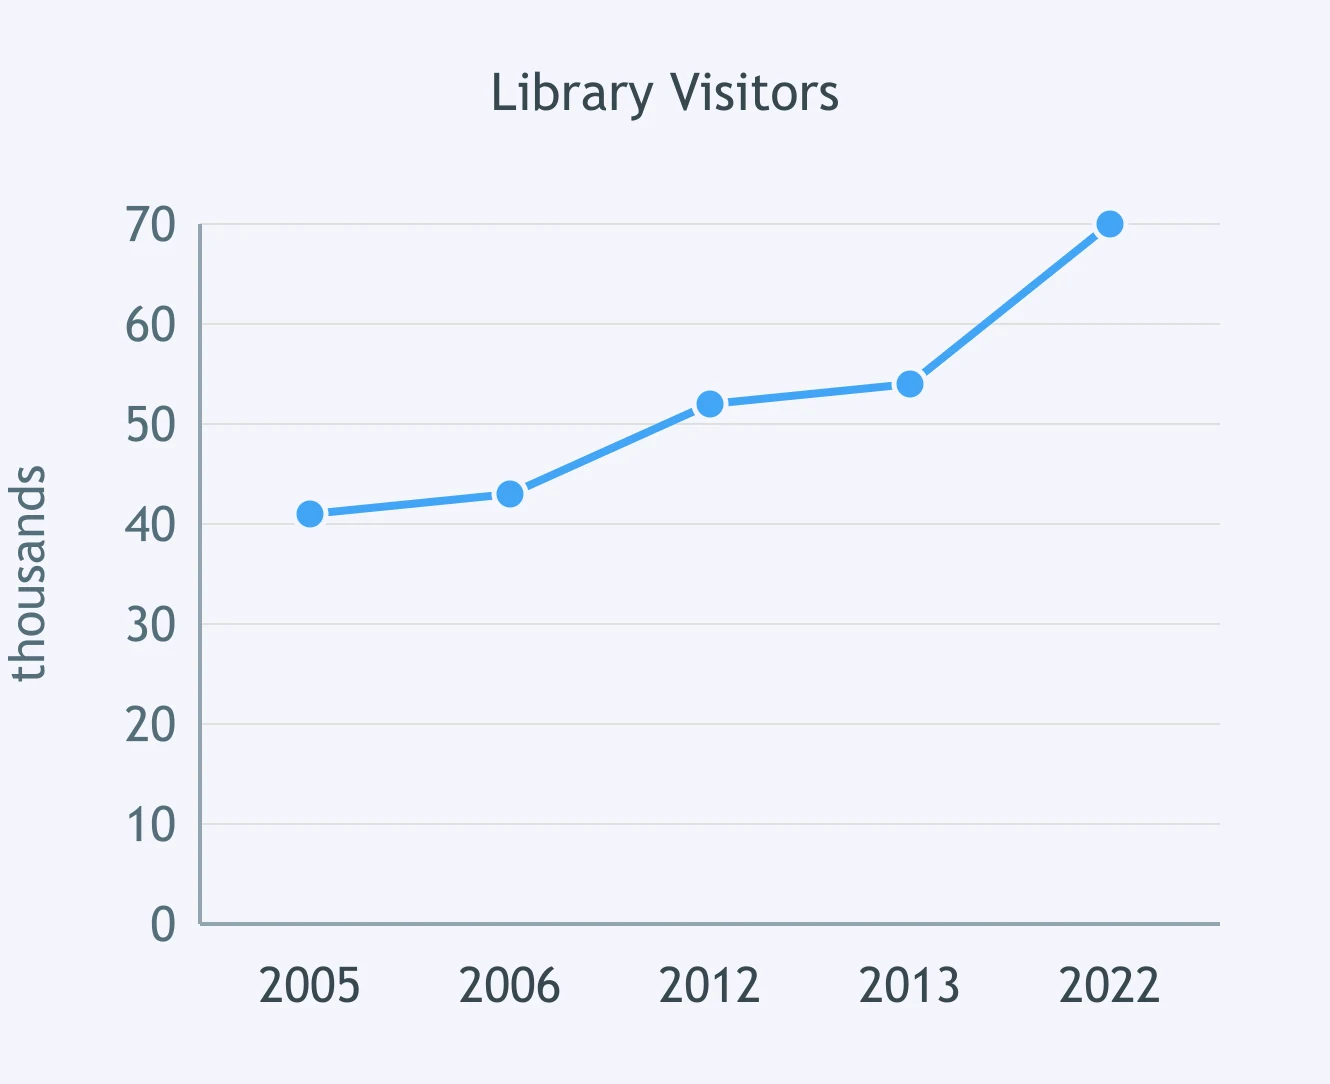
A line graph for a city library shows visitors in thousands across selected years. The rise looks steadily paced from one point to the next. What feature of the graph is misleading?
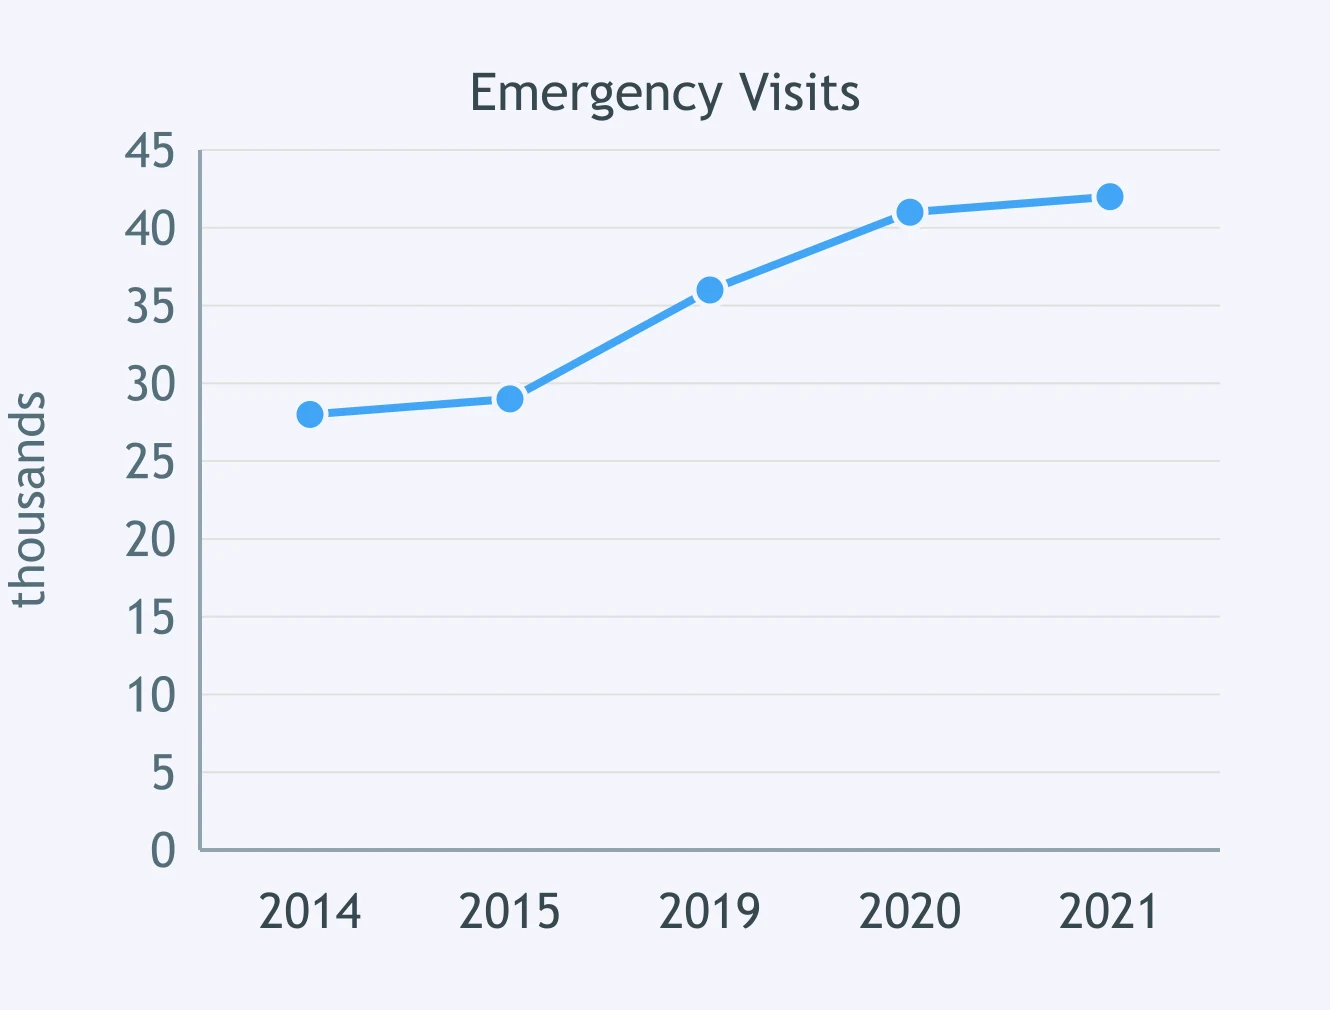
A line graph for a regional hospital shows emergency visits in thousands for selected years. The increases look evenly paced across the axis. What feature should a reader question?
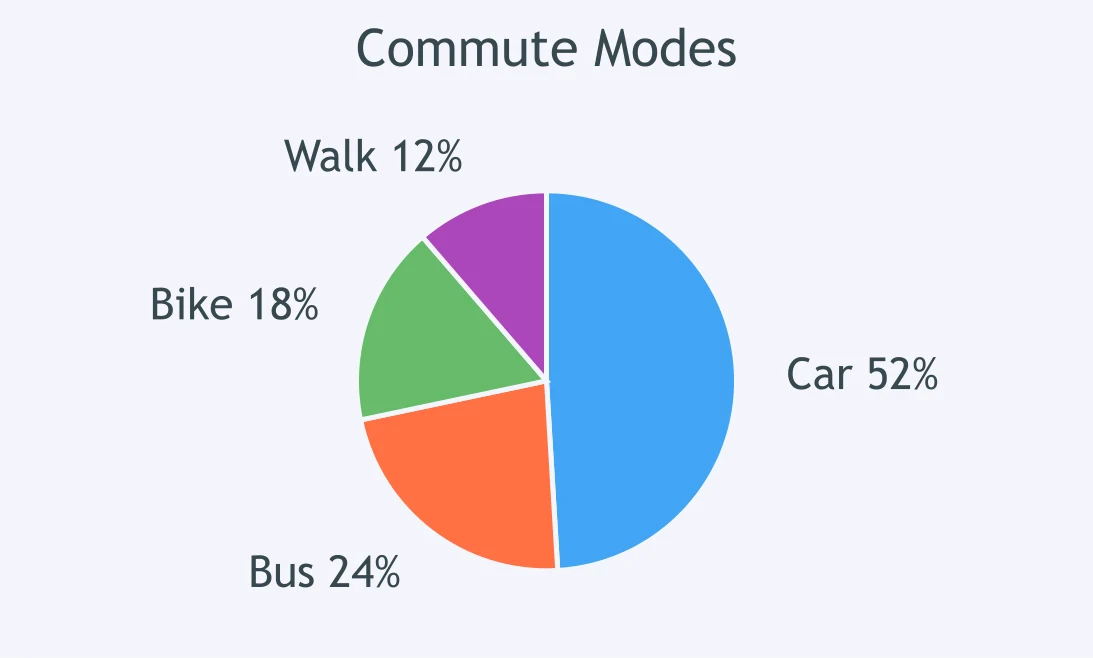
A pie chart for a town survey shows the percent of residents choosing each commute mode. The wedges look like they cover everyone. What feature makes the chart misleading?
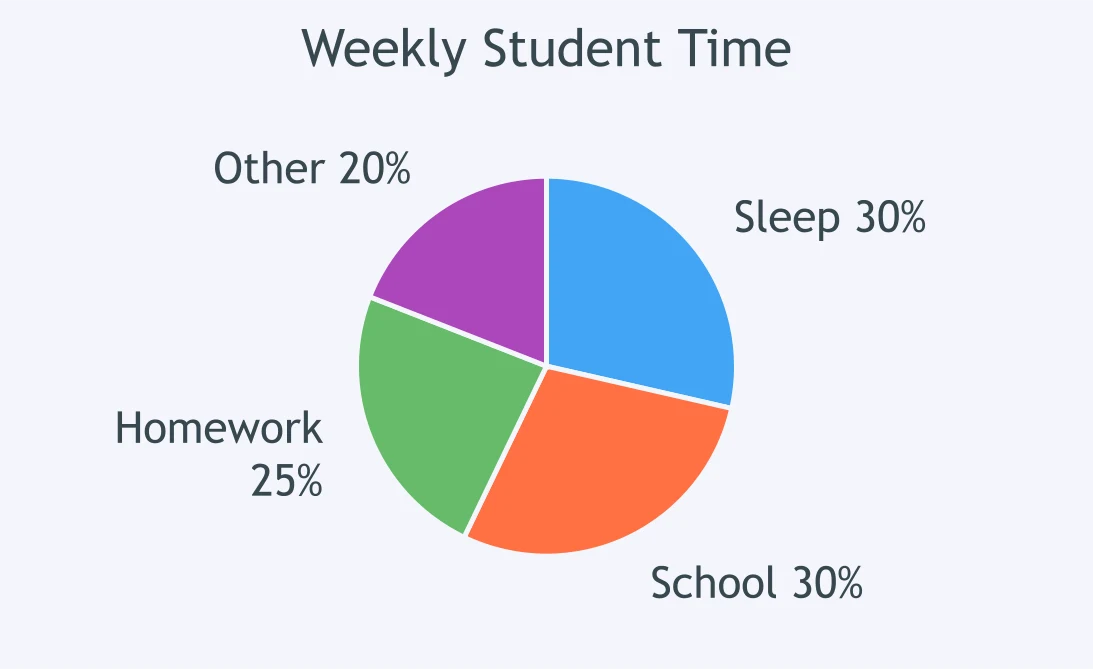
A pie chart for students' weekly time shows percent of total time in activities. The slices look like a complete whole. What feature makes the chart misleading?
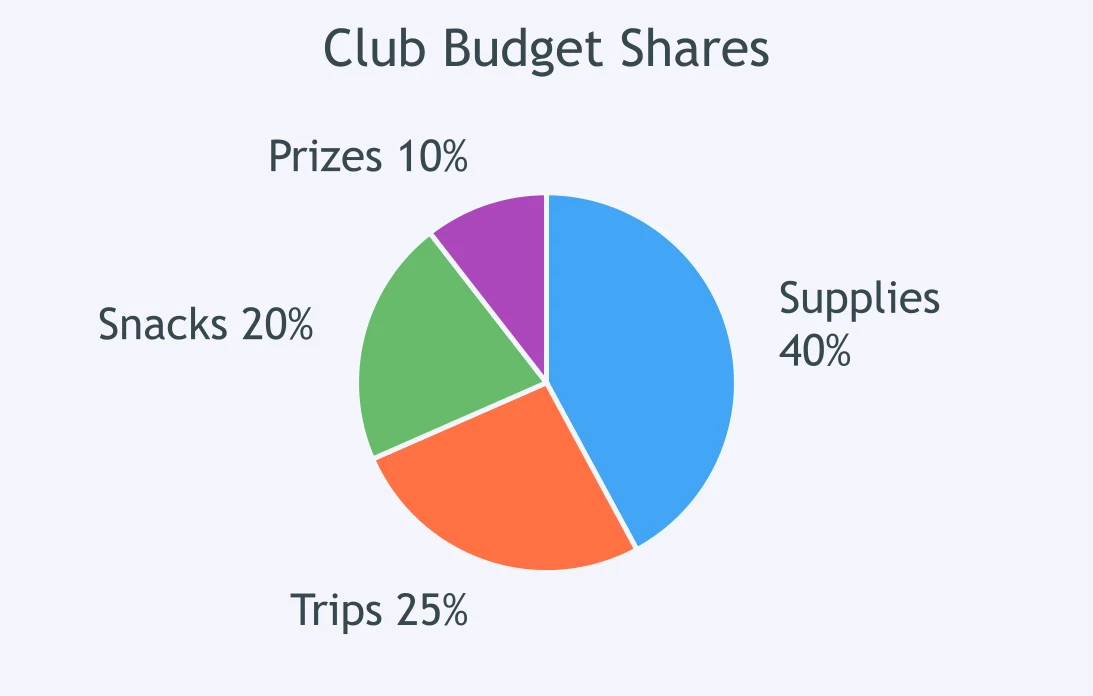
A pie chart for a school club budget shows percent spent on supplies, trips, snacks and prizes. The slices appear to show the whole budget. What is wrong?
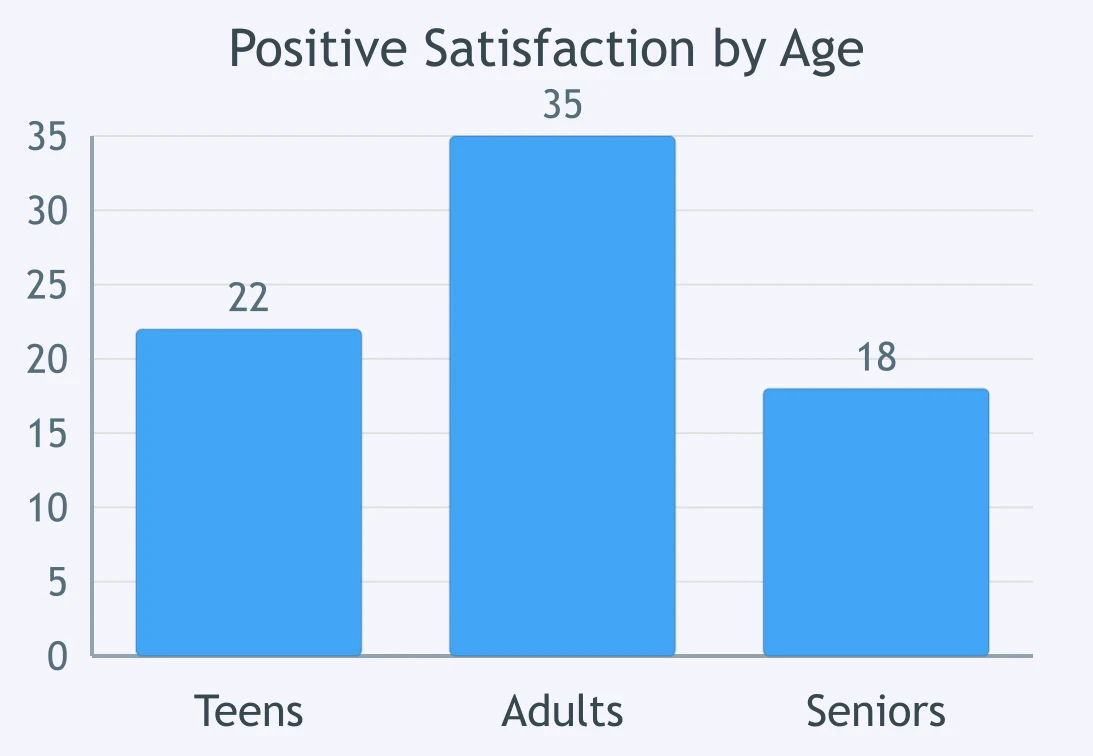
A bar chart for a city park survey shows positive satisfaction responses by age group. Adults appears largest. What feature makes the display hard to interpret?
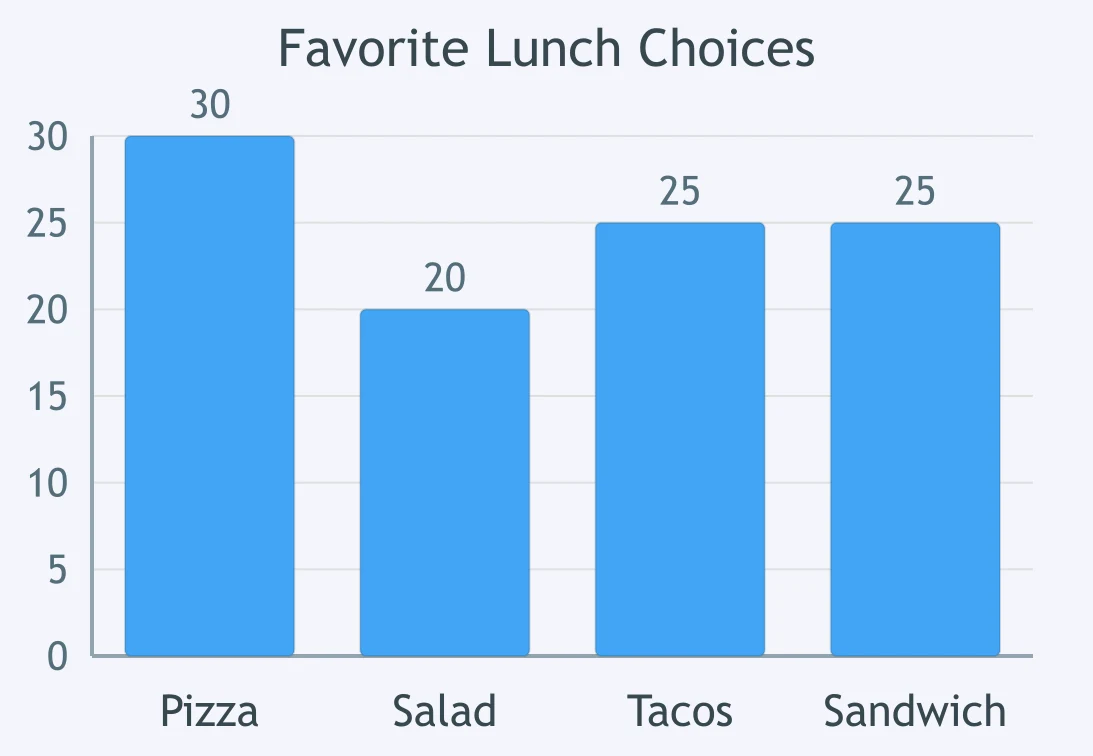
A bar chart for a cafeteria survey shows favorite lunch choice among students, and the Pizza bar is tallest. What missing feature makes the display hard to interpret?
Crack the passcode before the zombies get in.
Answer, then swat bugs for bonus points.
Race through questions at your own speed.
Same question on every screen. Fastest wins.

Pick a tile, answer, hit bonuses and steals.
Which Measure of Center? Outliers and Skew
24 questions