Loading
by BlastRoom
Reading counts and percentages off the two standard categorical displays, and knowing when each is legitimate.
#probability_and_statistics
20 questions
One question set, multiple game modes. Tap any game to see it in action. Not sure which to pick?
Answer to place stones and capture territory.
Outrun the snow together.
Earn blasts, then hunt the other team.
Answer to earn energy, then climb.

The class blasts through walls together.
Bid on mystery lots. Most money wins.
Sell tours. Nice, standard, or a total scam.

Answer, restock, and serve the rush.
More correct answers pulls the rope your way.
Answer, then shoot down the alien wave.
Answer, then tap to leap the frozen ridge.
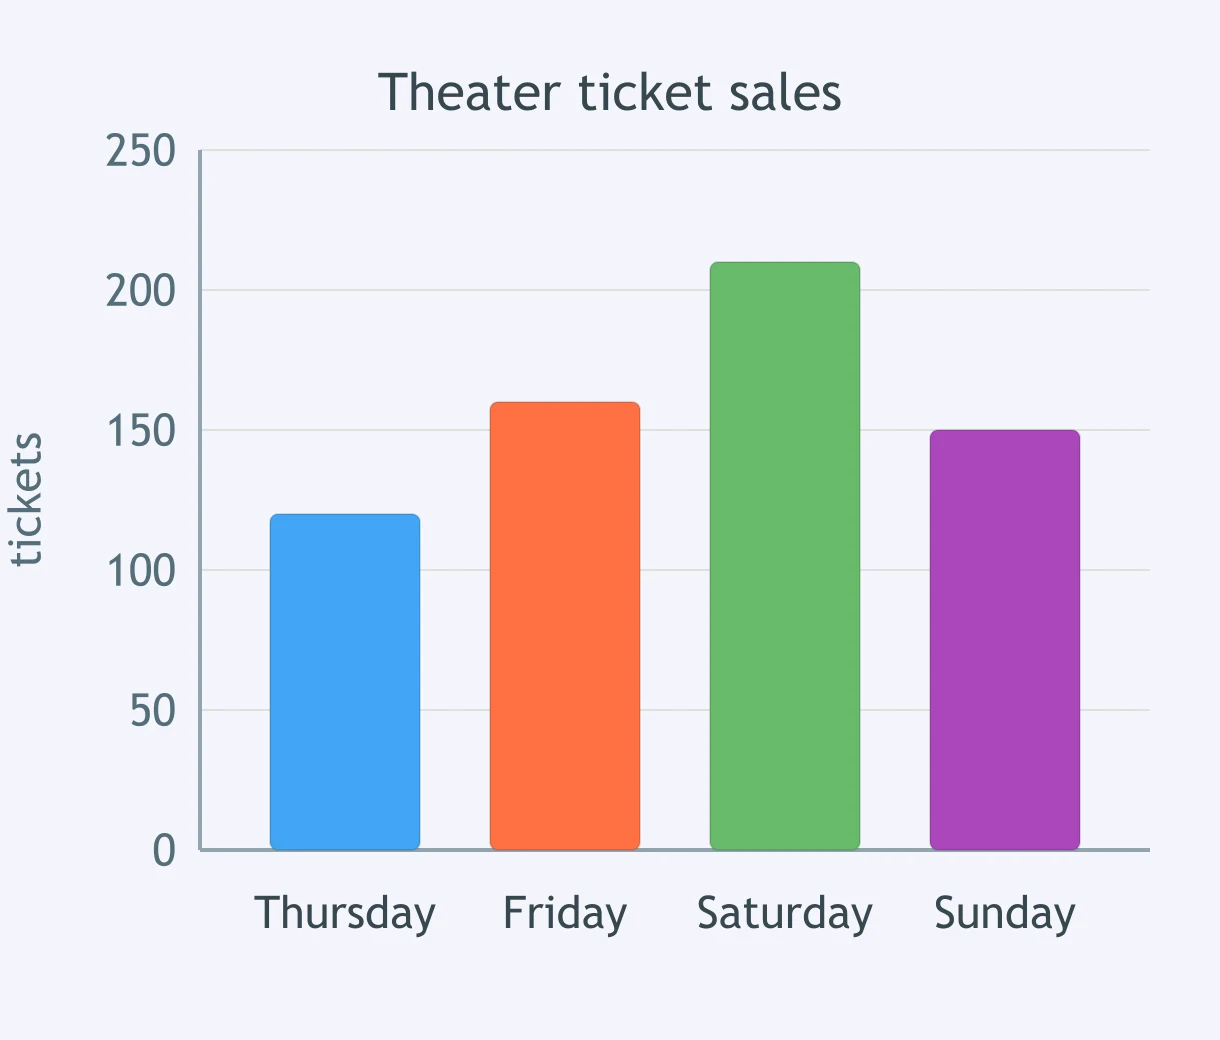
The bar graph shows school theater tickets sold Thursday through Sunday, with the vertical axis labeled in tickets. How many tickets were sold on Saturday and Sunday together?
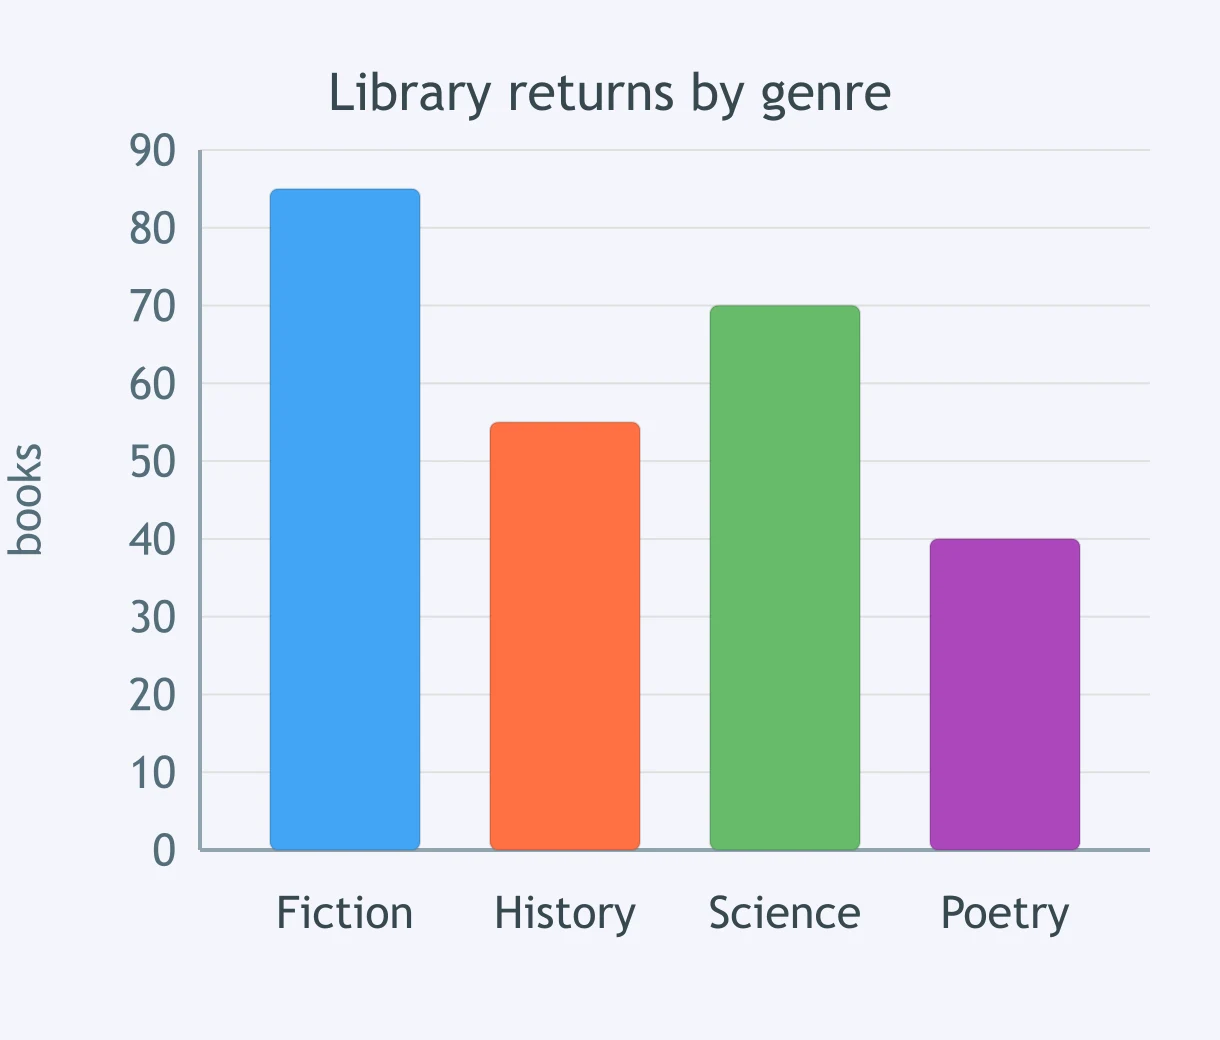
A bar graph shows library books returned this week by genre: fiction, history, science, and poetry. The vertical axis is books. How many more fiction and science books were returned than history and poetry books?
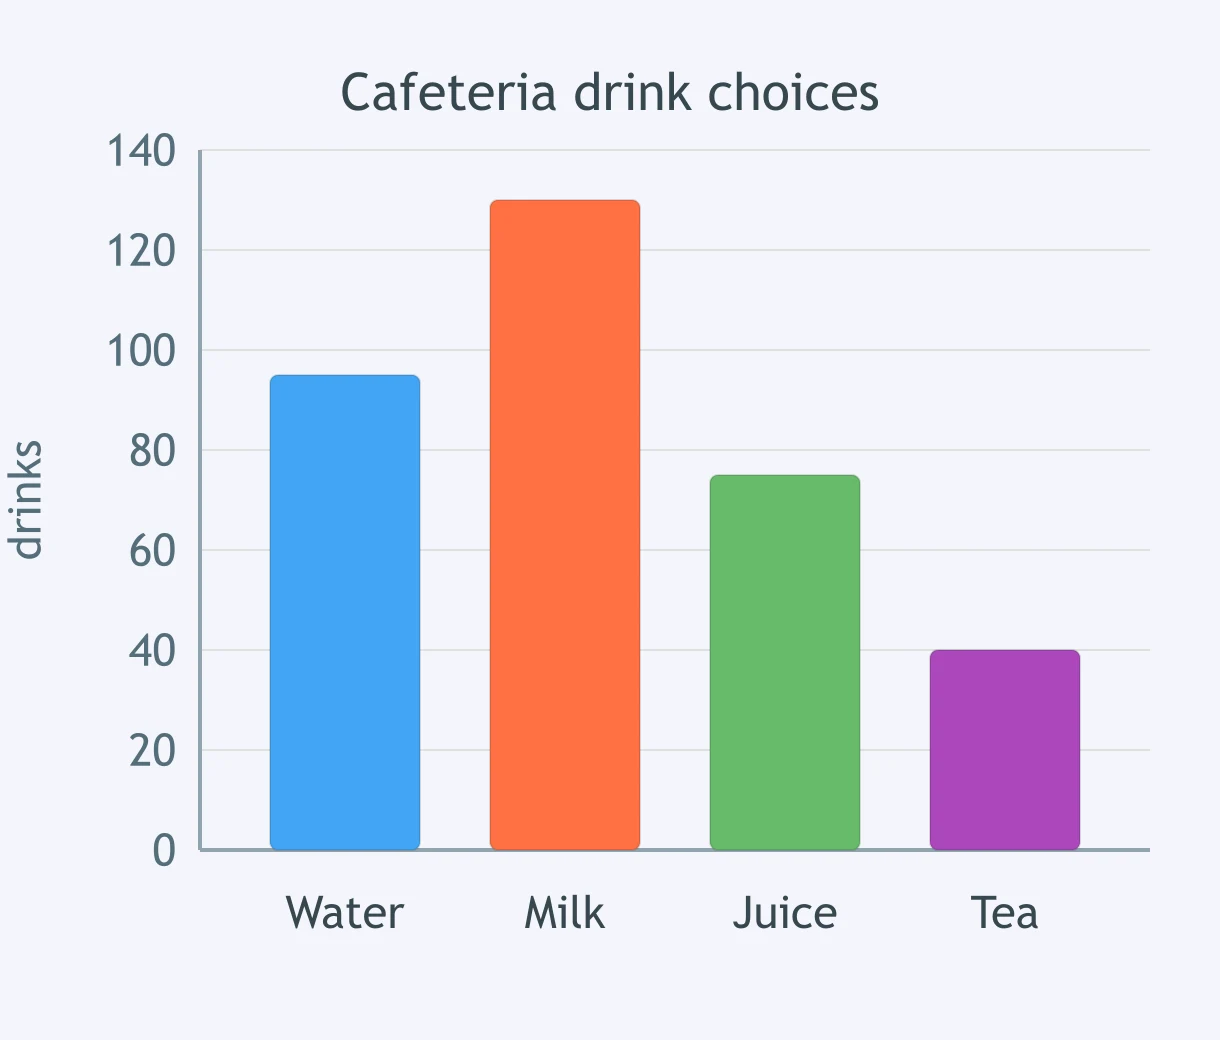
The bar graph shows cafeteria drink choices for water, milk, juice, and tea, with the vertical axis labeled in drinks. By how many drinks did water and juice together exceed tea?
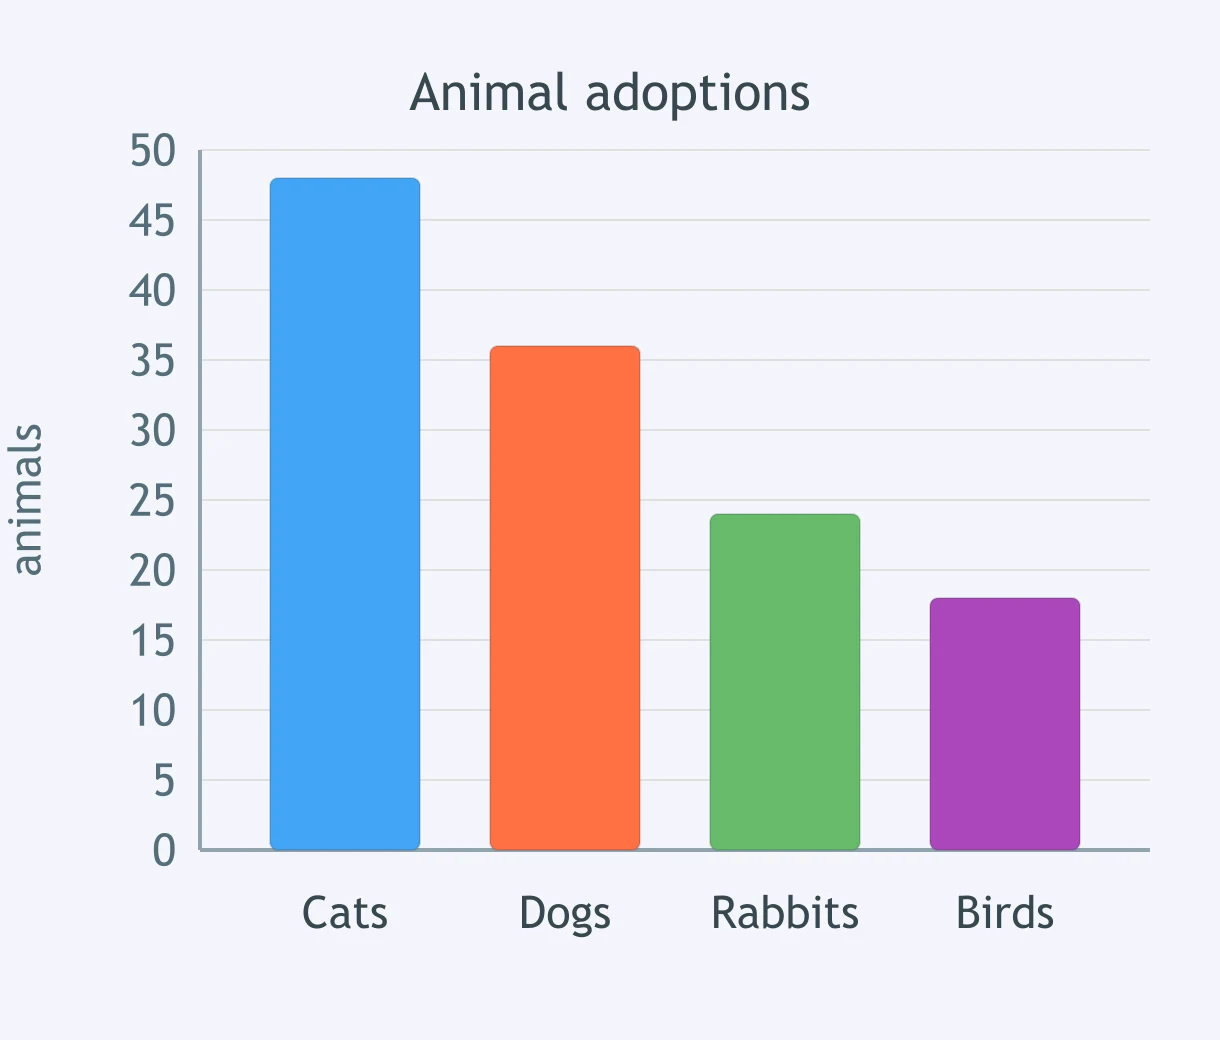
A bar graph shows animal adoptions this month for cats, dogs, rabbits, and birds. The vertical axis is animals. How many more cats and dogs were adopted than rabbits and birds?
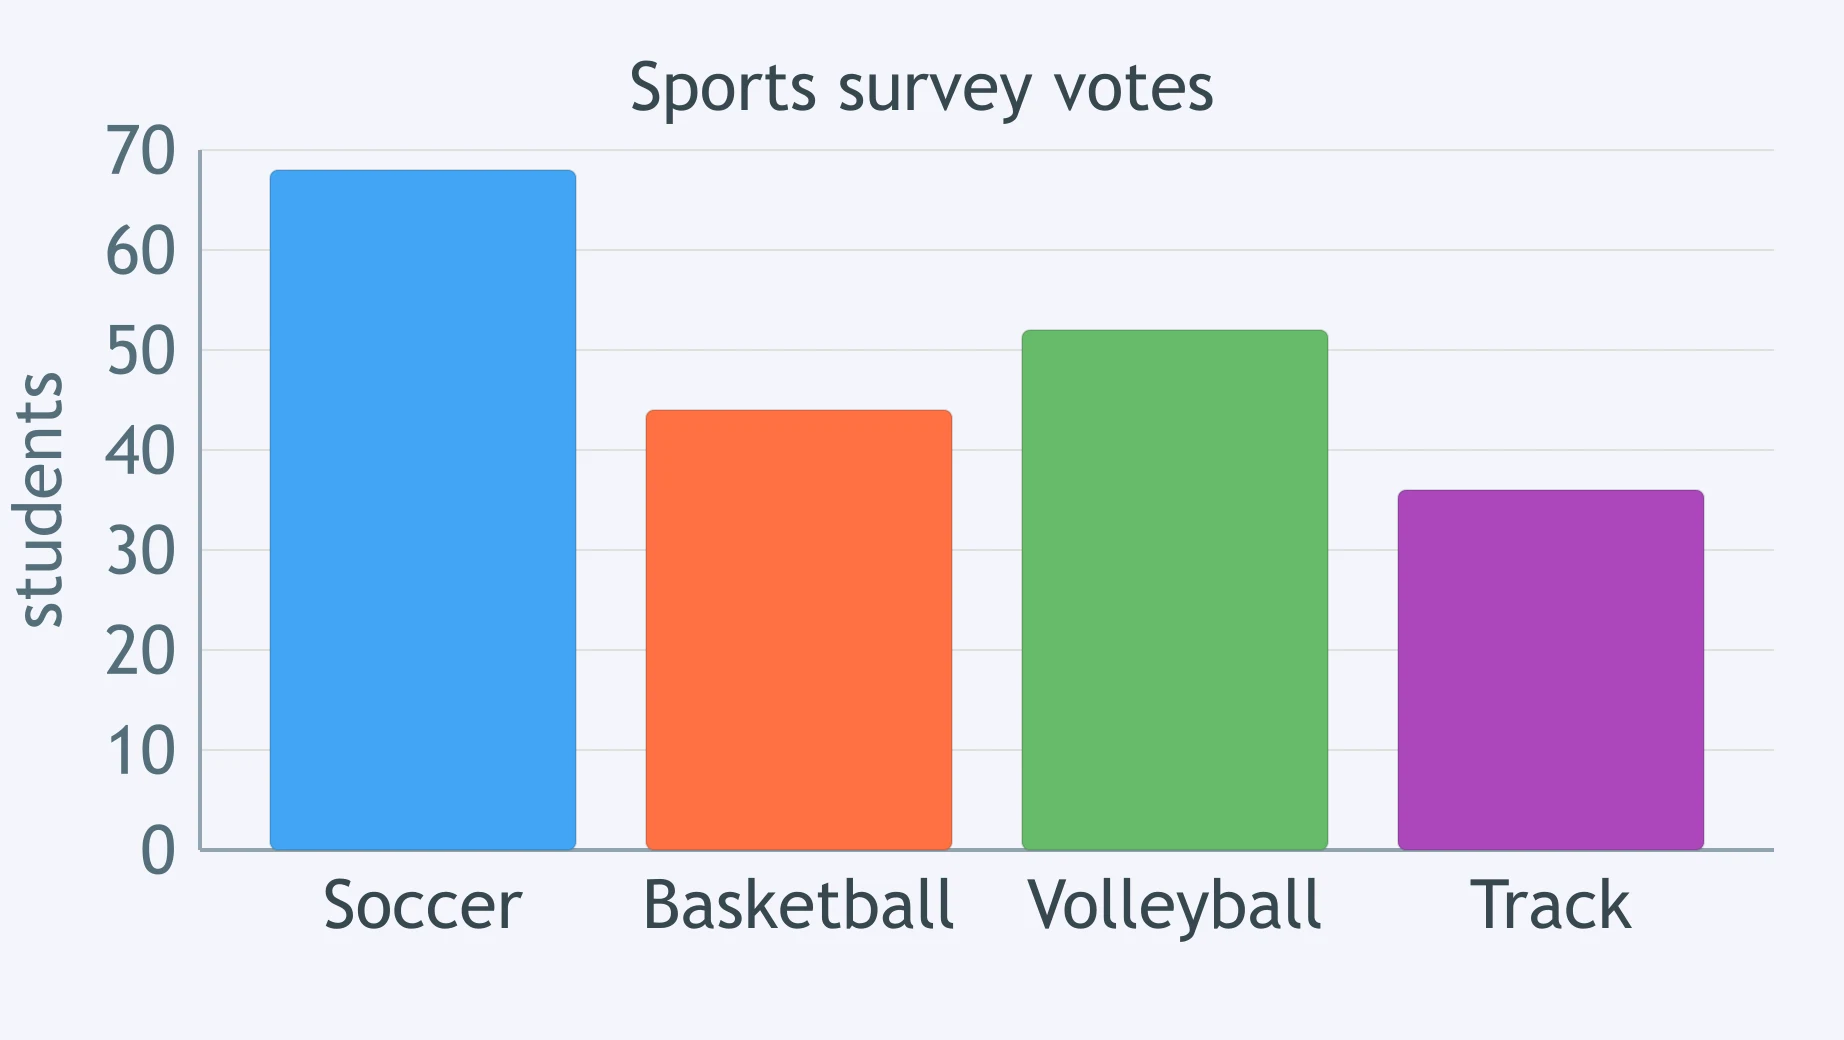
The bar graph shows votes for soccer, basketball, volleyball, and track in a school sports survey. The vertical axis is students. How many more students chose soccer and volleyball together than basketball and track together?
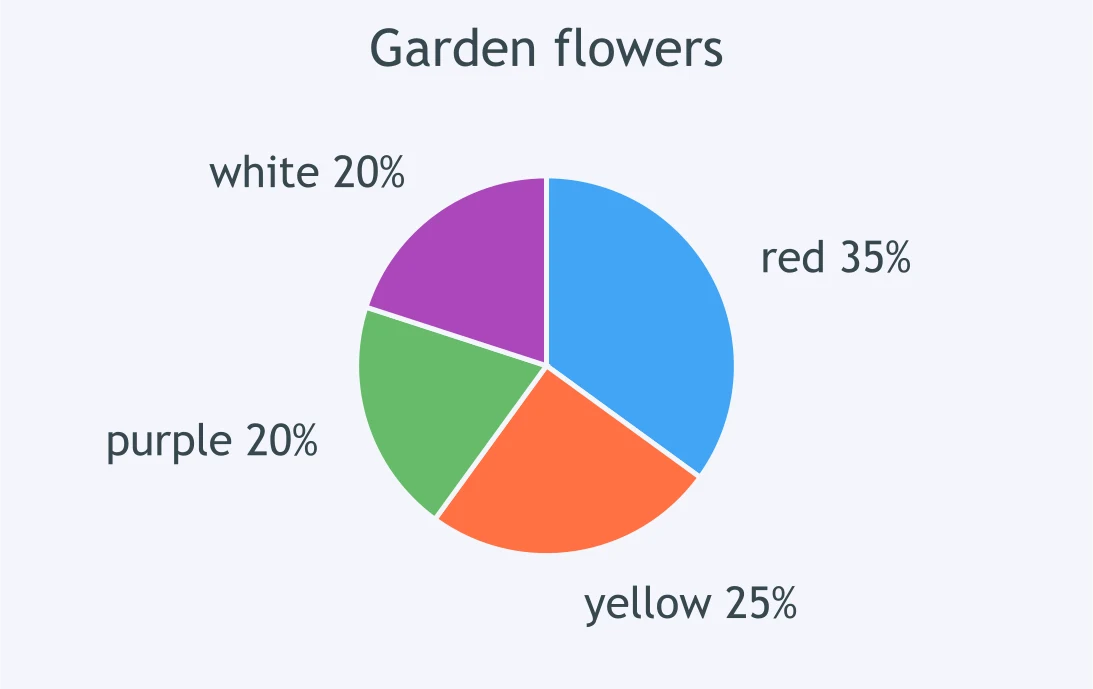
A pie chart divides 360 flowers in a garden by color: red, yellow, purple, and white. Slice labels are percentages. How many flowers are yellow?
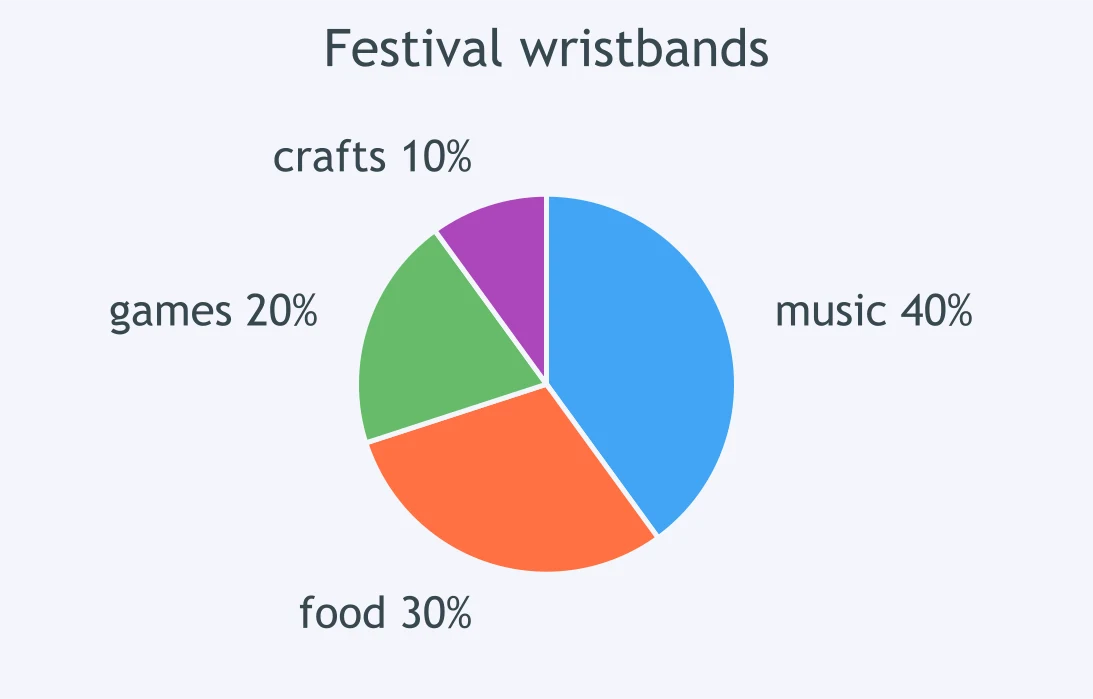
A pie chart divides 500 festival wristbands by activity area: music, food, games, and crafts. Slice labels are percentages. How many wristbands are for games?
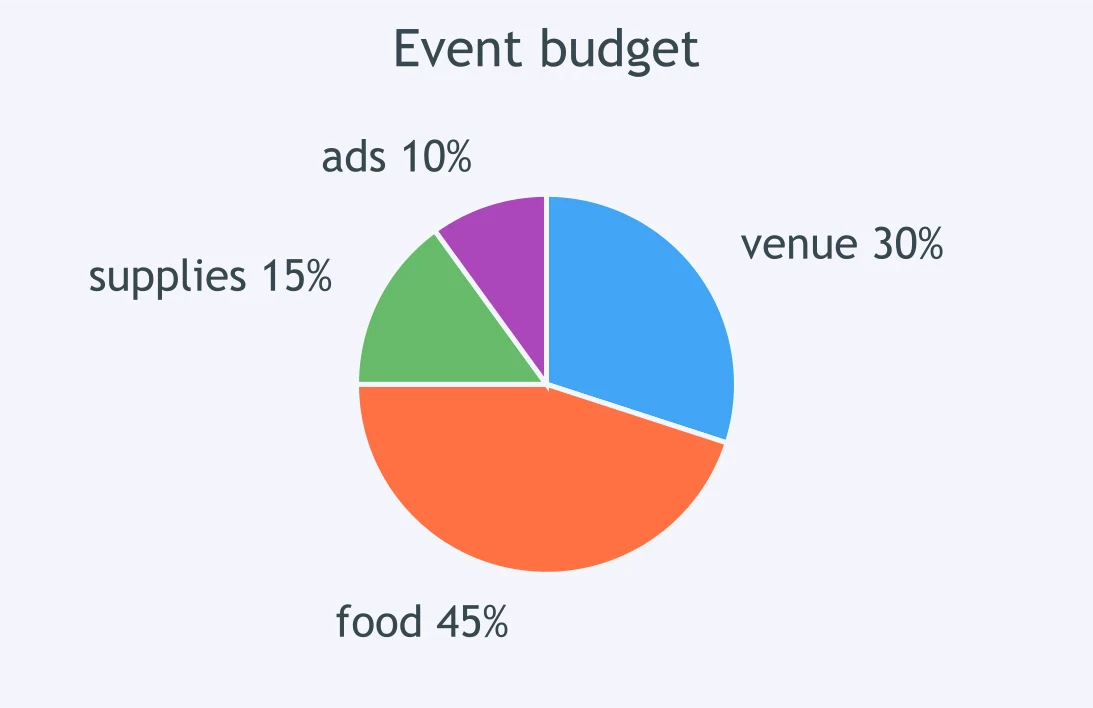
The pie chart divides a student club's $800 event budget among venue, food, supplies, and advertising. Slice labels are percentages. How many dollars are budgeted for food?
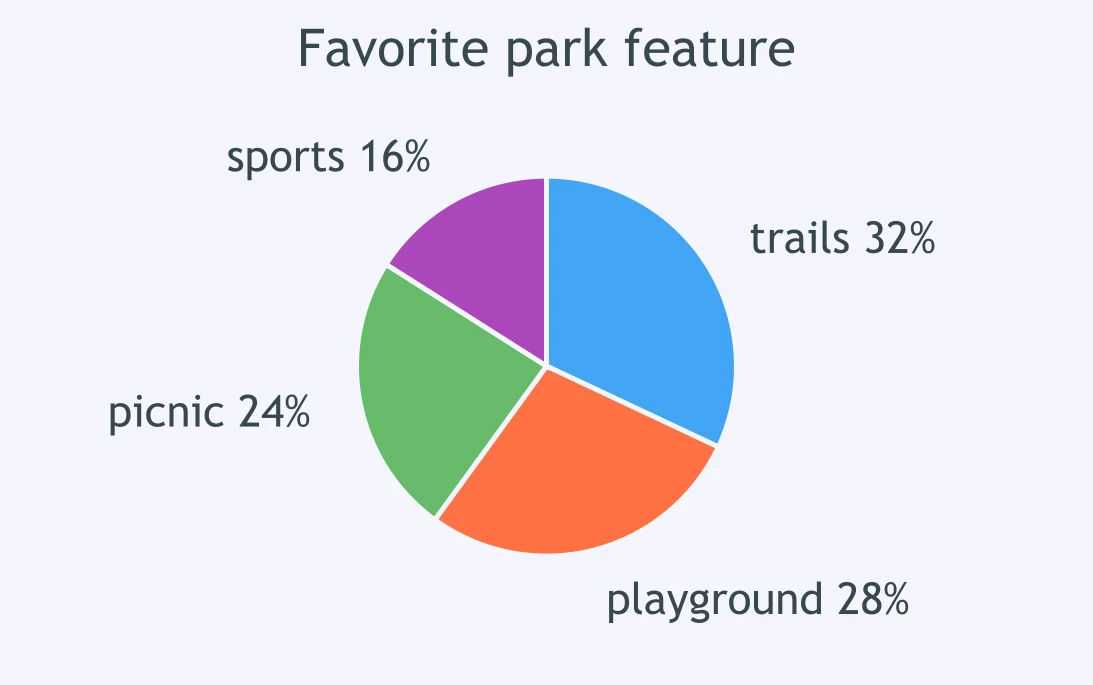
A pie chart divides 250 residents by favorite park feature: trails, playground, picnic area, and sports field. Slice labels are percentages. How many residents chose the picnic area?
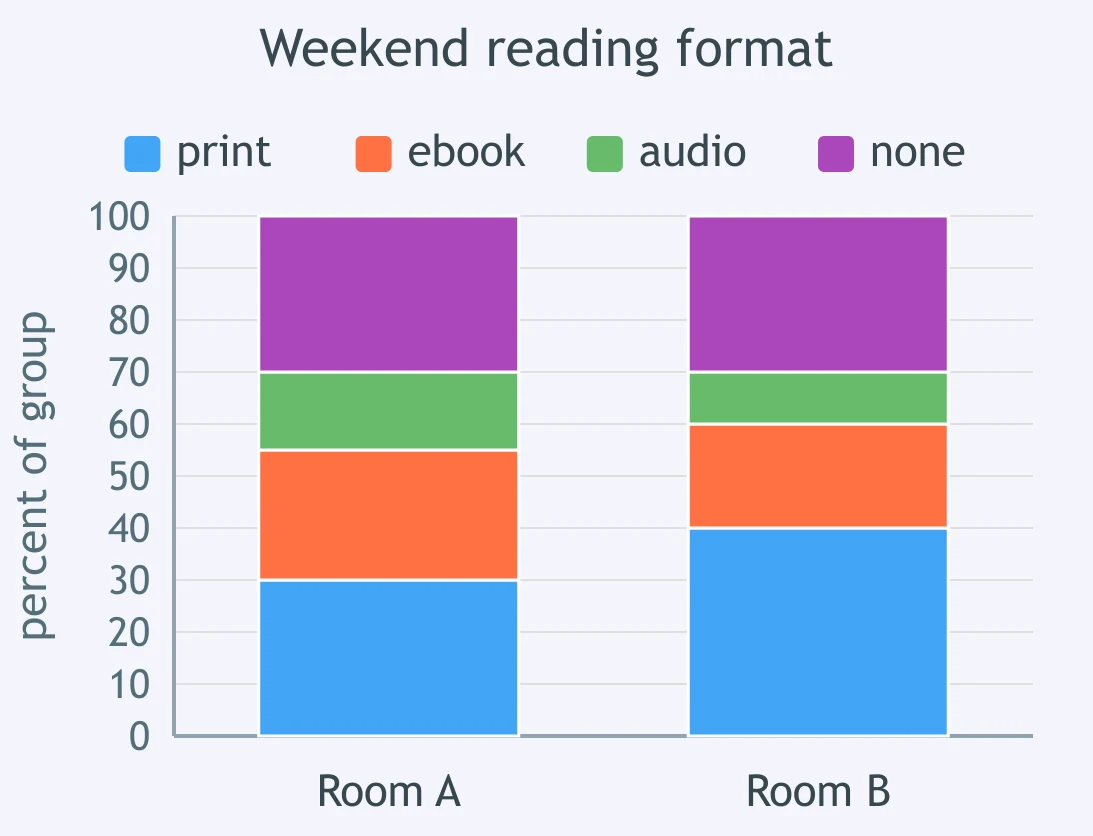
A segmented bar graph shows Room A and Room B weekend reading formats: print, ebook, audio, and none. Each bar is its own class, and the axis runs 0 to 100 percent. What percent of Room A chose ebook?
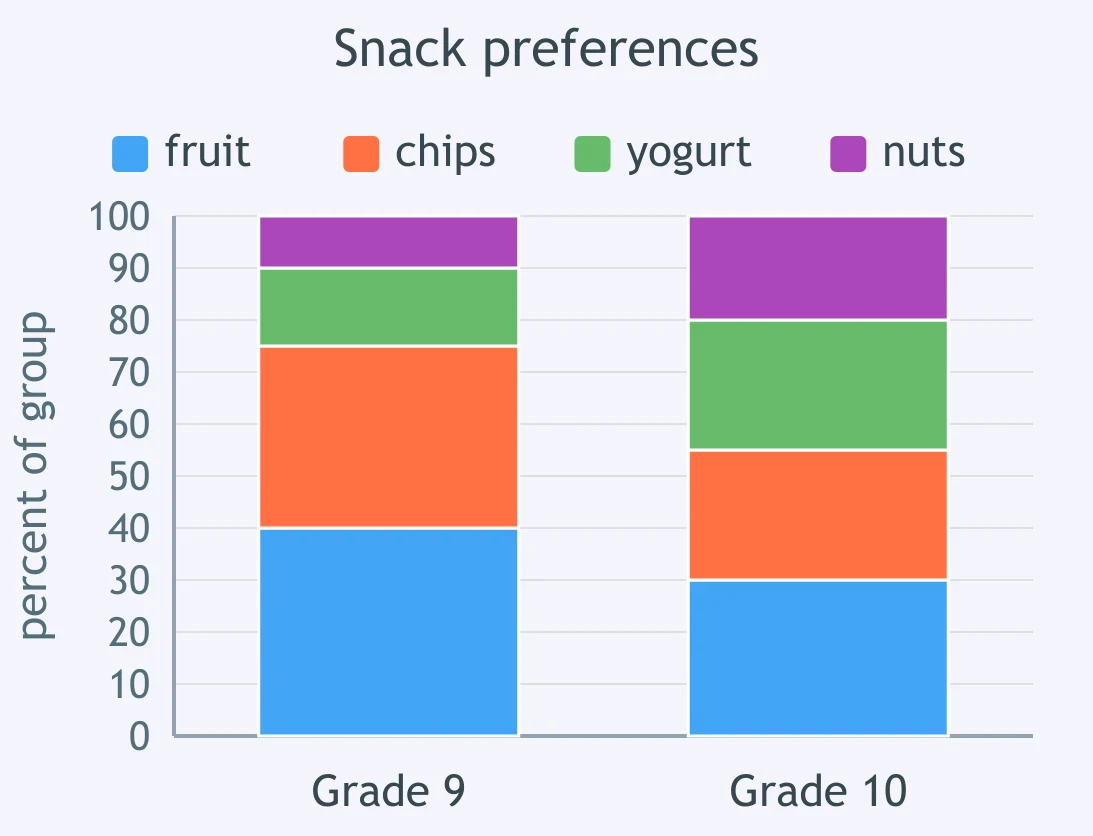
A segmented bar graph compares Grade 9 and Grade 10 snack preferences: fruit, chips, yogurt, and nuts. Each grade's bar totals 100 percent. What percent of Grade 9 students chose chips?
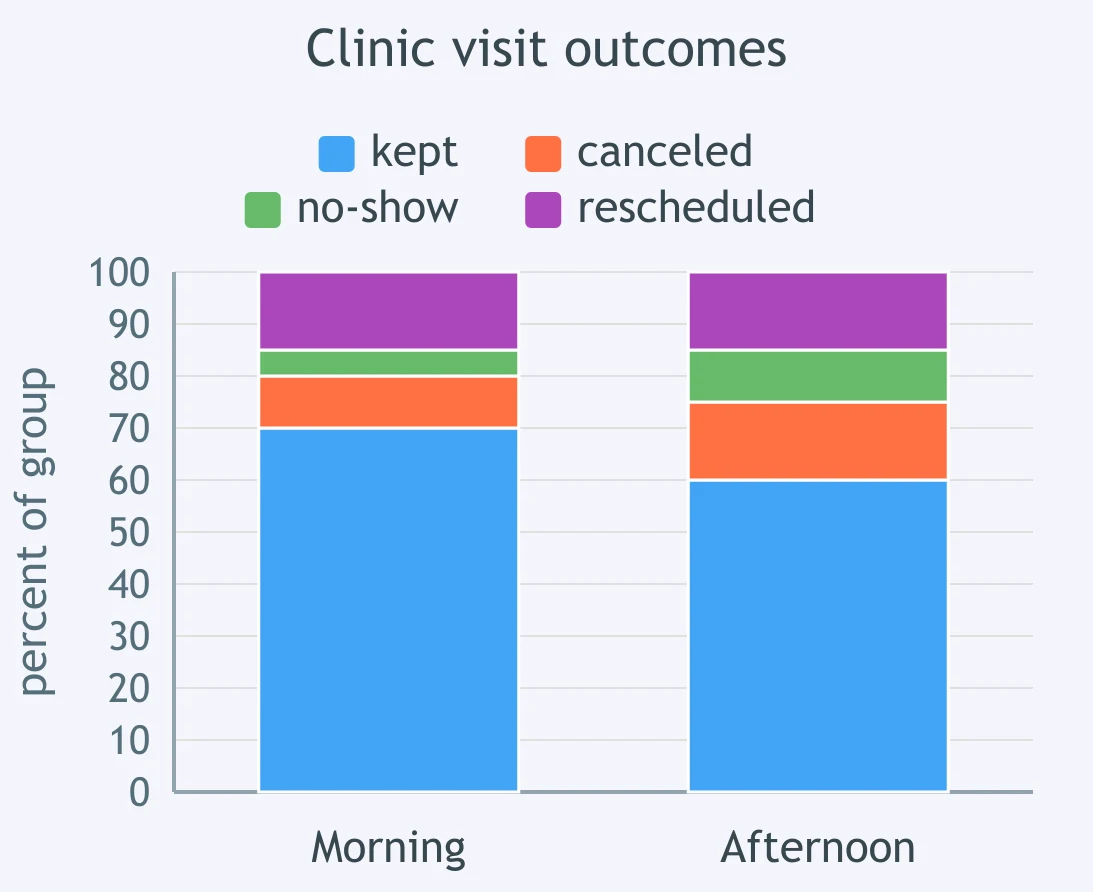
A segmented bar graph shows morning and afternoon clinic visit outcomes: kept, canceled, no-show, and rescheduled. Each bar totals 100 percent. What percent of afternoon visits were either canceled or no-show?
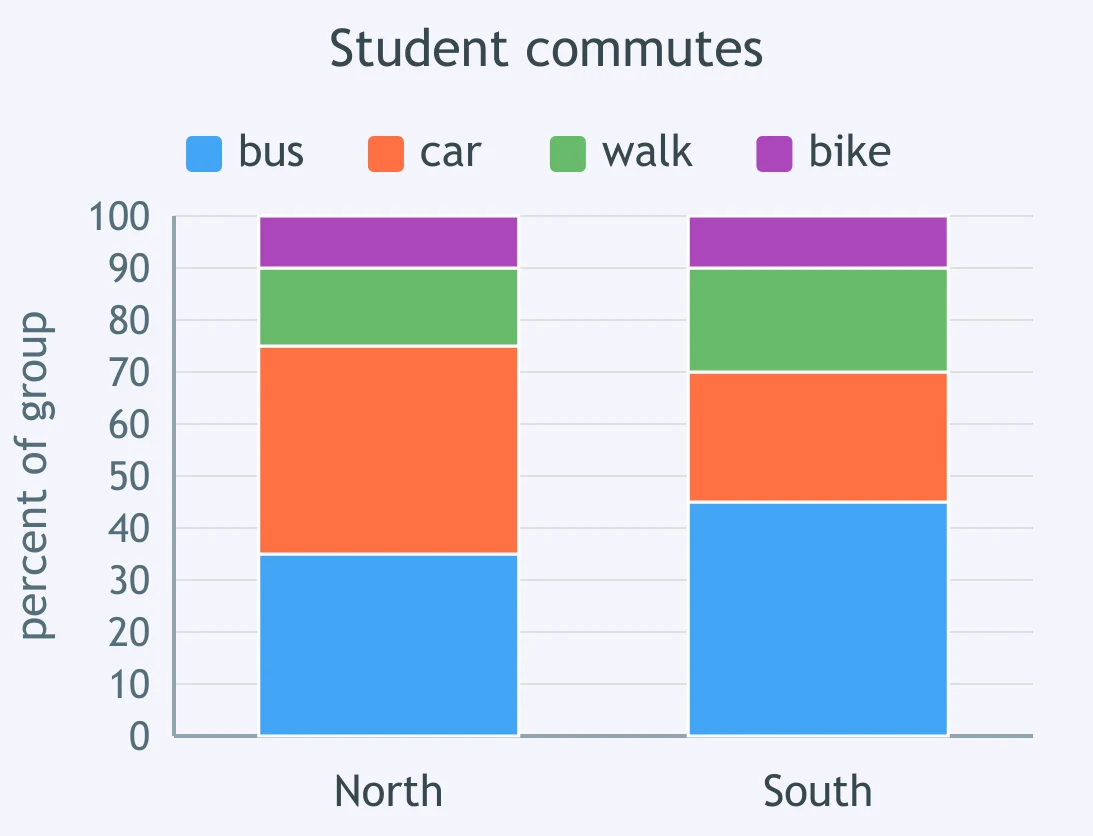
A segmented bar graph compares North and South student commutes: bus, car, walk, and bike. Each campus has its own 100 percent bar. What percent of South students did not ride in a car?
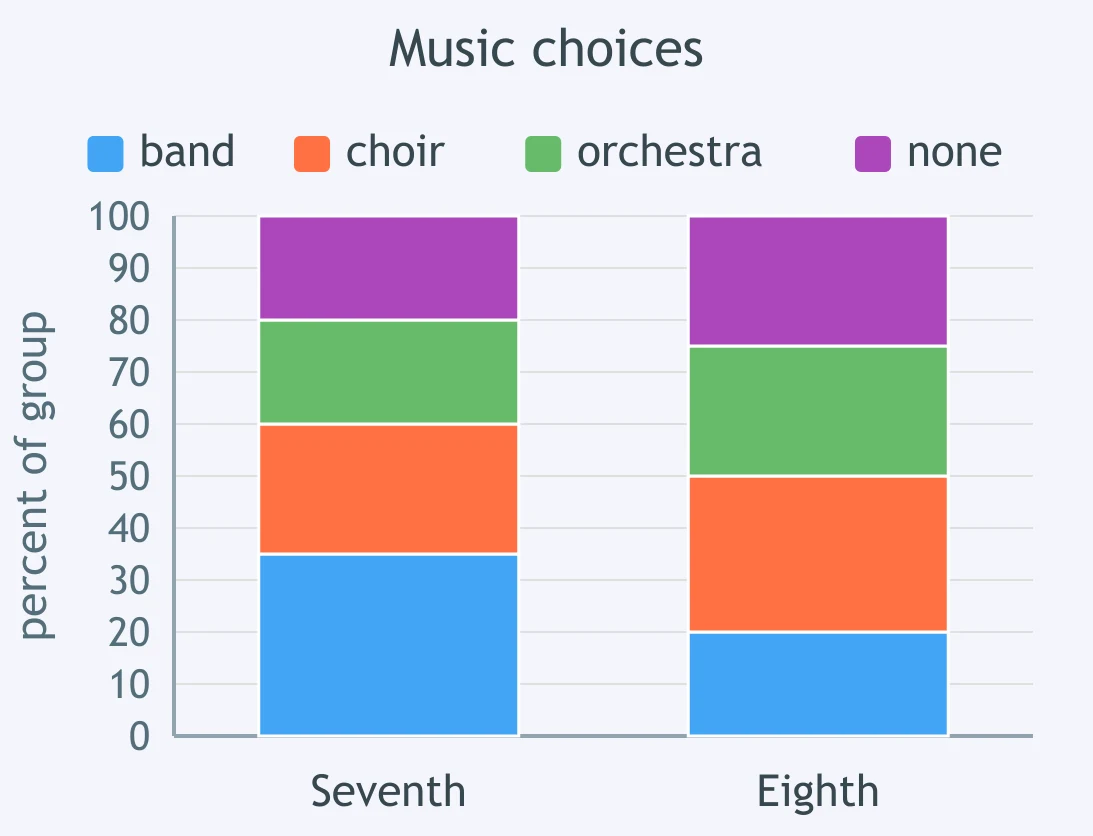
A segmented bar graph shows seventh and eighth grade music choices: band, choir, orchestra, and none. Each grade's bar totals 100 percent. What percent of eighth graders chose choir or orchestra?
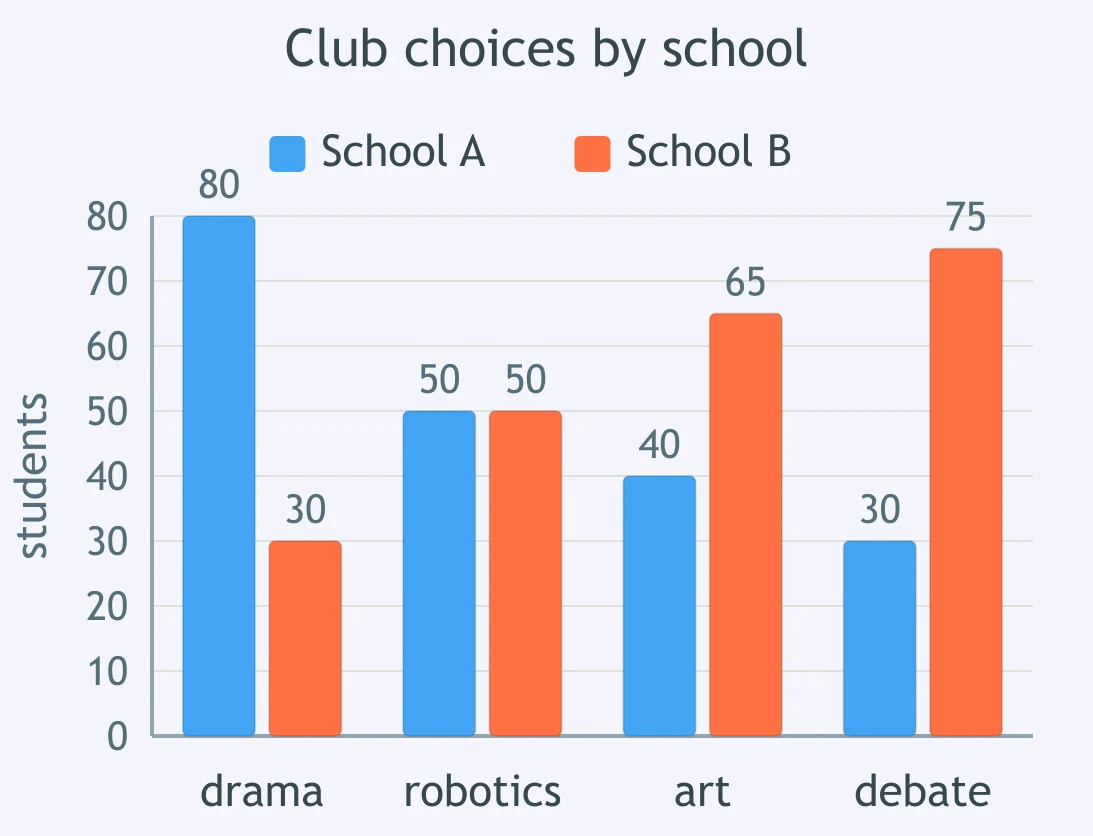
A bar graph shows School A and School B club choices in paired bars for drama, robotics, art, and debate on the same student scale. Which club has the largest difference between schools?
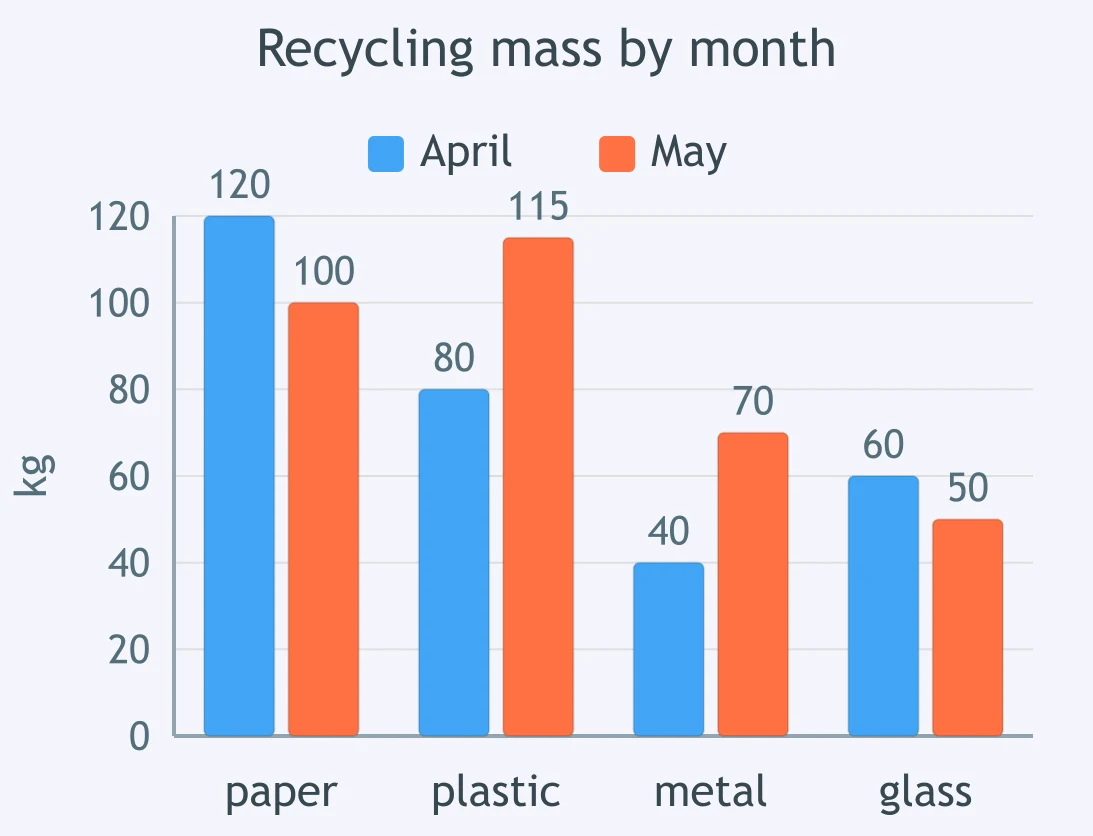
A bar graph shows April and May recycling masses in paired bars for paper, plastic, metal, and glass on the same kilogram scale. Which material increased the most from April to May?
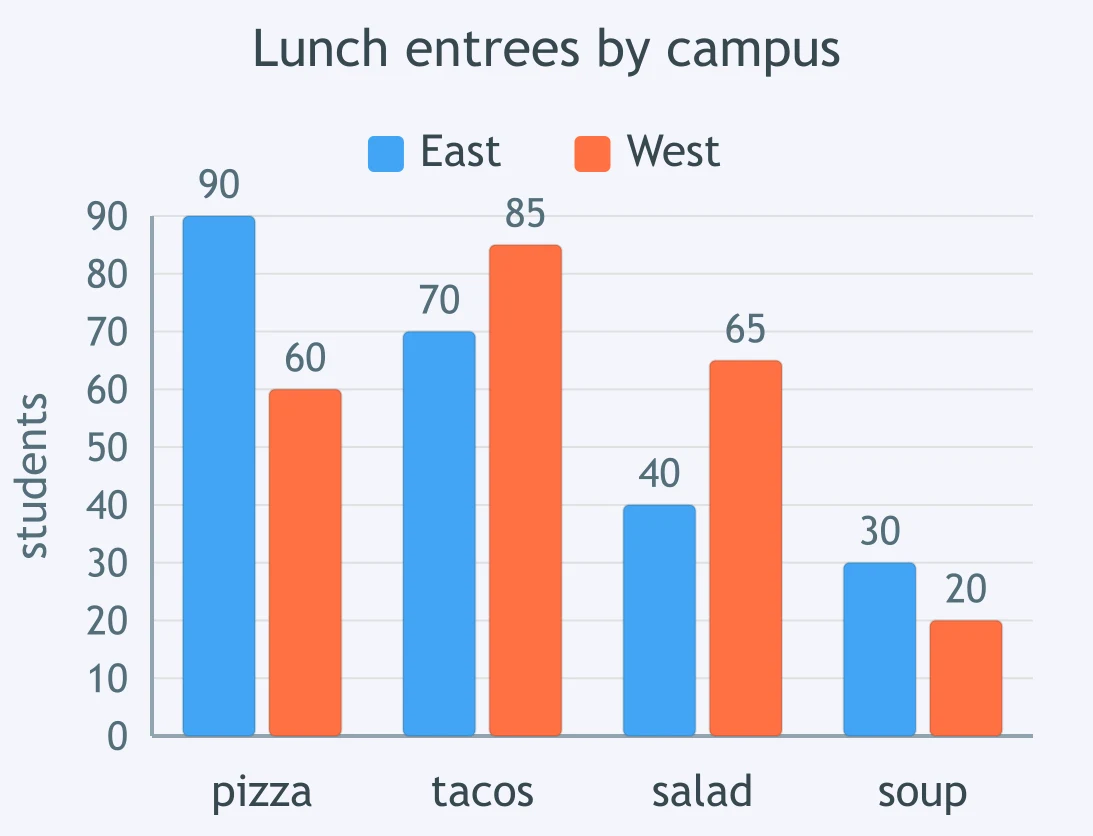
A bar graph shows East and West lunch entree counts in paired bars for pizza, tacos, salad, and soup on the same student scale. For which entree is West greater than East by the larger margin?
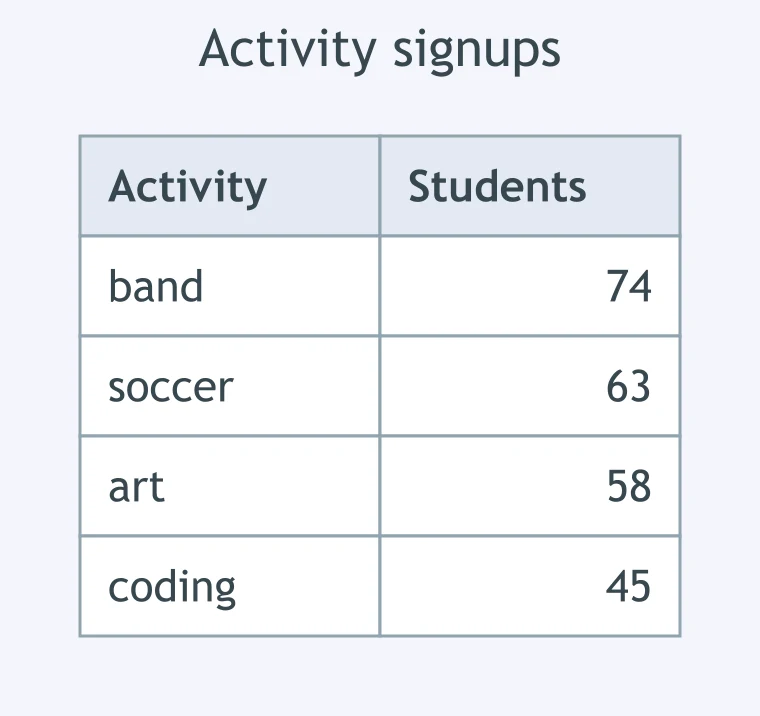
A survey lets each of 200 students choose any activities, so activity counts can overlap. The table lists band, soccer, art, and coding counts. Choose from a bar graph, pie chart, or segmented bar graph to compare counts by activity.
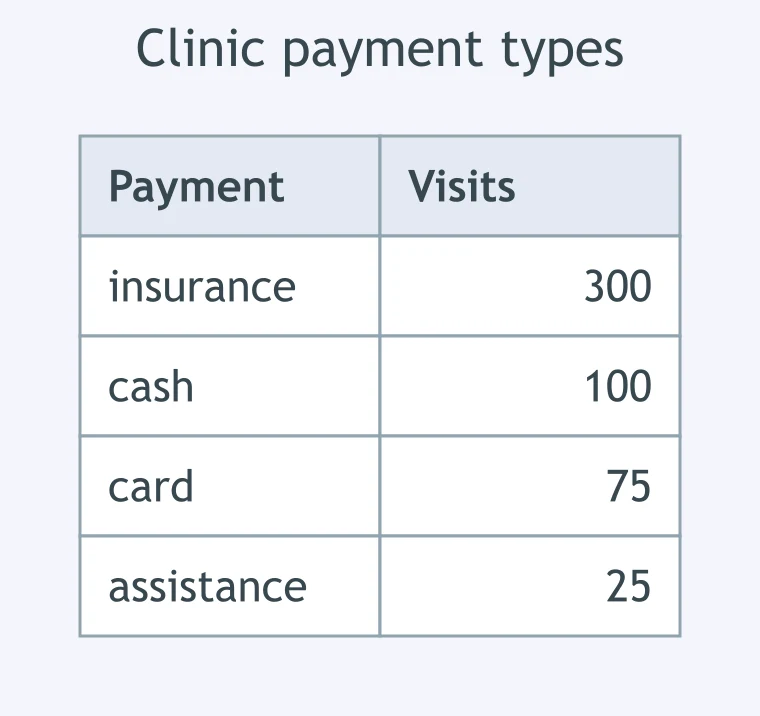
A clinic records exactly one payment type for each of 500 visits. The table lists insurance, cash, card, and assistance counts. Choose from a pie chart, histogram, or segmented bar graph to show each type's share of all visits.
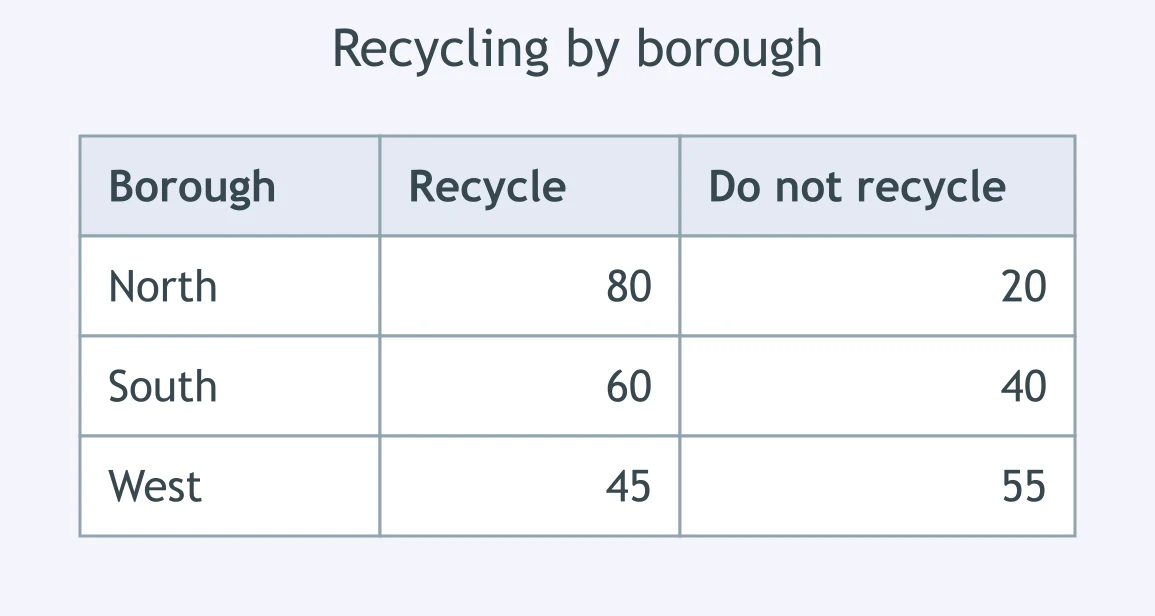
A city table gives each borough's recycling and do-not-recycle counts. The city wants to compare recycling rates across boroughs. Choose from a segmented bar graph, pie chart, or single bar graph of recycler totals.
Crack the passcode before the zombies get in.
Answer, then swat bugs for bonus points.
Race through questions at your own speed.
Same question on every screen. Fastest wins.

Pick a tile, answer, hit bonuses and steals.
Stem-and-Leaf Plots
20 questions