Loading
by BlastRoom
Read outbreak data to work out how pathogens spread and whether a public health response worked.
#biology

20 questions
One question set, multiple game modes. Tap any game to see it in action. Not sure which to pick?
Answer to place stones and capture territory.
Outrun the snow together.
Earn blasts, then hunt the other team.
Answer to earn energy, then climb.

The class blasts through walls together.
Bid on mystery lots. Most money wins.
Sell tours. Nice, standard, or a total scam.

Answer, restock, and serve the rush.
More correct answers pulls the rope your way.
Answer, then shoot down the alien wave.
Answer, then tap to leap the frozen ridge.
Everyone in this graph ate at the same wedding reception on day 1. Salmonella has an incubation period of about 12 to 72 hours. What does the shape of the curve best support?
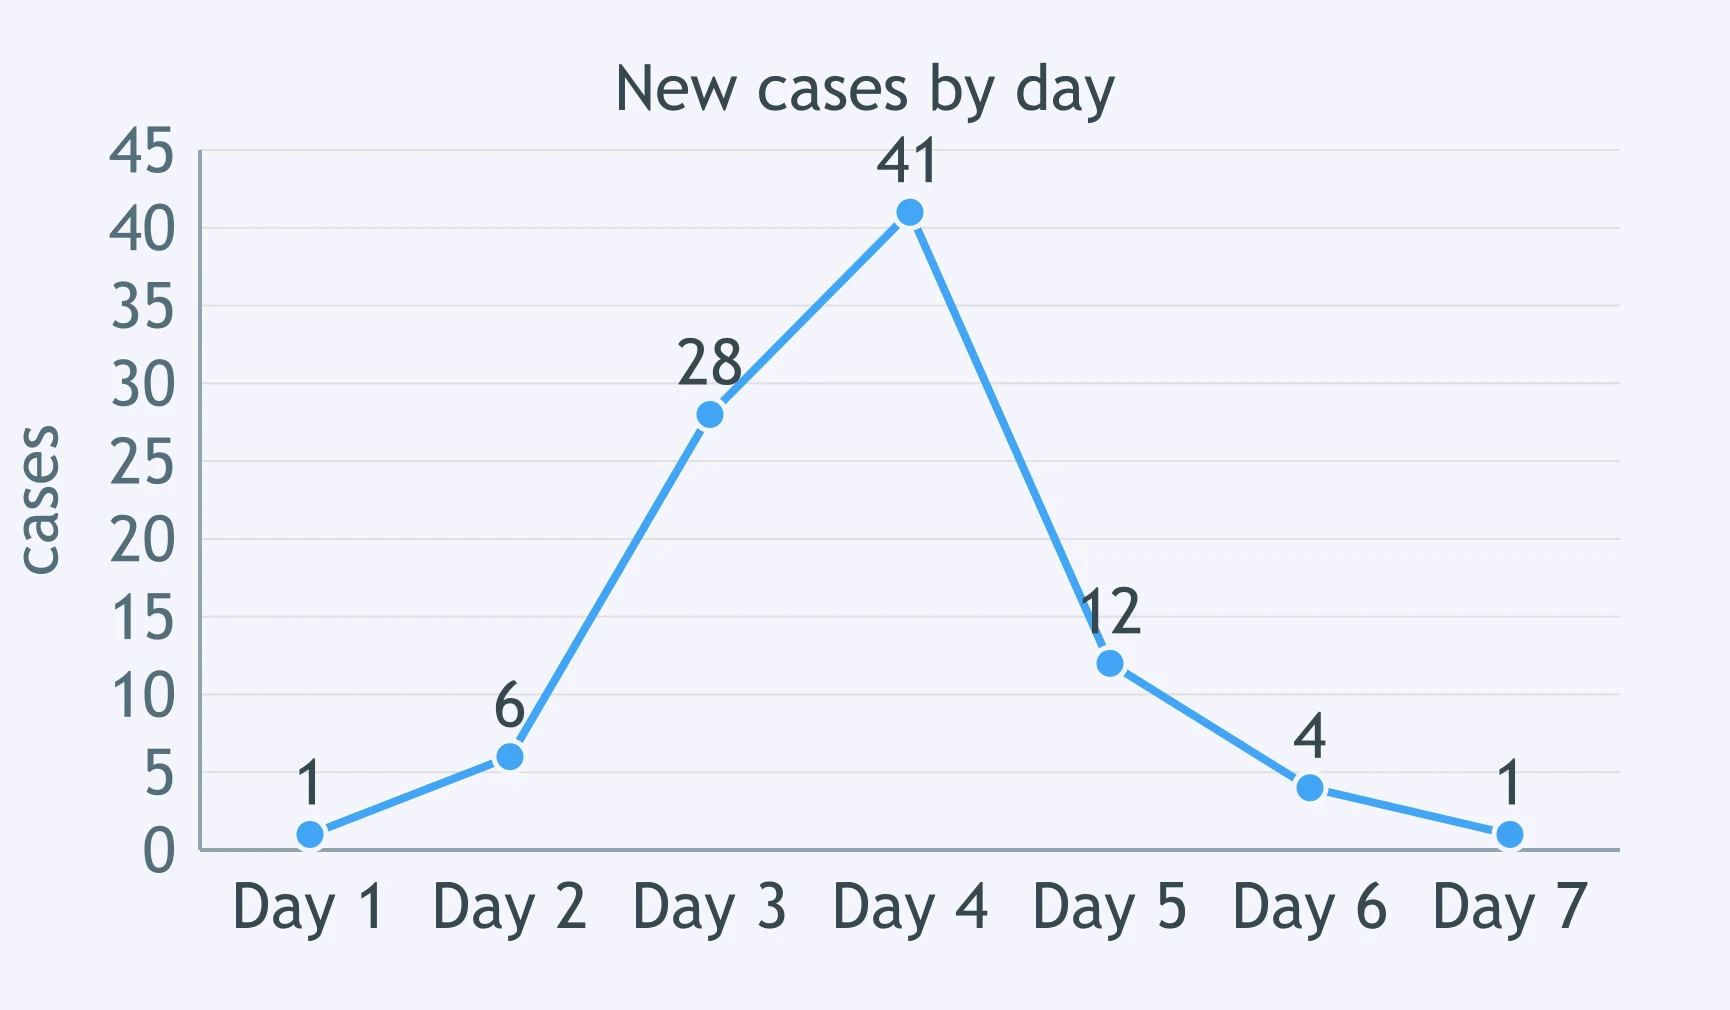
The graph shows measles cases reported each week in a town where no control measures have been started yet. What does the curve best support?
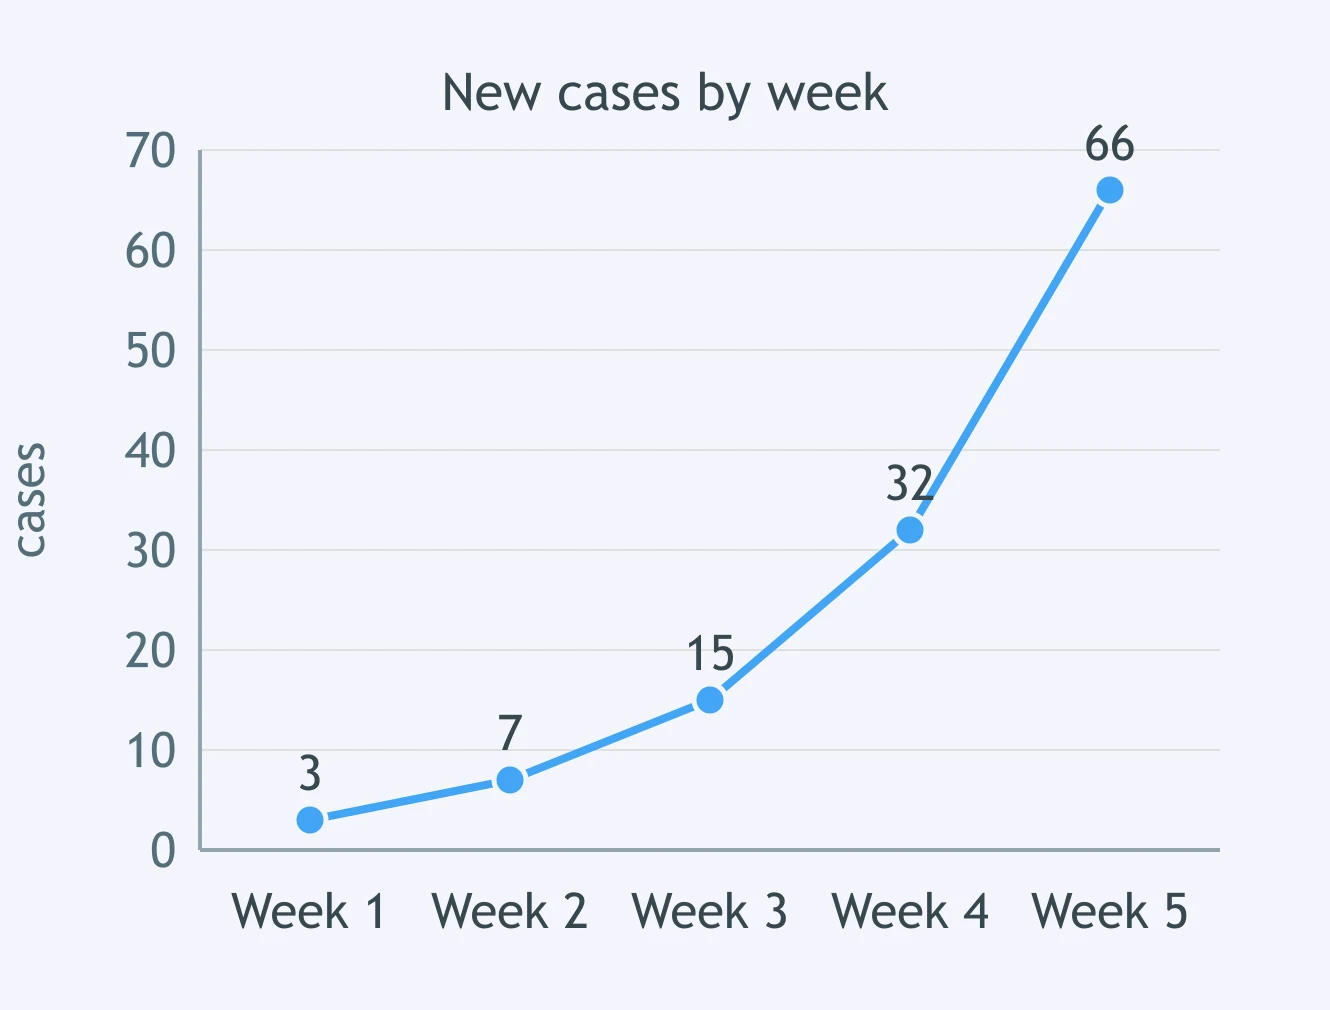
The graph shows new cases of an infectious disease each week in one district. Schools in the district were closed at the start of week 7 in response to the outbreak. Which conclusion does the data support?
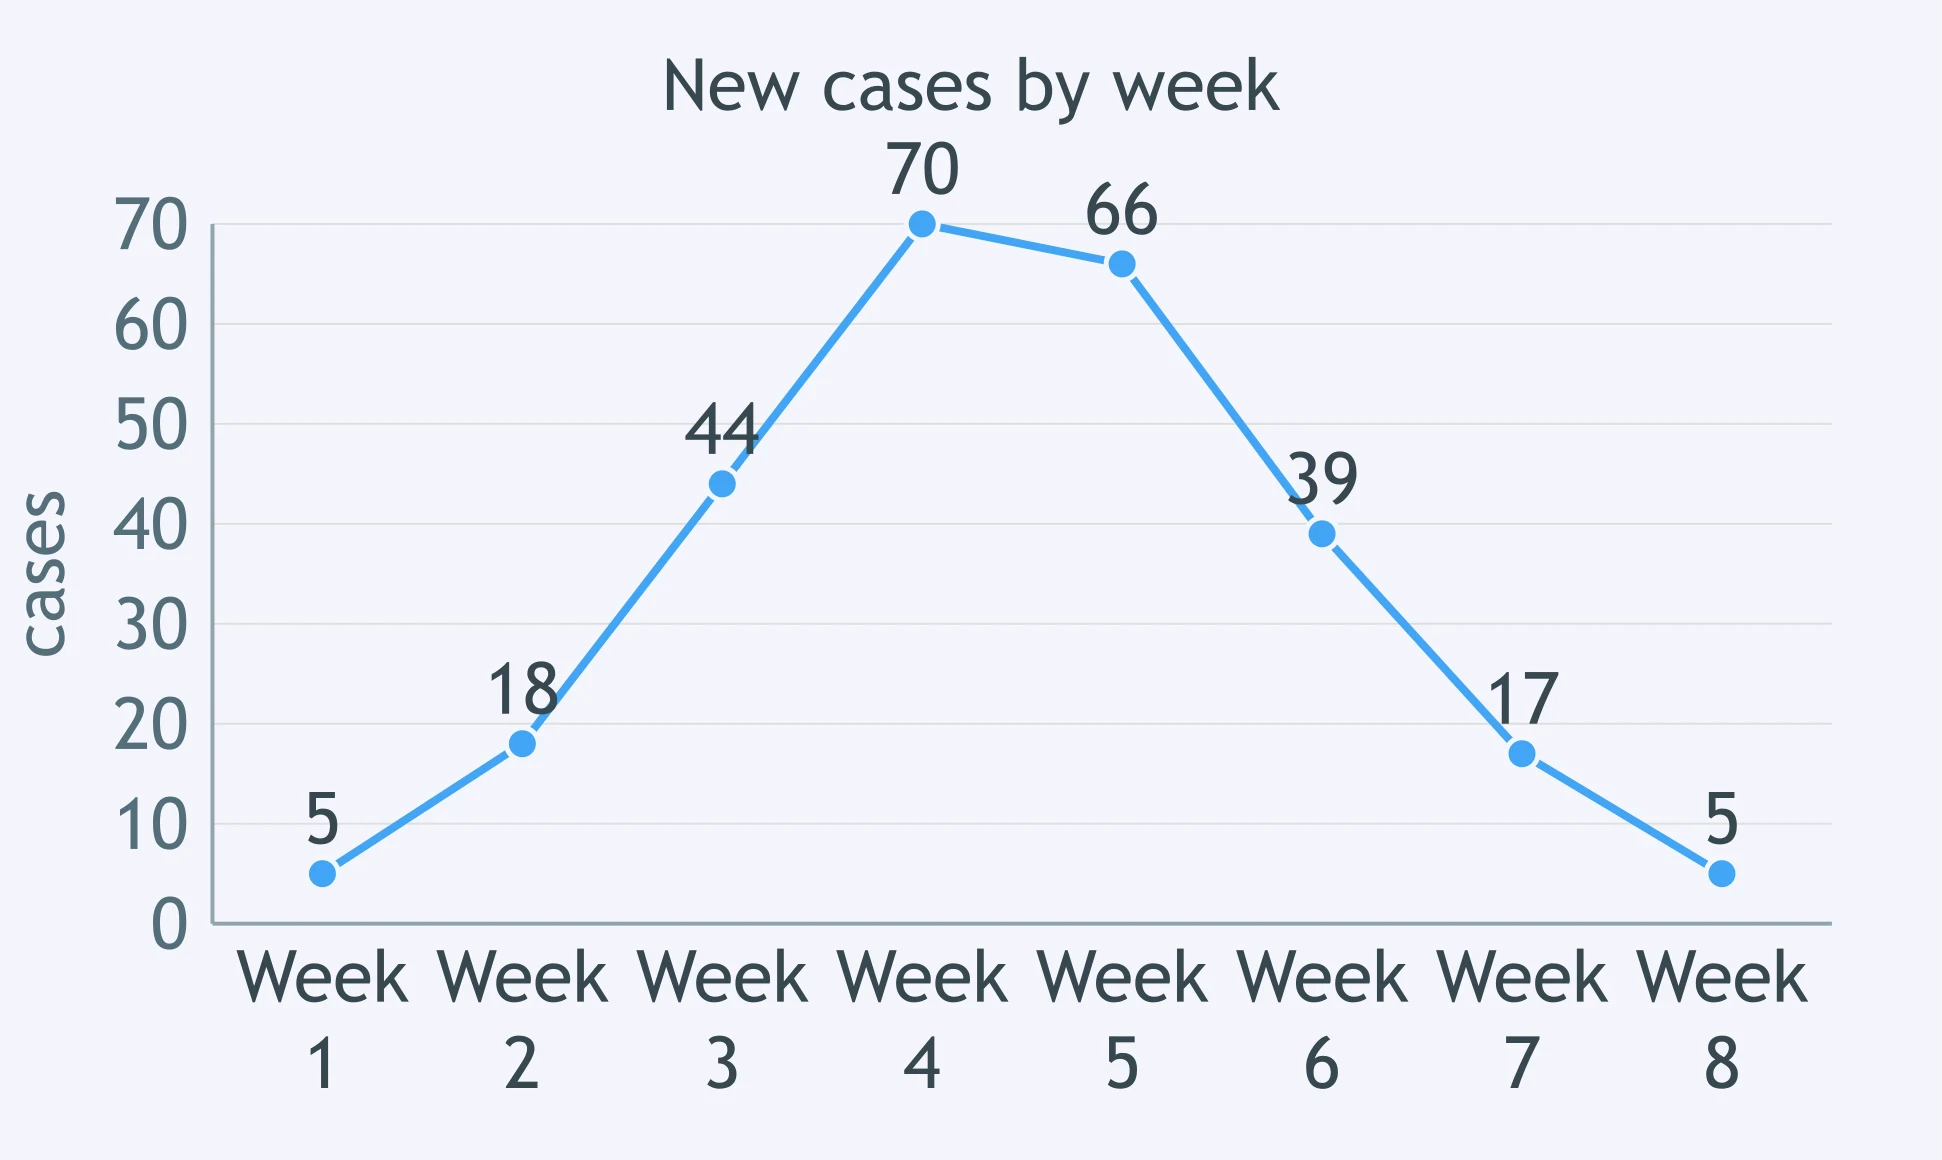
The graph shows laboratory-confirmed influenza cases reported each month in one city. Read the values off the scale. What does the data support?
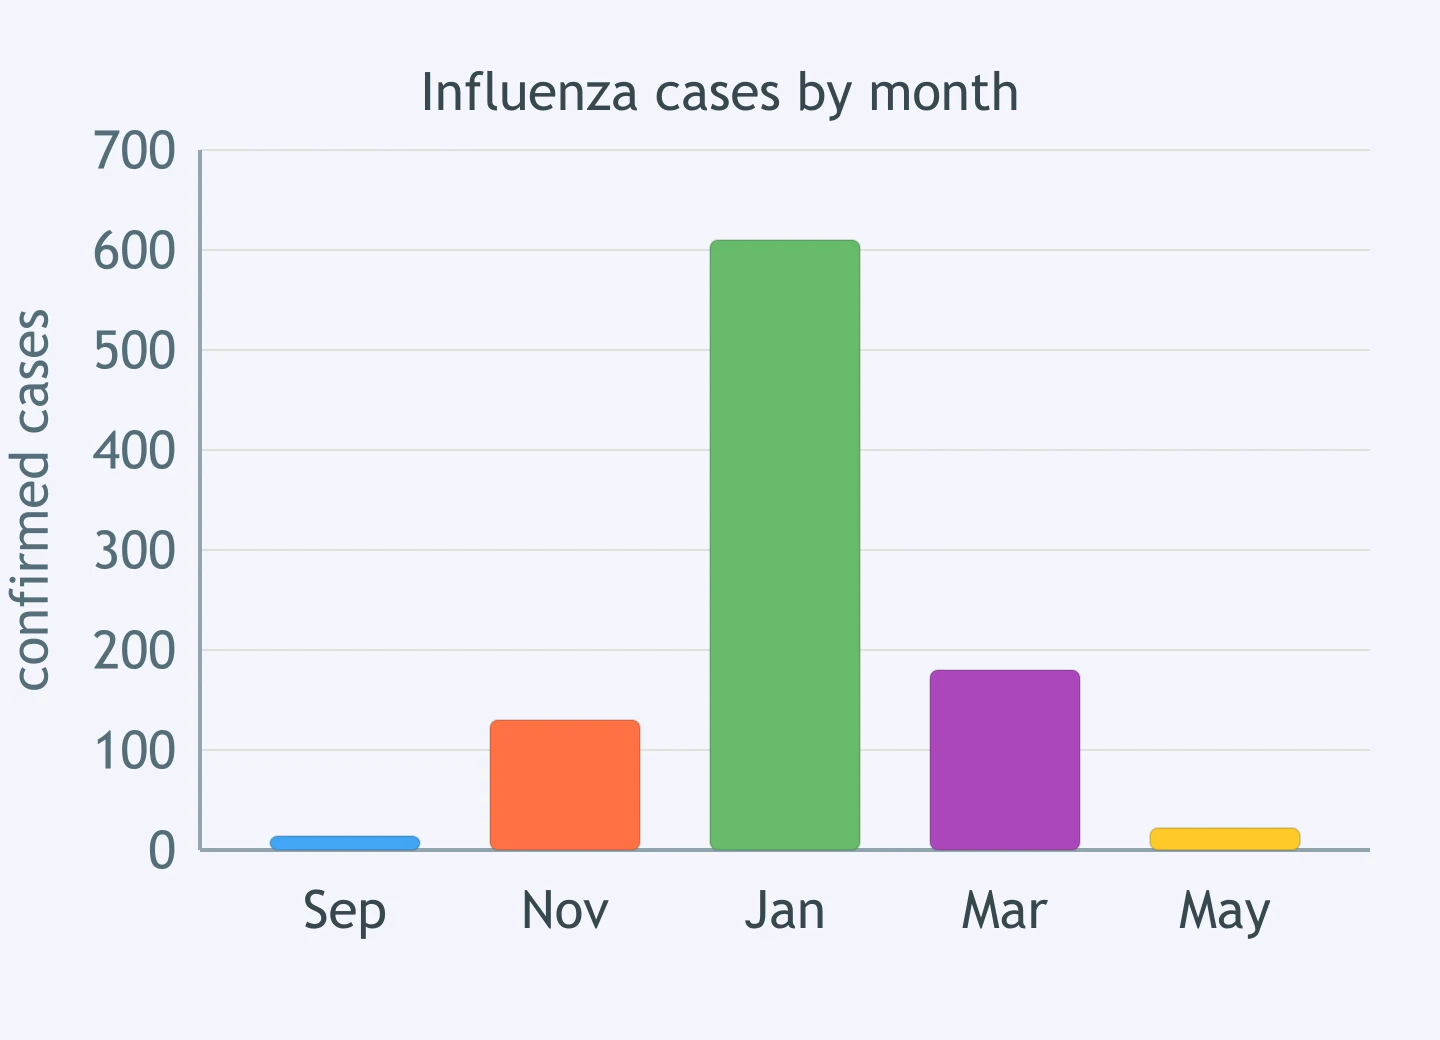
Two towns report new cases of the same disease over four weeks. Town A reports 4, then 8, then 16, then 32. Town B reports 20, then 26, then 31, then 35. Which statement does the data support?
If reported cases fall in the weeks after a control measure begins, that timing on its own proves the measure caused the fall.
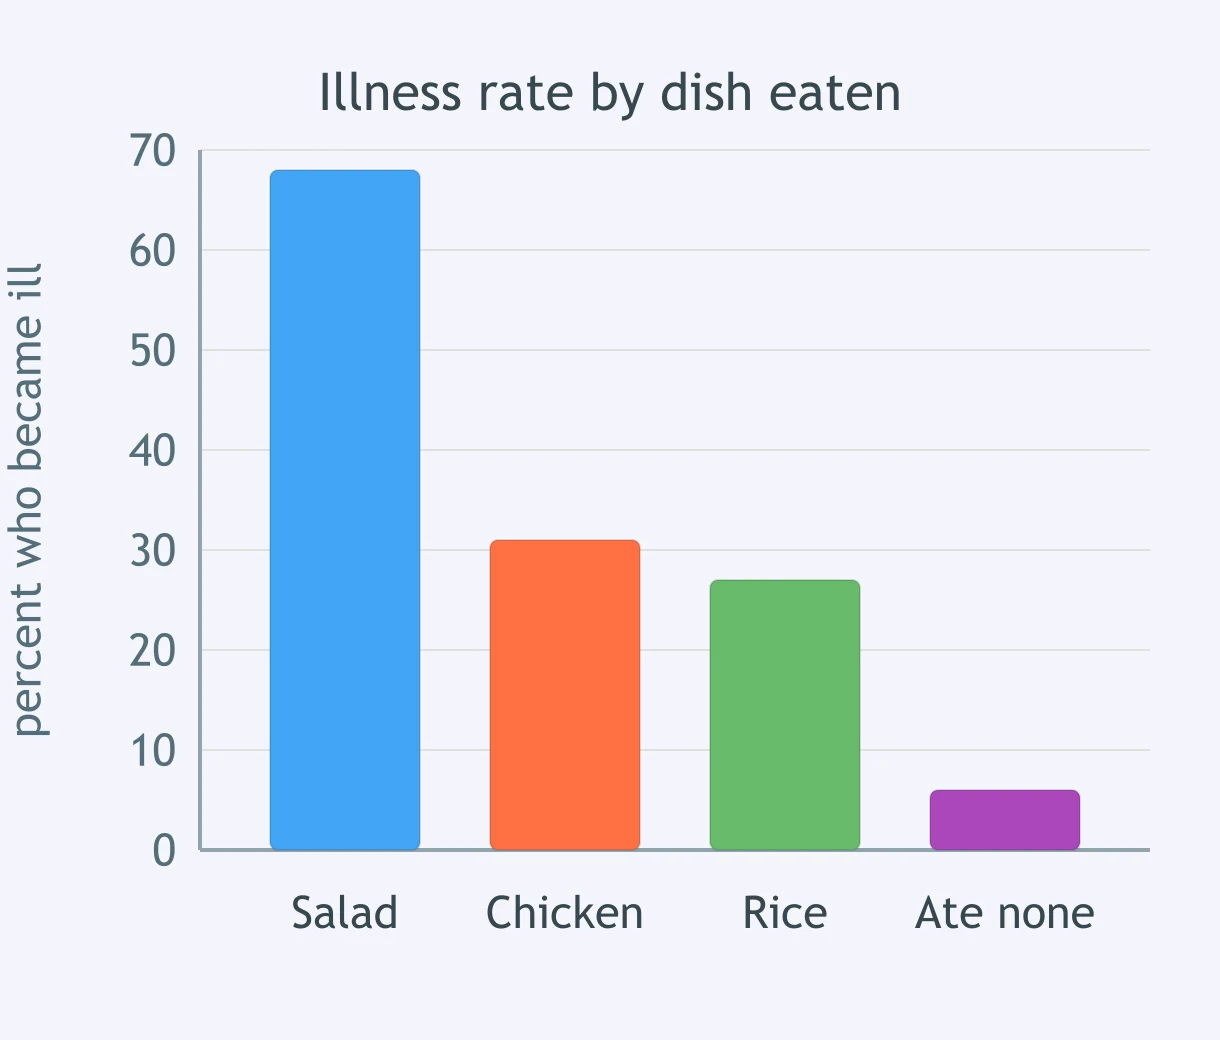
Of 210 people at a banquet, 96 became ill within 30 hours. The graph shows the percentage who became ill among those who ate each dish, and among those who ate none of them. Which conclusion does the data best support?
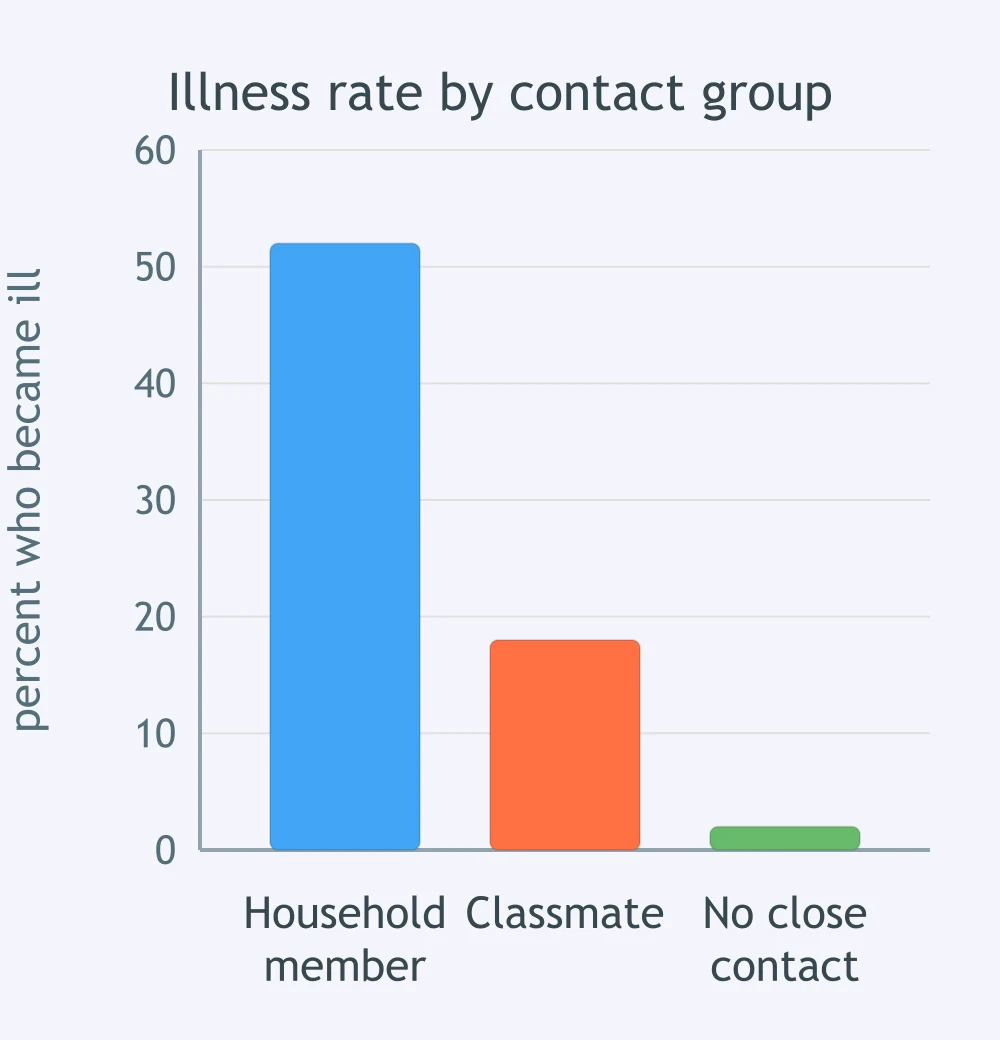
After one case of a respiratory illness was found, public health workers recorded how many people in each contact group later became ill. Which transmission route does the graph best support?
A town has two water supplies. Of 400 people served by the north well, 88 developed severe watery diarrhea in one week; of 350 served by the south well, 5 did. Cases hit every age group and unrelated households. What does the data indicate?
In a rural district, 61 of 300 people who work outdoors at dusk developed fever; 3 of 290 who work indoors did. Cases were scattered among unrelated households, with no shared meal and no ill household members who stayed indoors. What does this support?
A measles patient spent 2 hours in a clinic waiting room. Of 44 unvaccinated people there at the time, 30 fell ill, some who stayed 3 meters away throughout. Of 51 who entered within the hour after he left, 9 fell ill. What does this support?
A patient has fever and aching muscles. Swabs grow nothing on bacterial culture plates after 48 hours, antibiotics change nothing, and electron microscopy of the sample shows particles about 100 nanometers across with a protein coat. Which pathogen fits?
A student has an itchy ring-shaped rash on one arm. A skin scraping under the microscope shows branching threadlike hyphae. A week of antibiotic tablets changes nothing. Which type of pathogen is this?
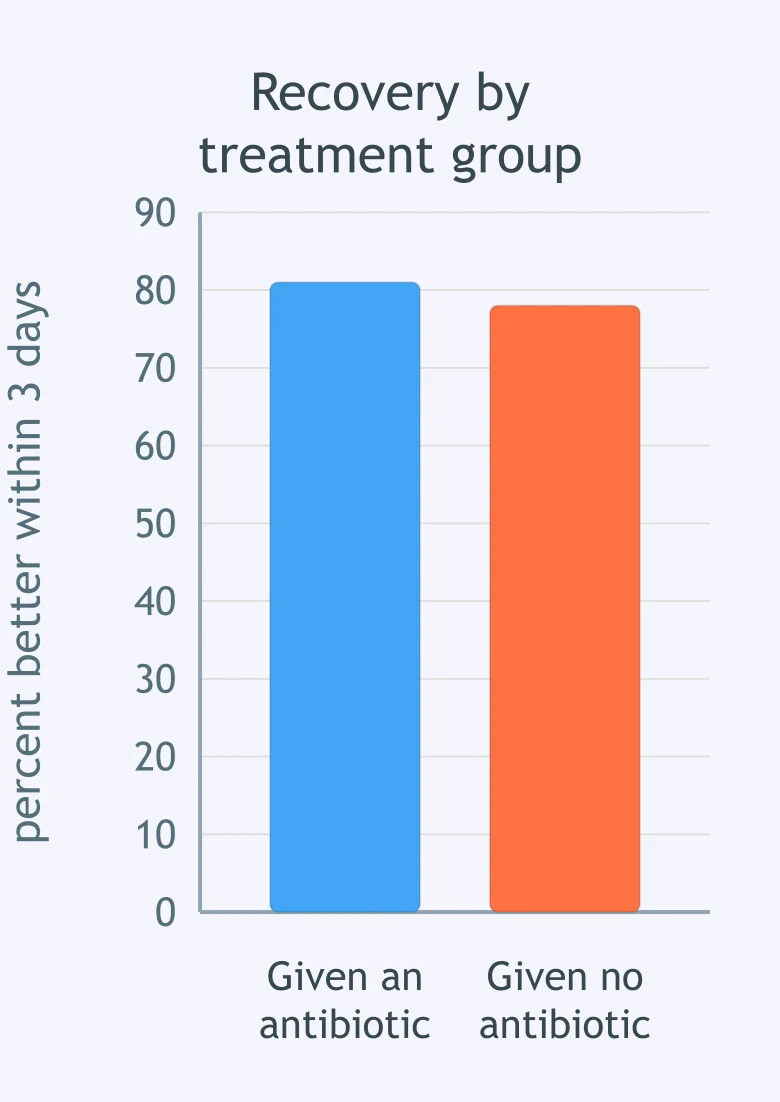
Ninety students had sore throat, runny nose and cough, and throat swabs from all of them grew no bacteria. Half were given an antibiotic and half were not. The graph shows how many in each group were better within three days. What do the results support?
A traveler has fever and chills returning every 48 hours. A blood smear shows single-celled organisms with nuclei inside her red blood cells. Antibiotics do not help, but an antimalarial drug does. Which type of pathogen is this?
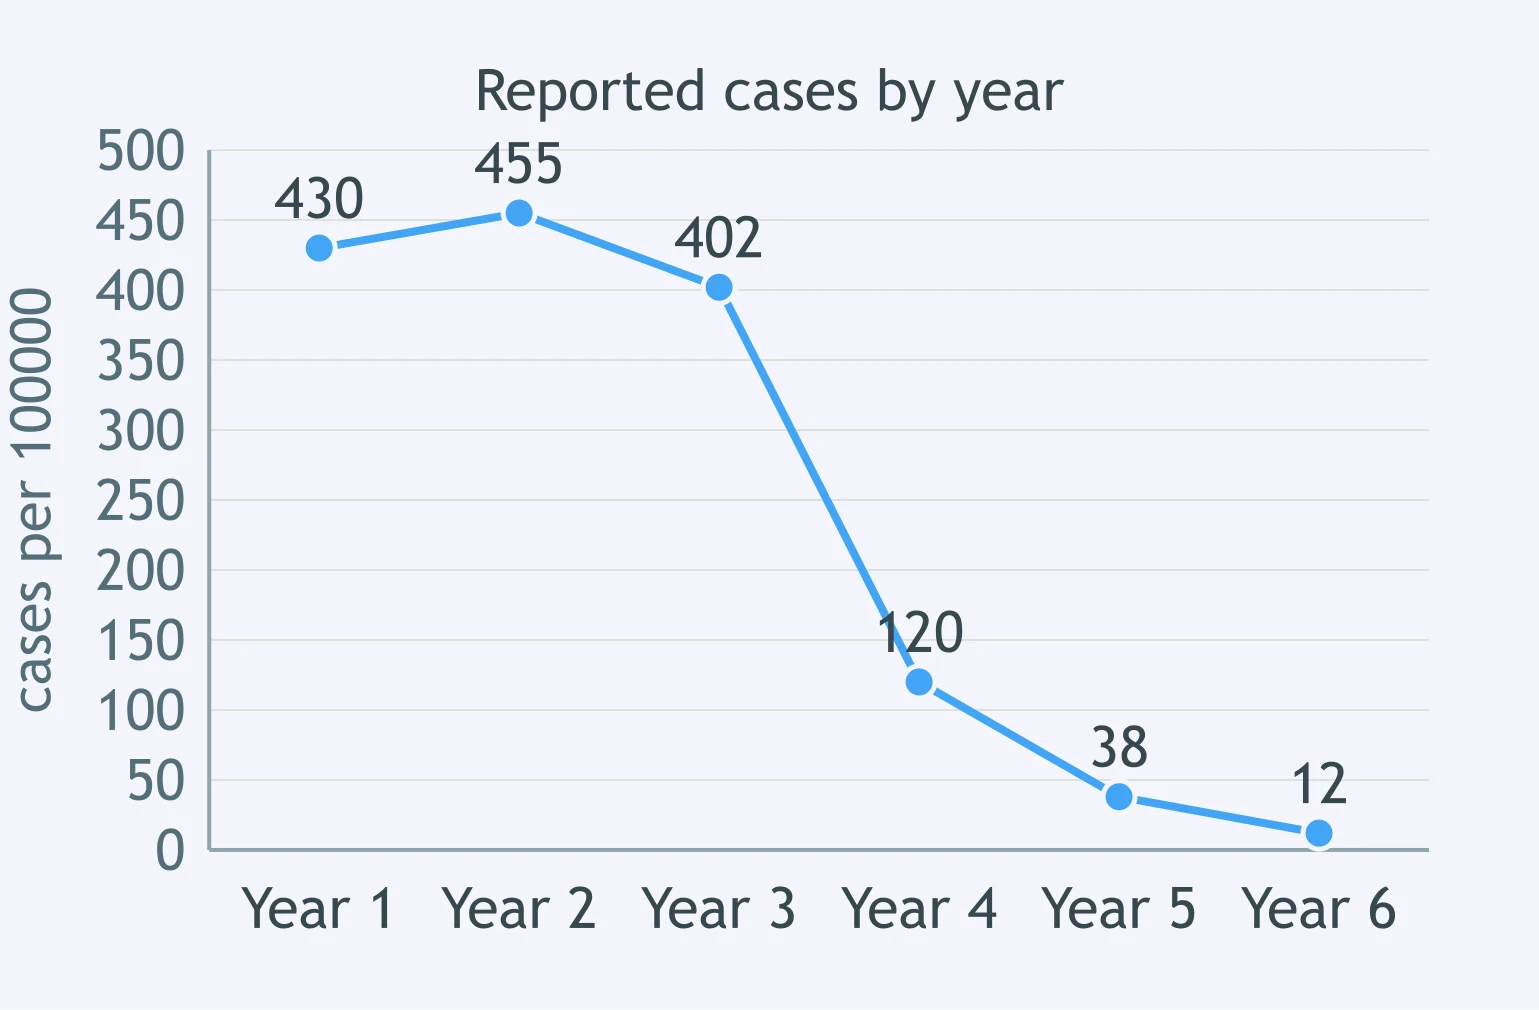
The graph shows reported cases of a childhood disease per 100,000 people in one country. A national vaccination program began at the start of year 4 and reached 90% coverage within two years. What does the data best support?
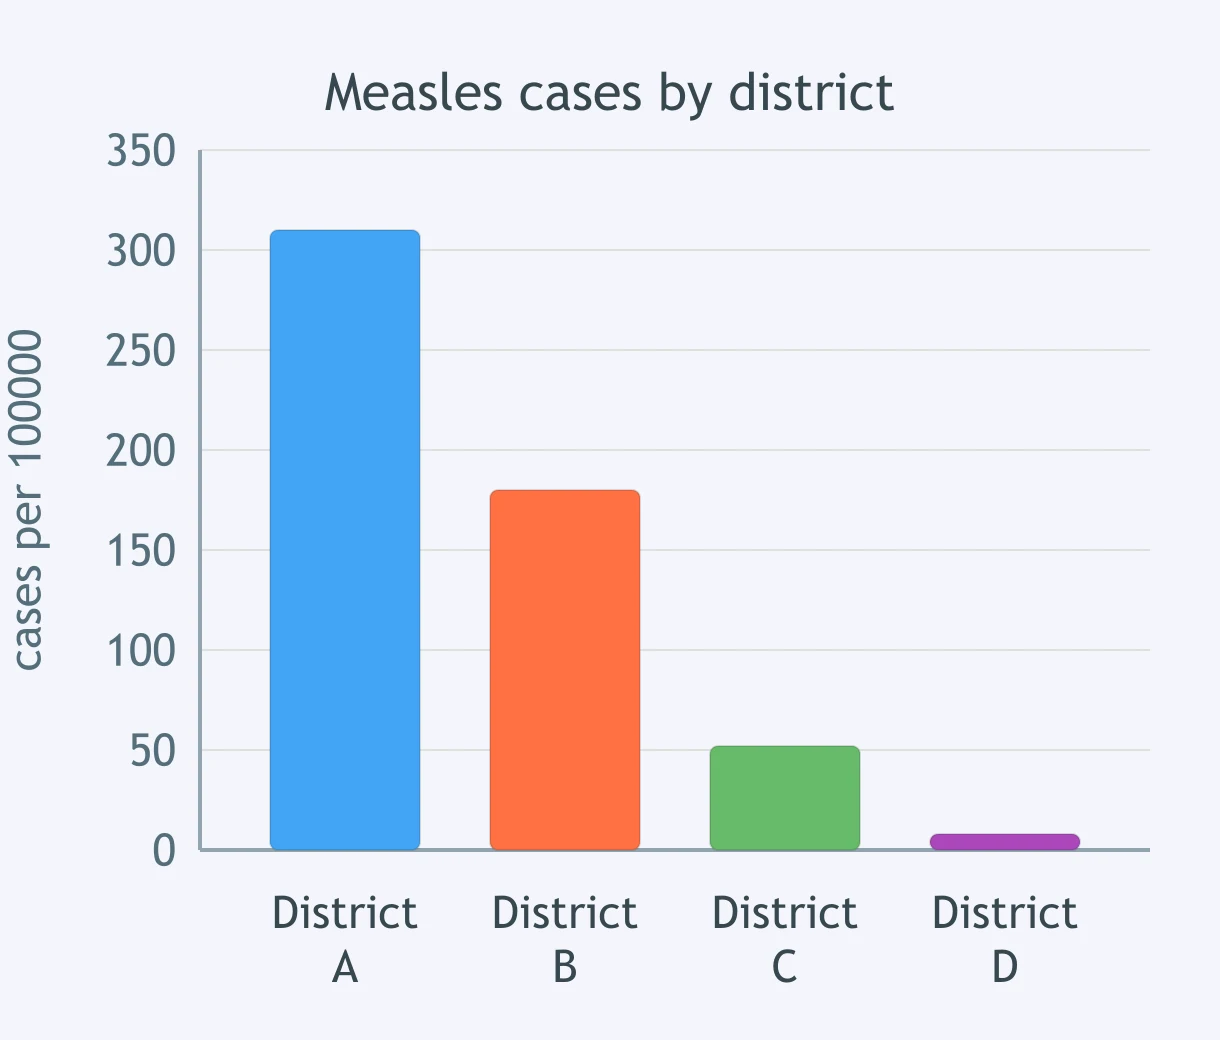
Vaccination coverage last year was 41% in District A, 62% in District B, 79% in District C and 94% in District D. The graph shows measles cases per 100,000 people in each district over the same year. What does the data best support?
A hospital put alcohol hand rub at every bedside. Infections caught in hospital fell from 6.4 to 2.1 per 1,000 patient-days in a year. At a similar hospital with no program the rate went from 6.1 to 5.9. What do the figures best support?
A vaccination program can lower the number of cases among people in the same community who are not themselves vaccinated.
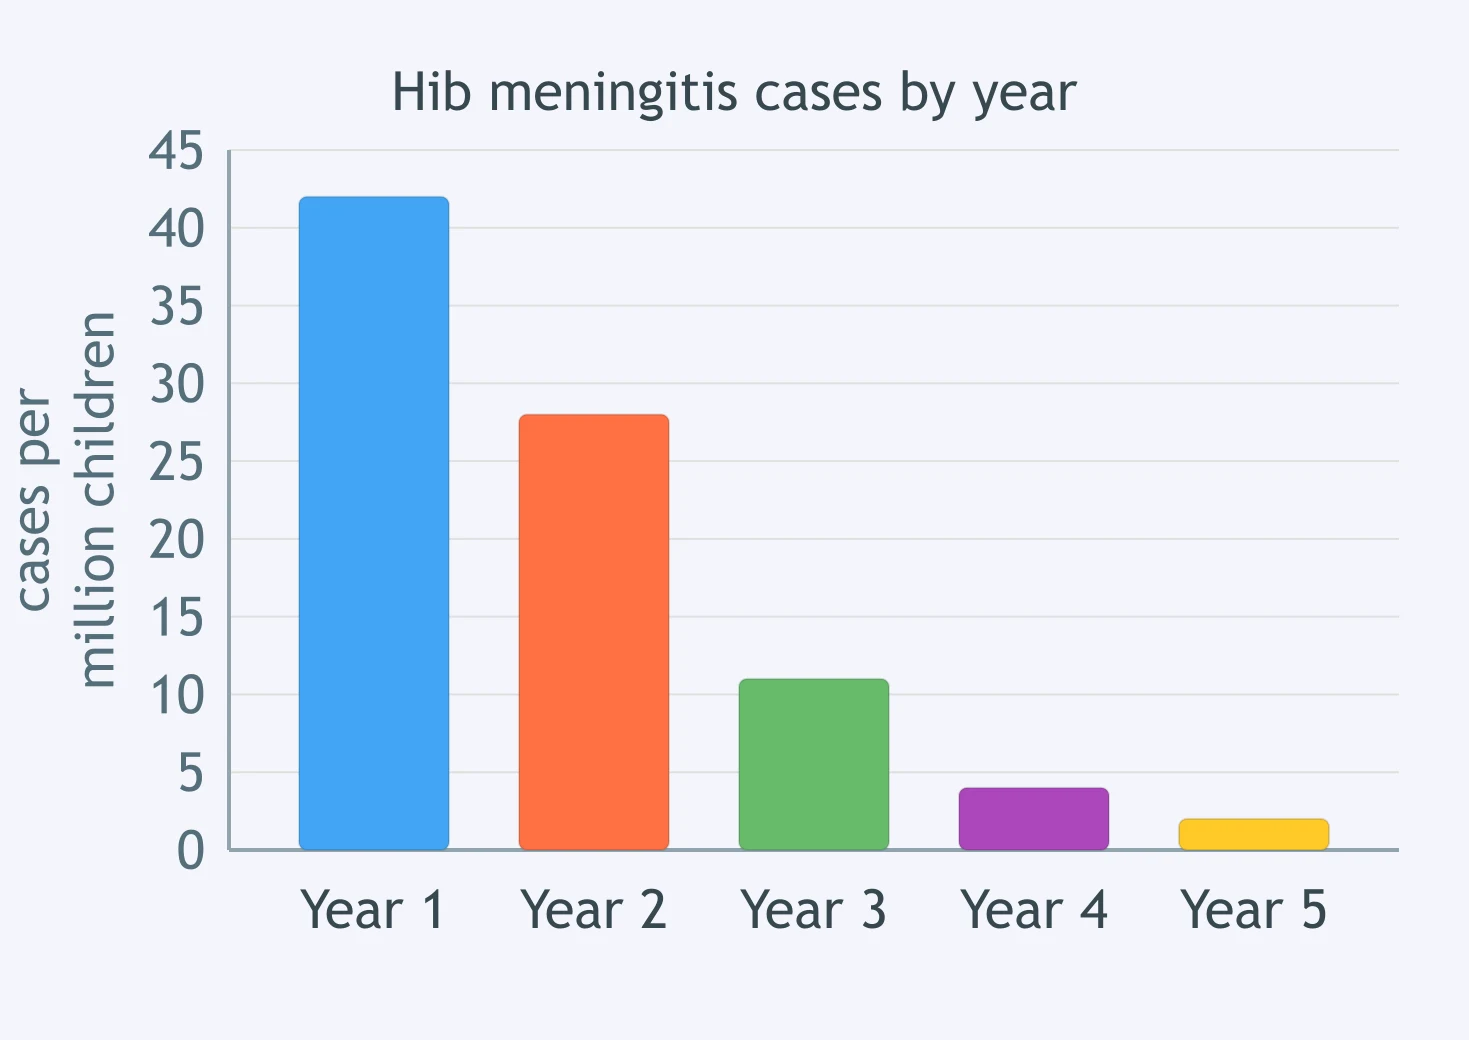
A vaccine against the bacterium Haemophilus influenzae type b was added to the routine infant schedule at the start of year 1. The graph shows cases of Hib meningitis in young children. Which conclusion does the data support?
Crack the passcode before the zombies get in.
Answer, then swat bugs for bonus points.
Race through questions at your own speed.
Same question on every screen. Fastest wins.

Pick a tile, answer, hit bonuses and steals.
40 questions