Loading
by BlastRoom
Students read tables and graphs to compare values, find patterns, and spot odd data.
#data#us_grade_4_science

20 questions
One question set, multiple game modes. Tap any game to see it in action. Not sure which to pick?
Answer to place stones and capture territory.
Outrun the snow together.
Earn blasts, then hunt the other team.
Answer to earn energy, then climb.

The class blasts through walls together.
Bid on mystery lots. Most money wins.
Sell tours. Nice, standard, or a total scam.

Answer, restock, and serve the rush.
More correct answers pulls the rope your way.
Answer, then shoot down the alien wave.
Answer, then tap to leap the frozen ridge.
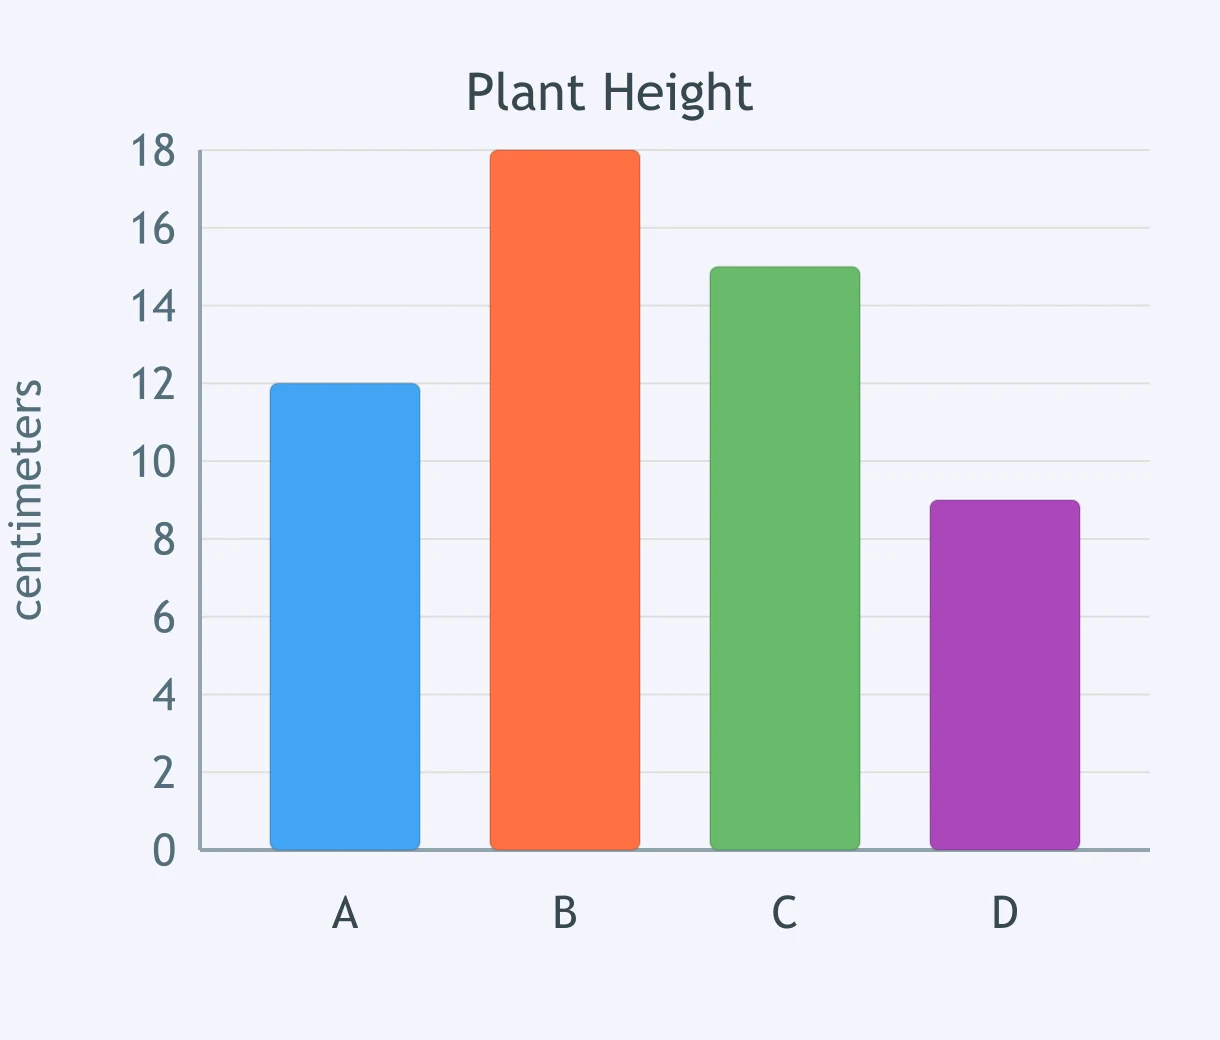
Use the bar graph of plant heights for Groups A-D. How many centimeters taller is Group B's plant than Group D's plant?
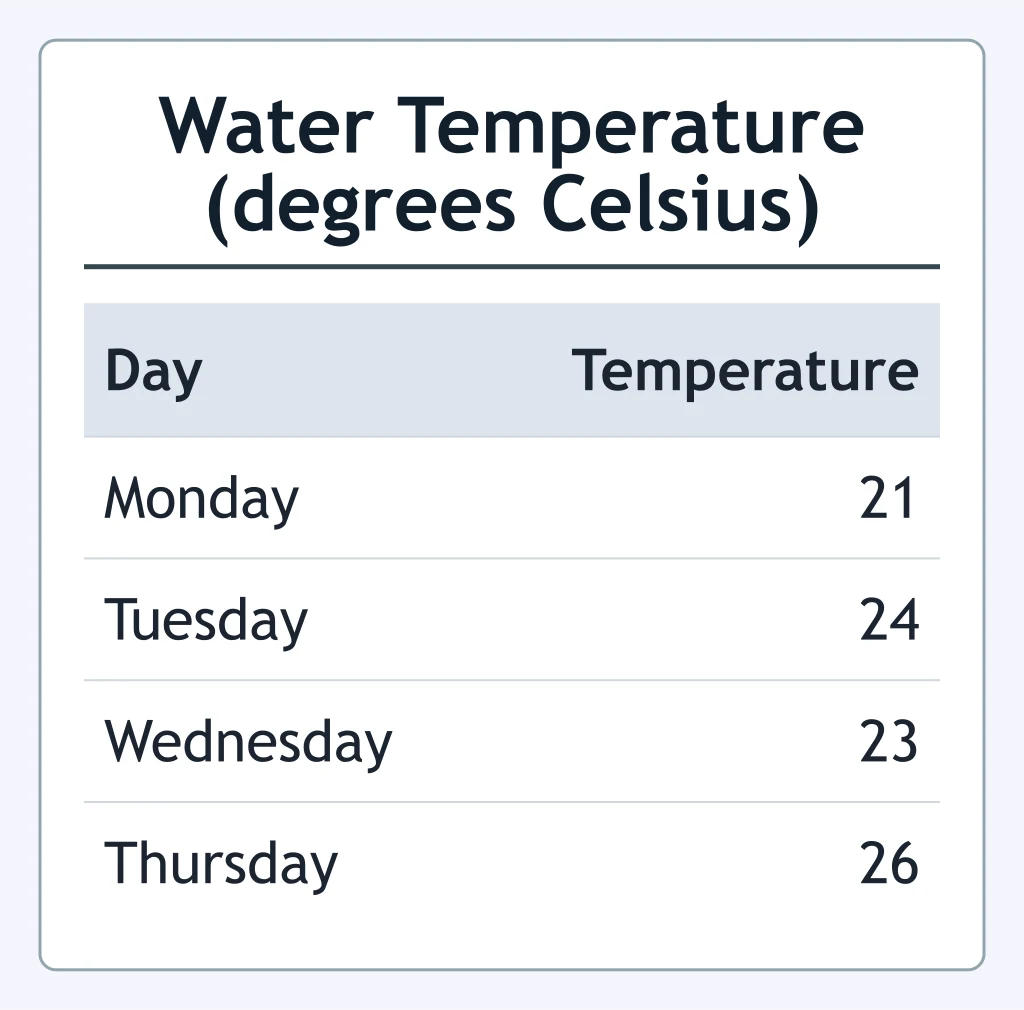
Use the data table of water temperature readings for Monday-Thursday. What day had the highest temperature?
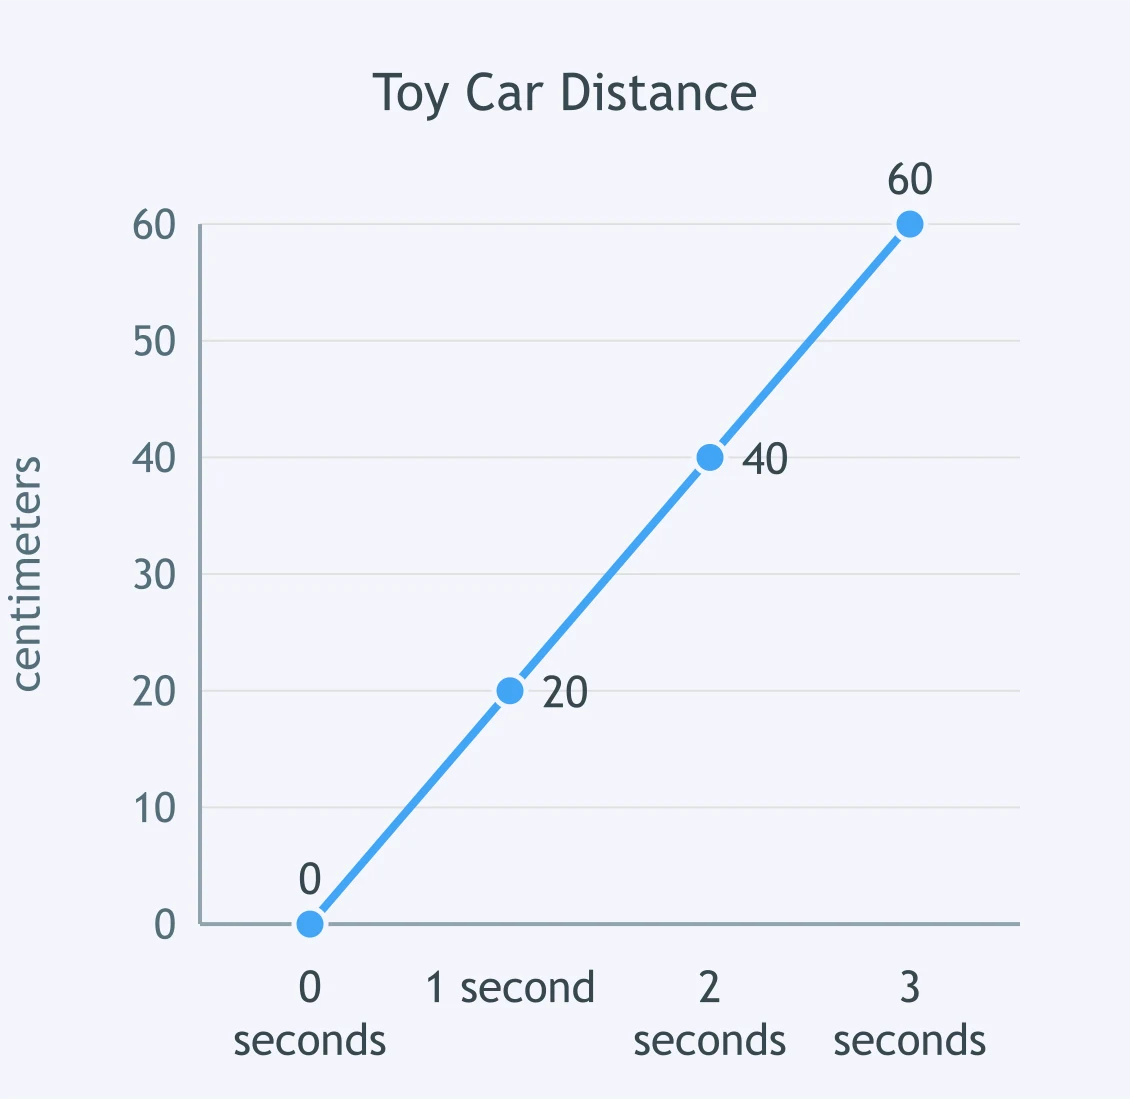
Use the line graph of a toy car's distance over 3 seconds. What distance is shown at 2 seconds?
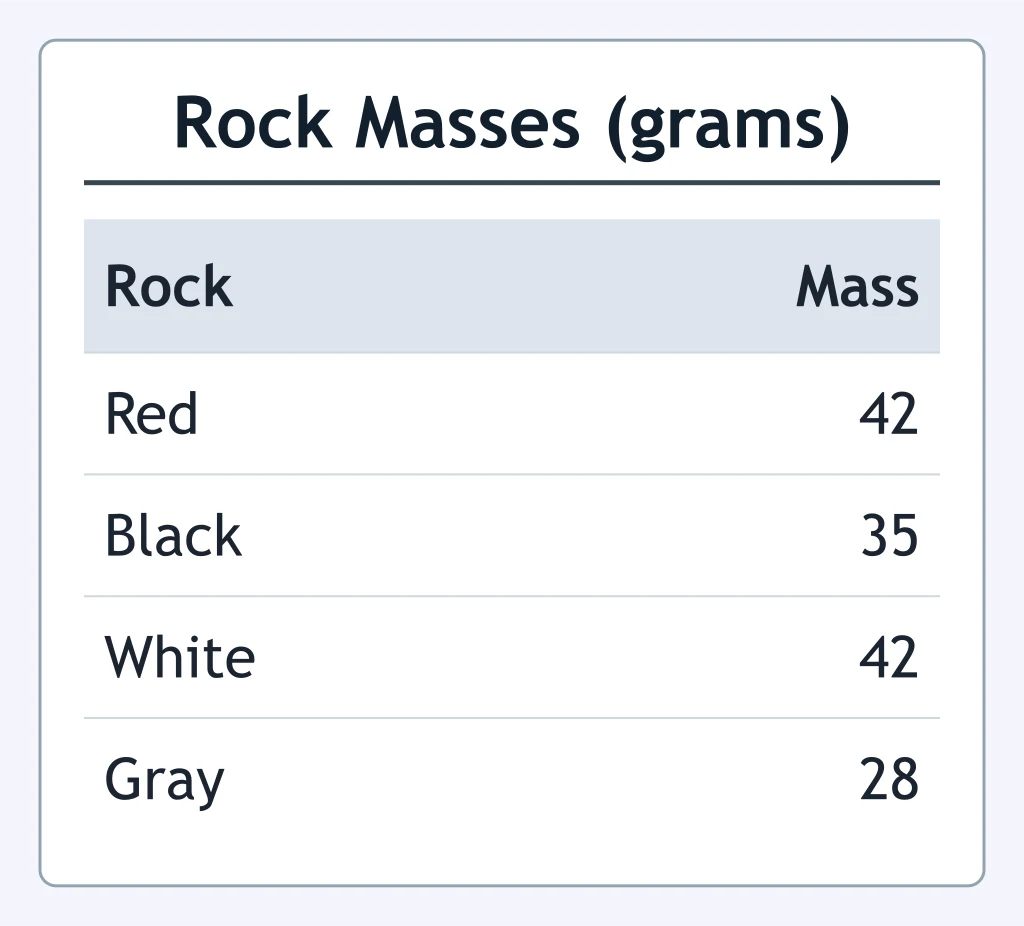
Use the data table of rock masses. What two rocks have the same mass?
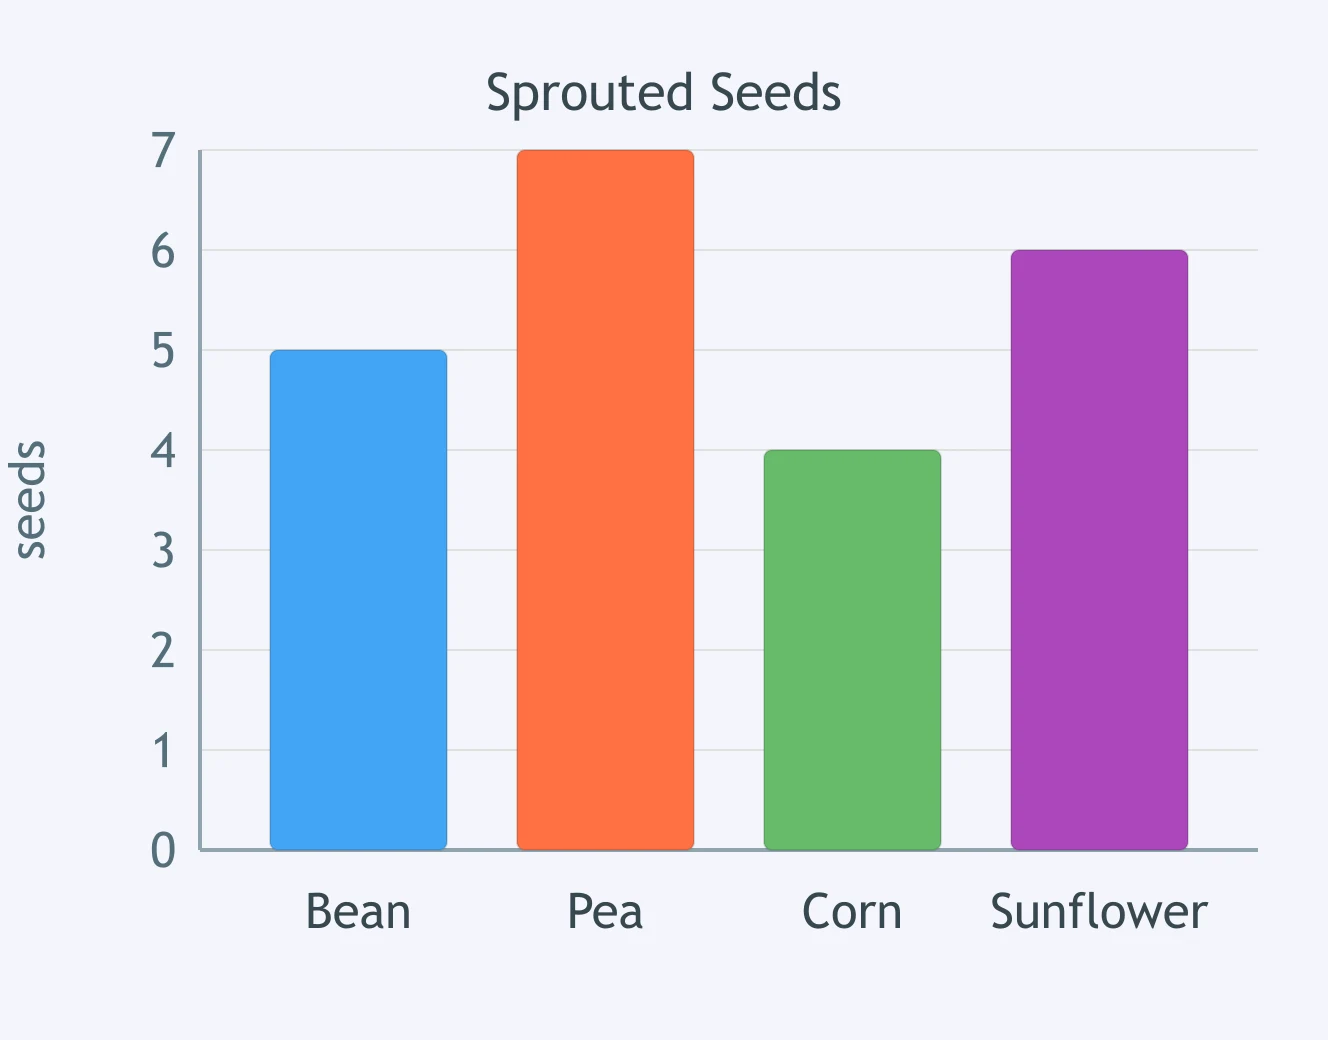
Use the bar graph of sprouted seeds. How many more pea seeds sprouted than corn seeds?
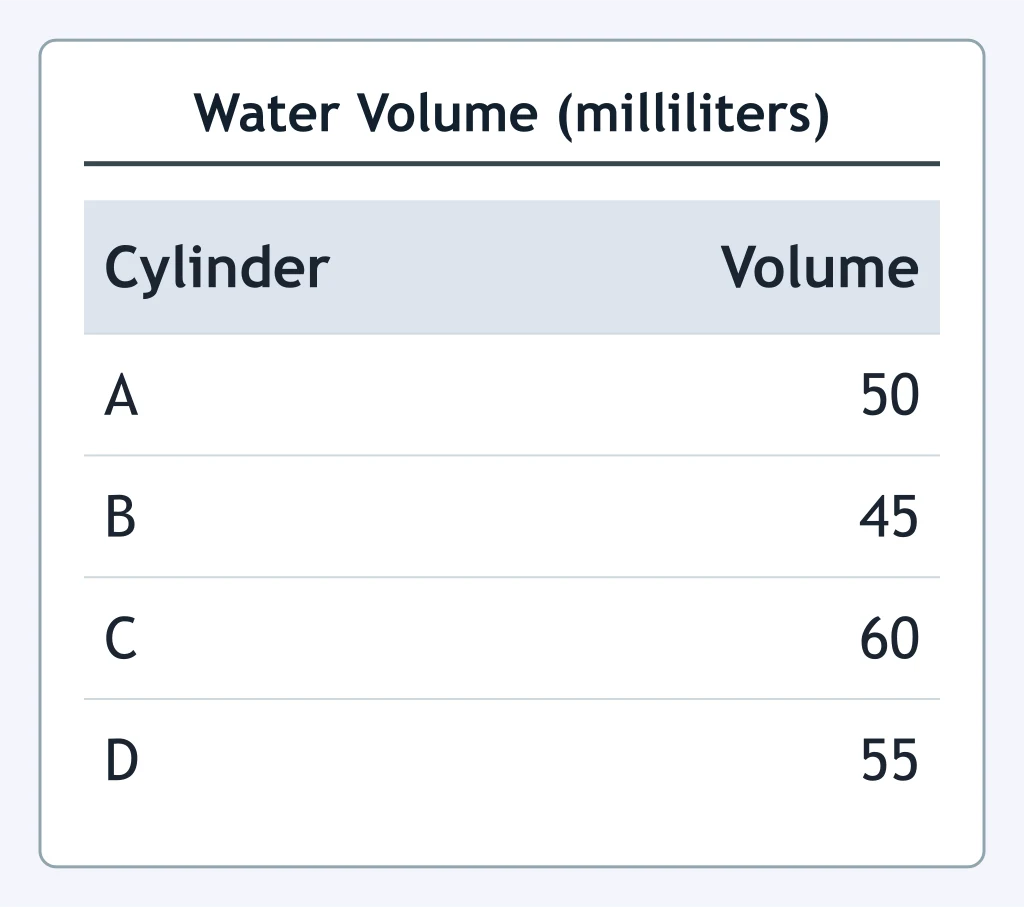
Use the data table of water in graduated cylinders. What volume is shown for Cylinder B?
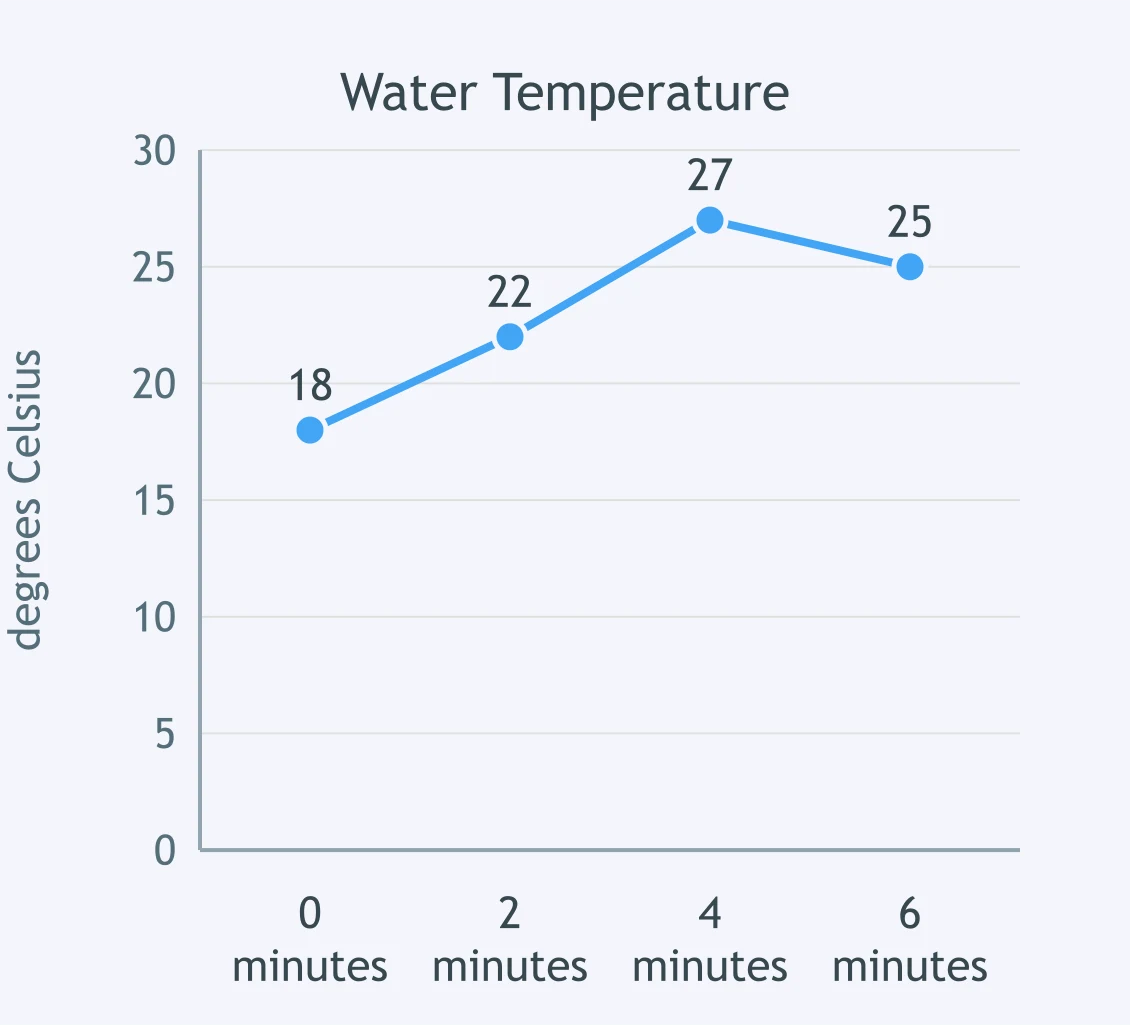
Use the line graph of water temperature during a 6-minute test. At what minute was the water warmest?
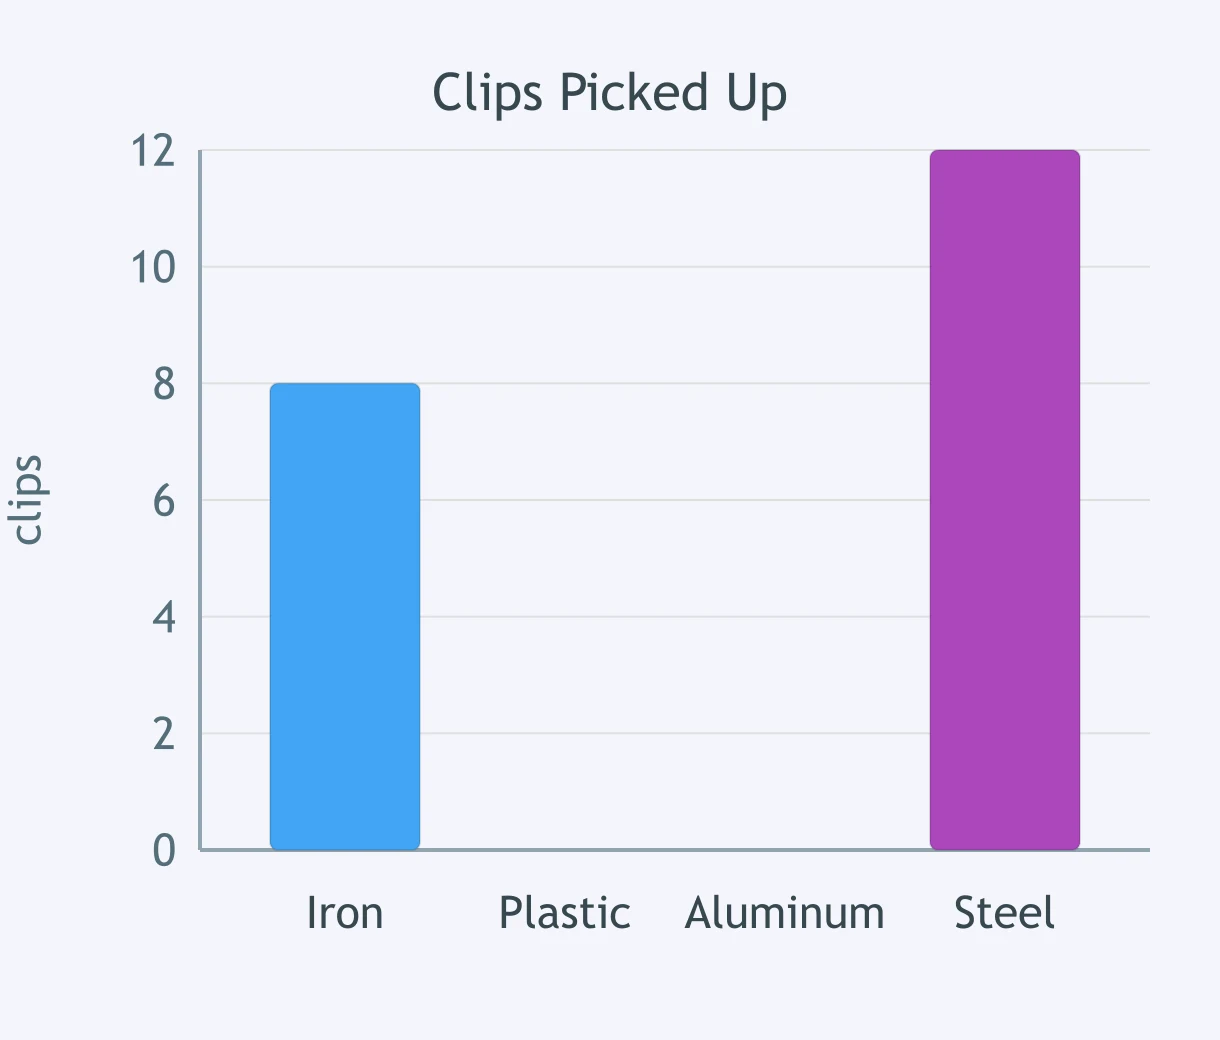
Use the bar graph showing clips picked up by each material. How many more clips did steel pick up than iron?
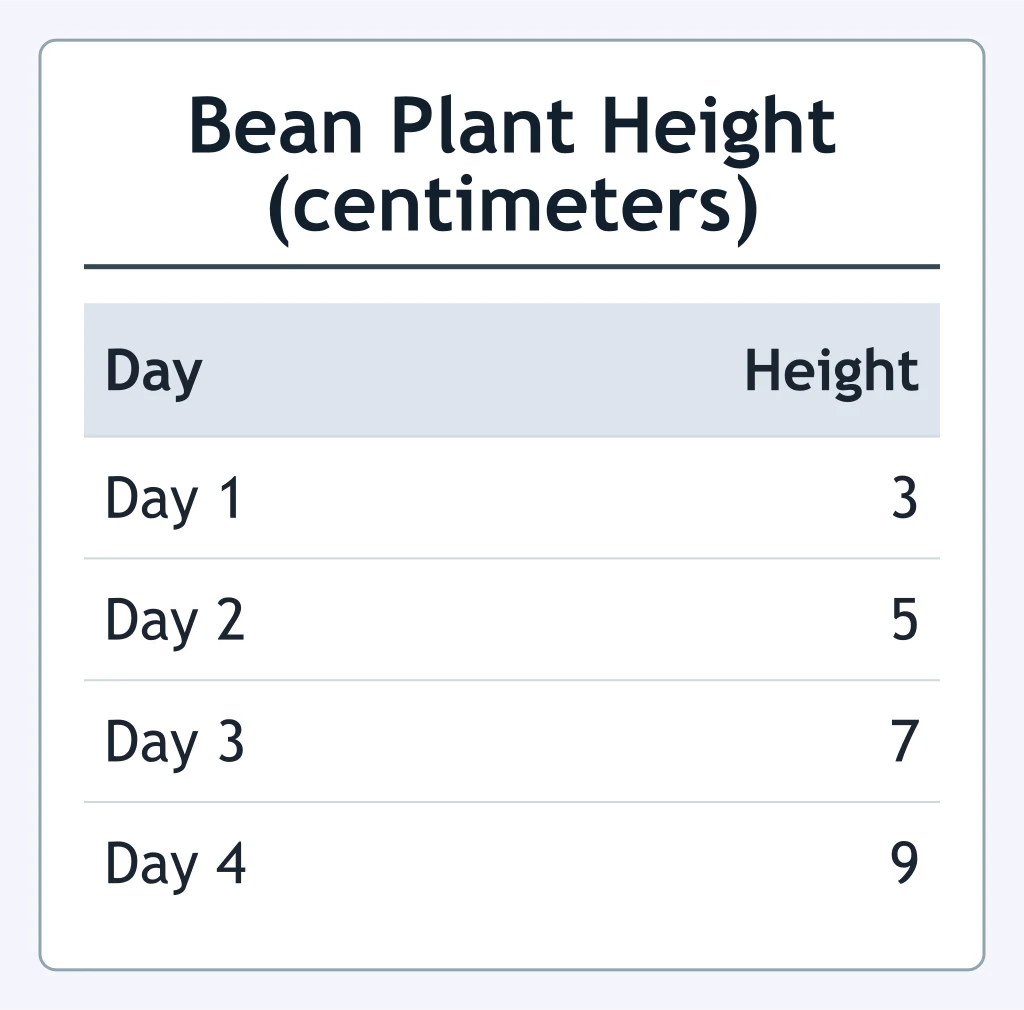
Use the data table of bean plant height over four days. What pattern does the table show?
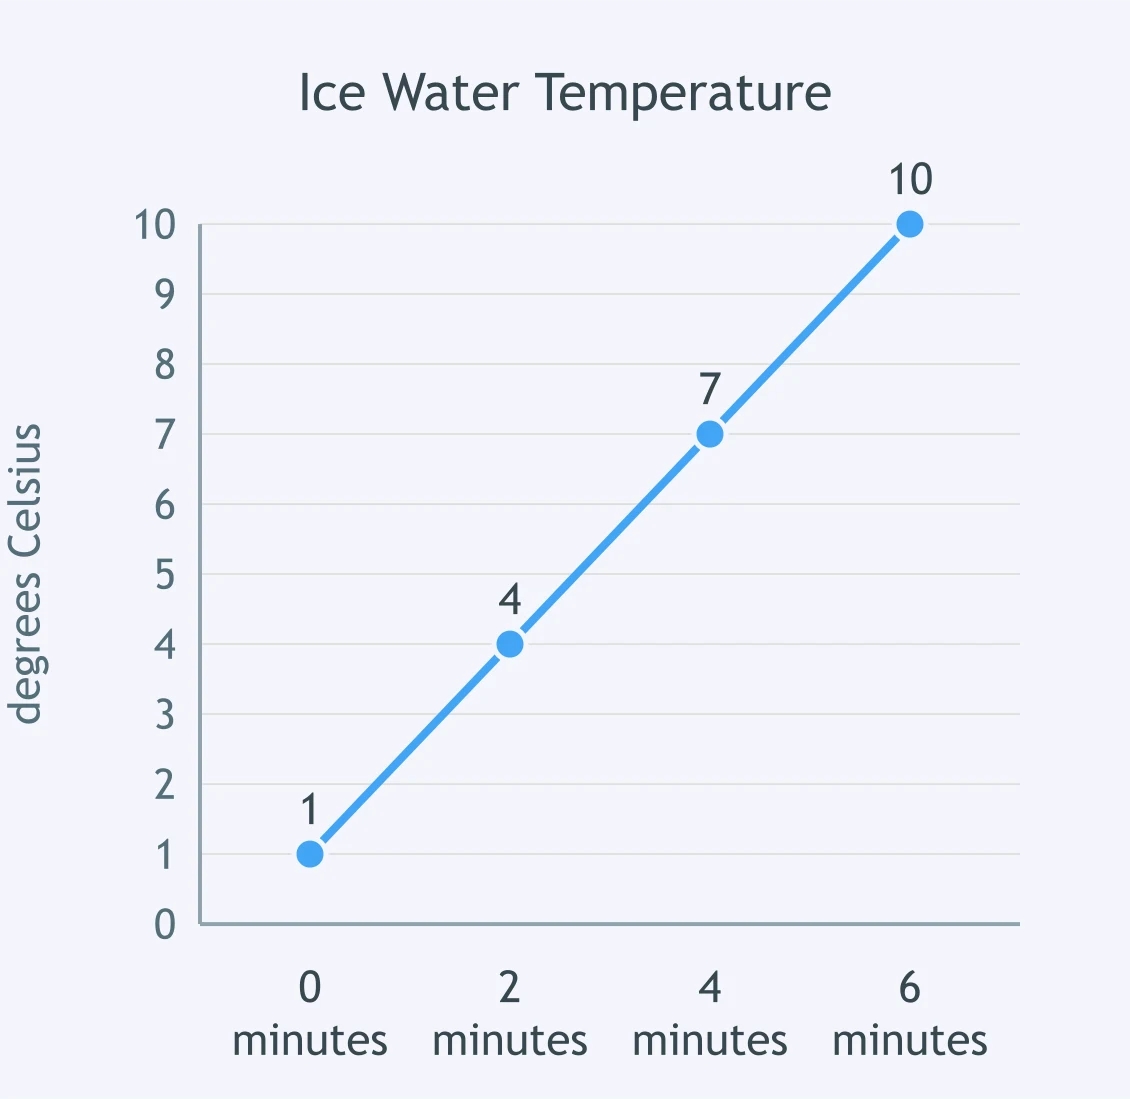
Use the line graph of ice water temperature during a test. What pattern does the graph show?
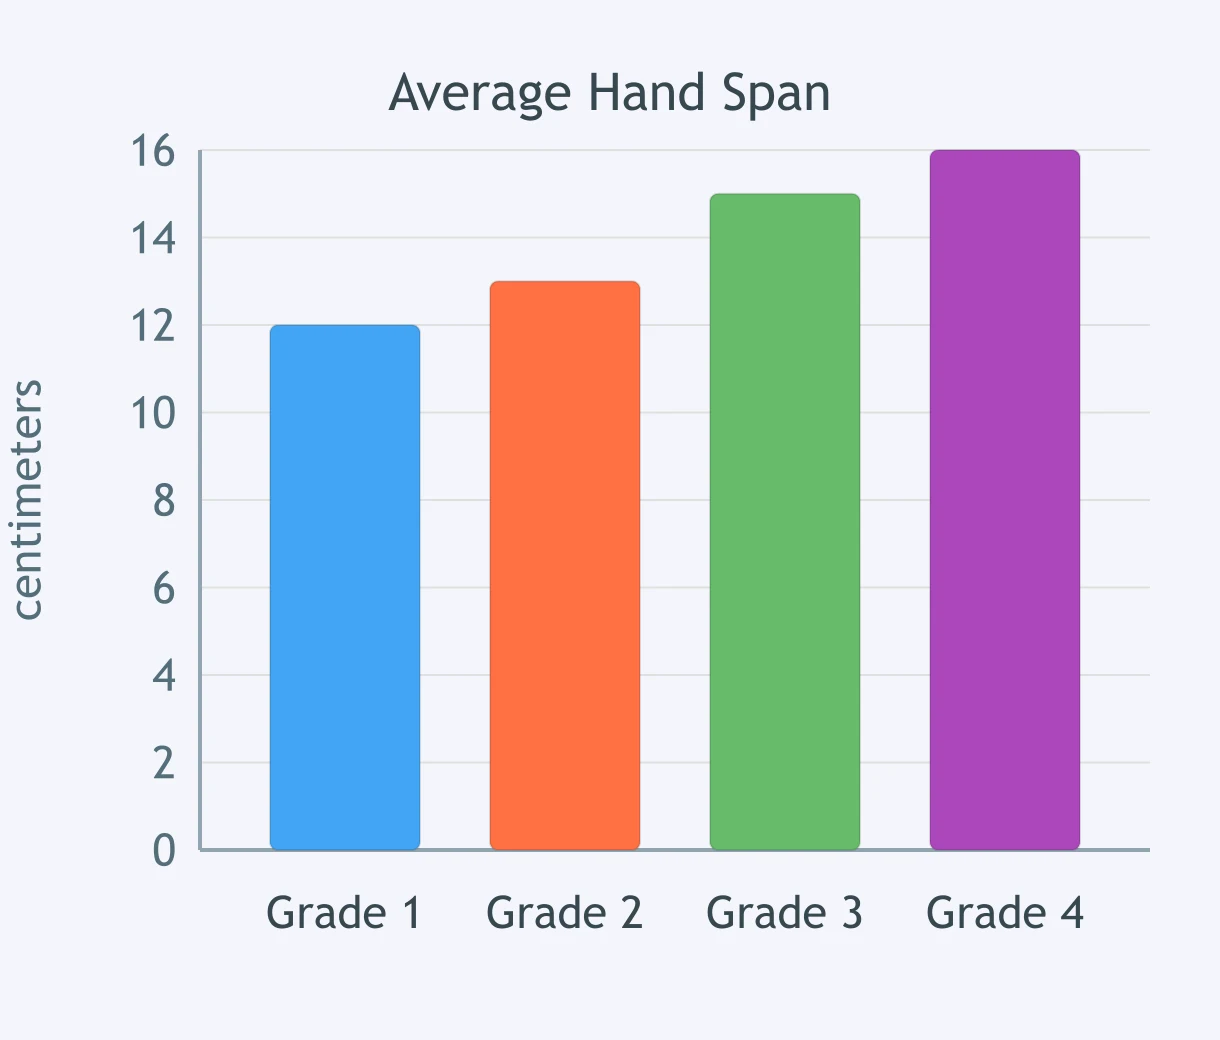
Use the bar graph of average hand span by grade level. What trend does the graph show?
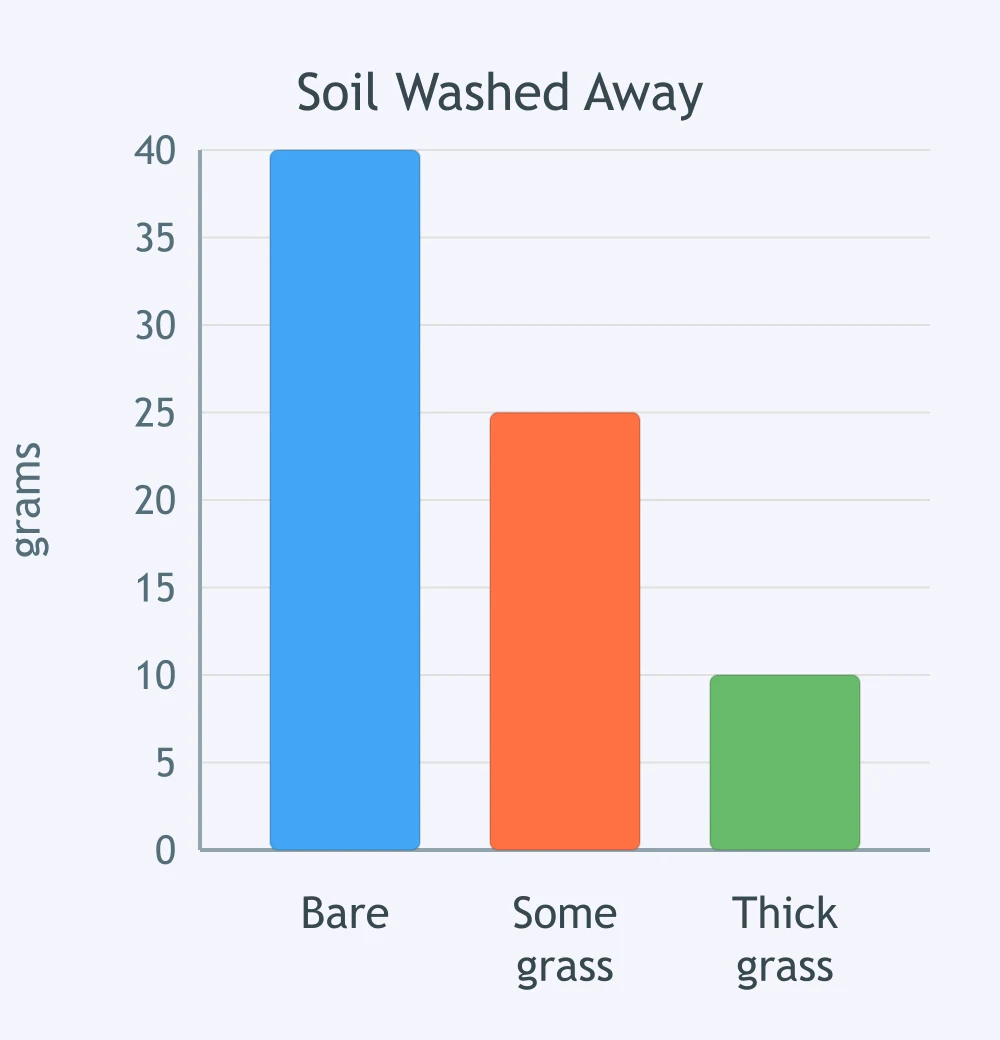
Use the bar graph of soil washed from trays with different grass cover. What pattern does the graph show?
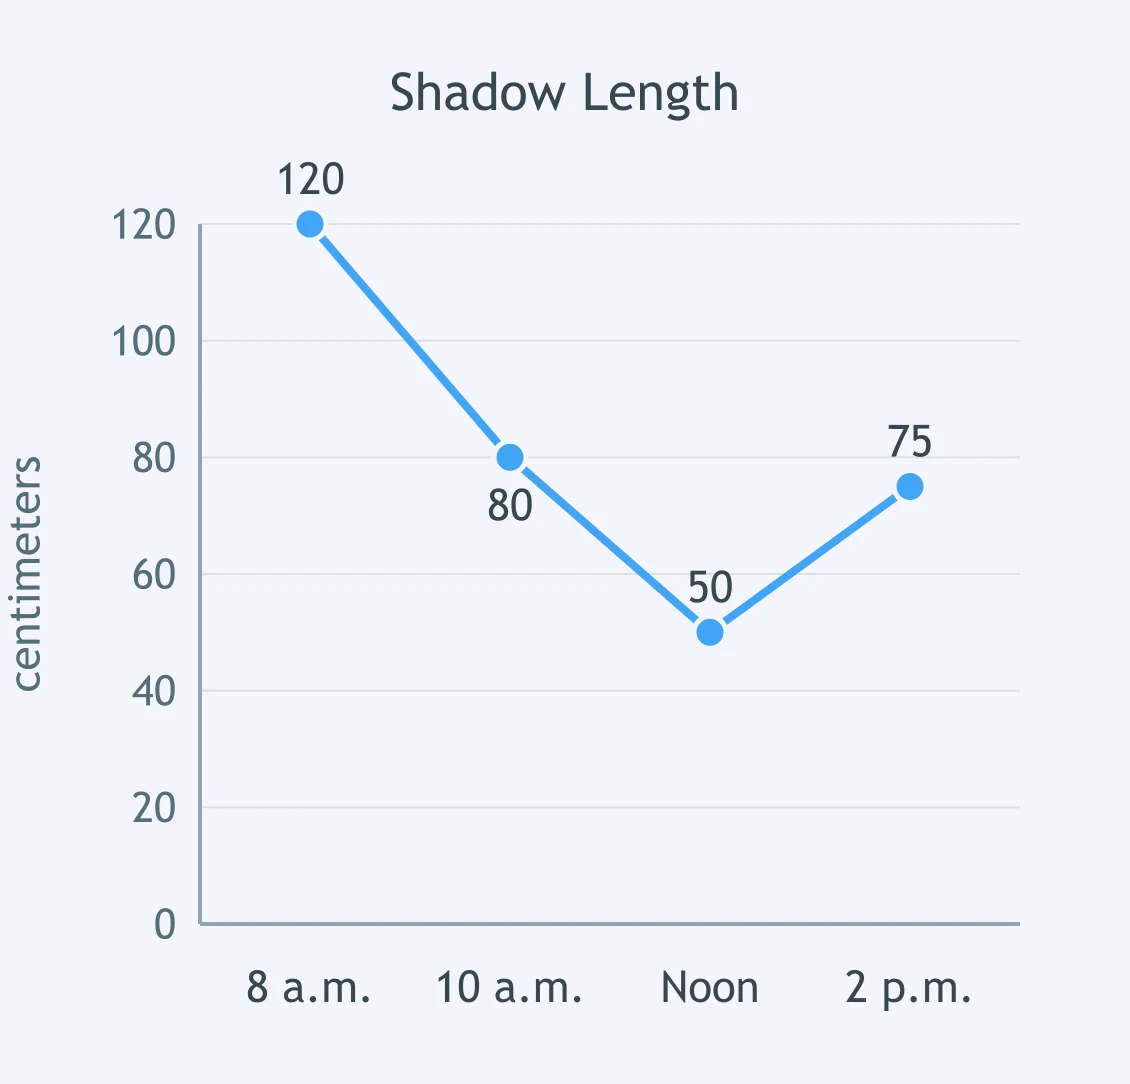
Use the line graph of shadow length through the school day. What pattern does the graph show?
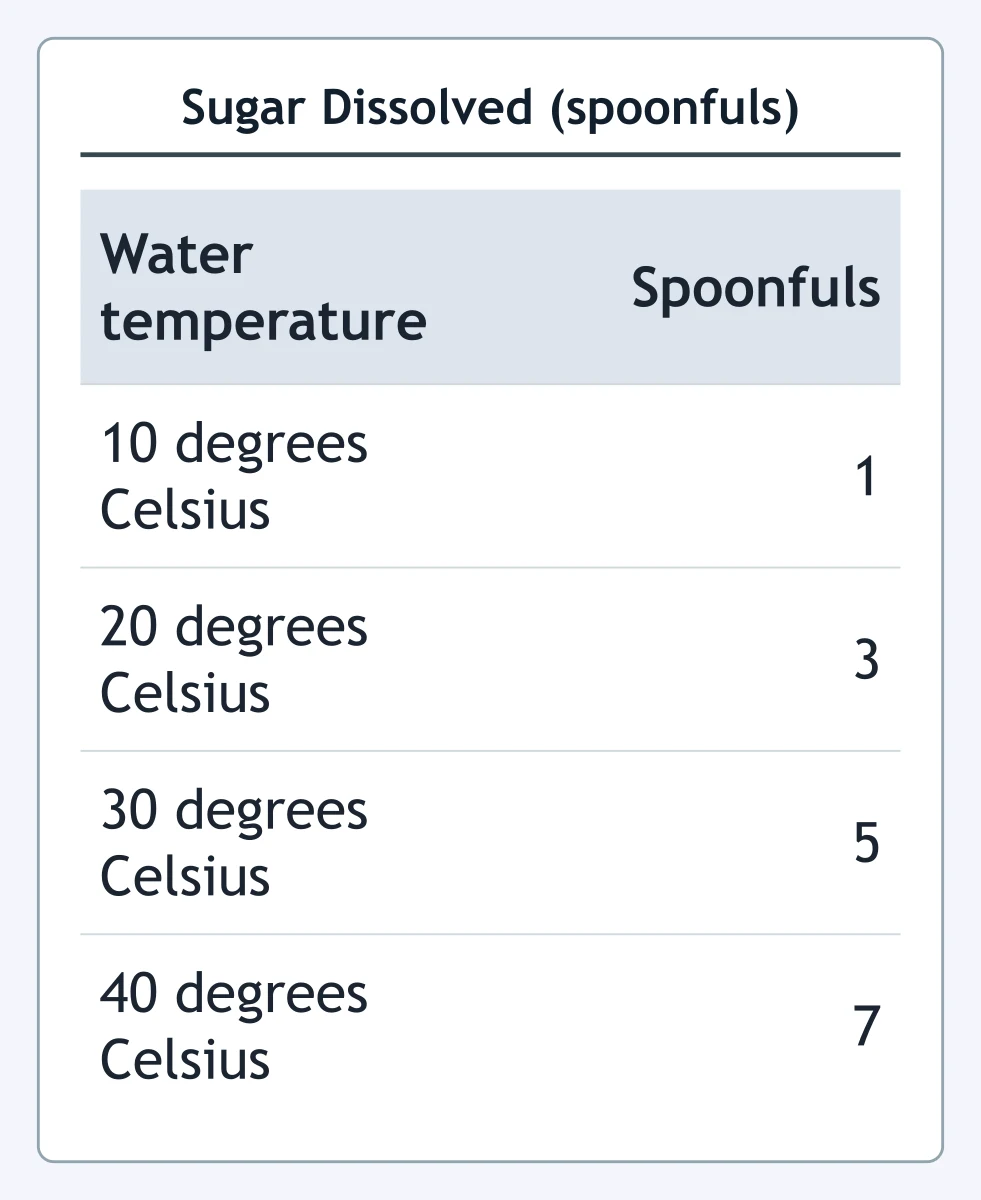
Use the data table of sugar dissolved at different water temperatures. What pattern does the table show?
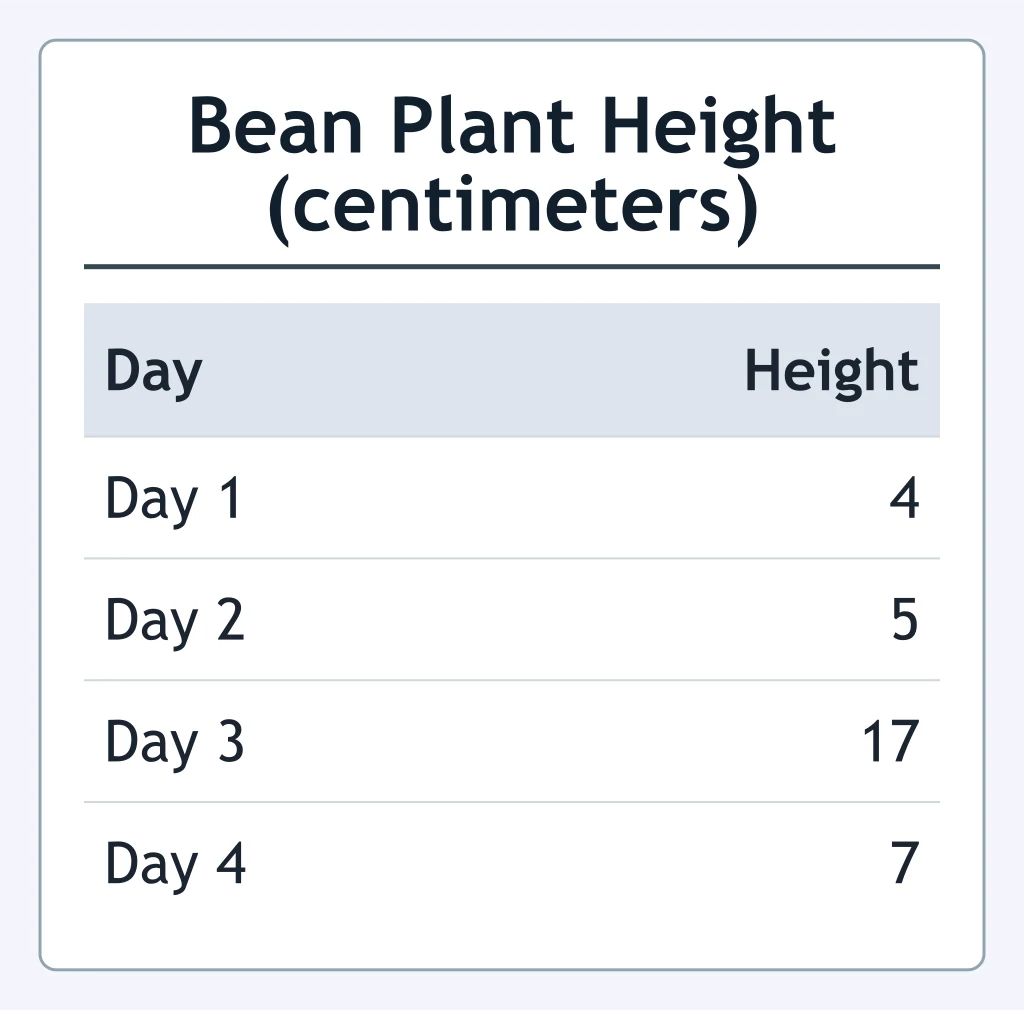
A bean plant was measured each day. Use the data table. What measurement should be repeated because it does not fit the pattern?
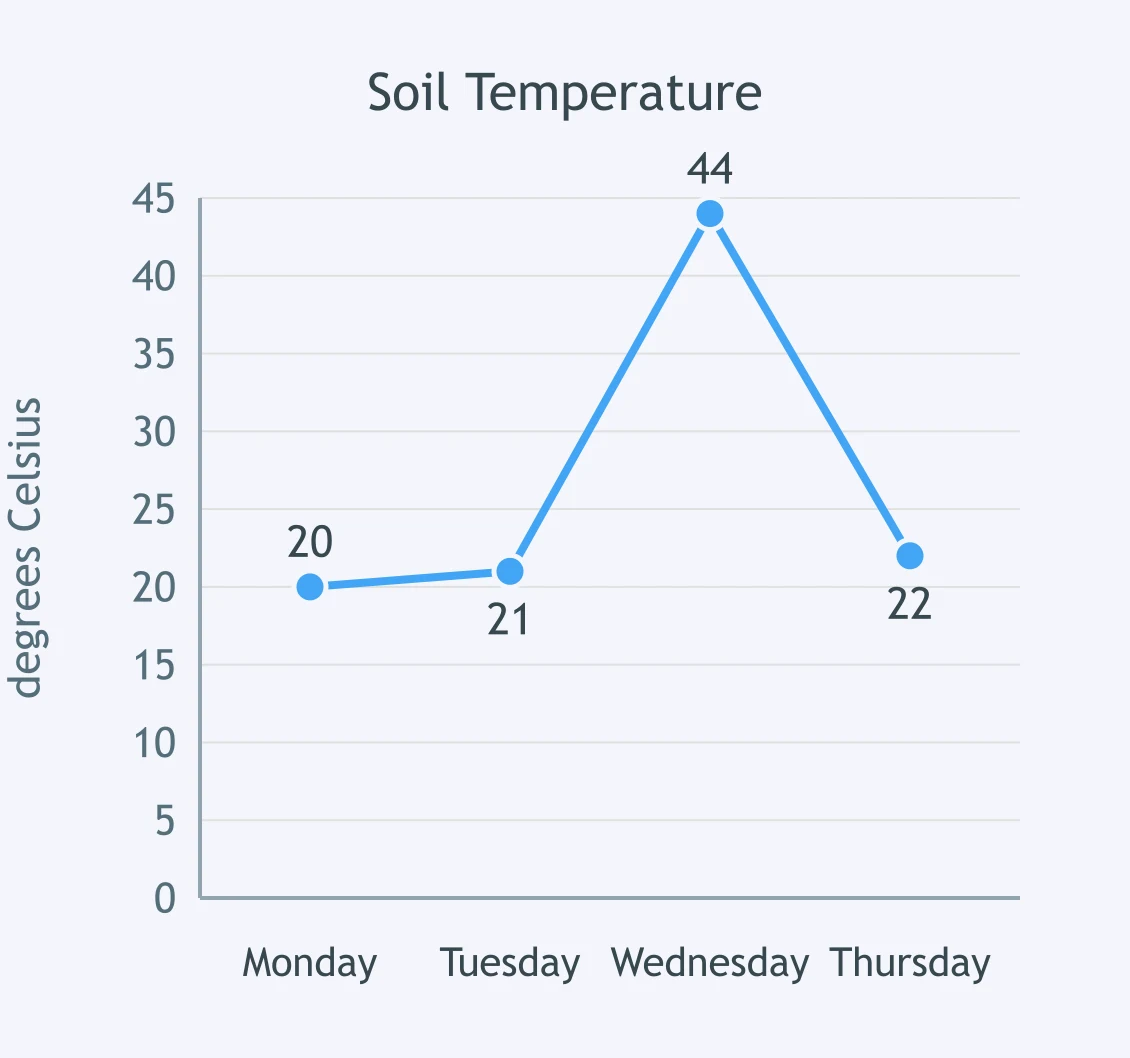
Use the line graph of soil temperature readings from the same cup. What reading is the odd value, and what might explain it?
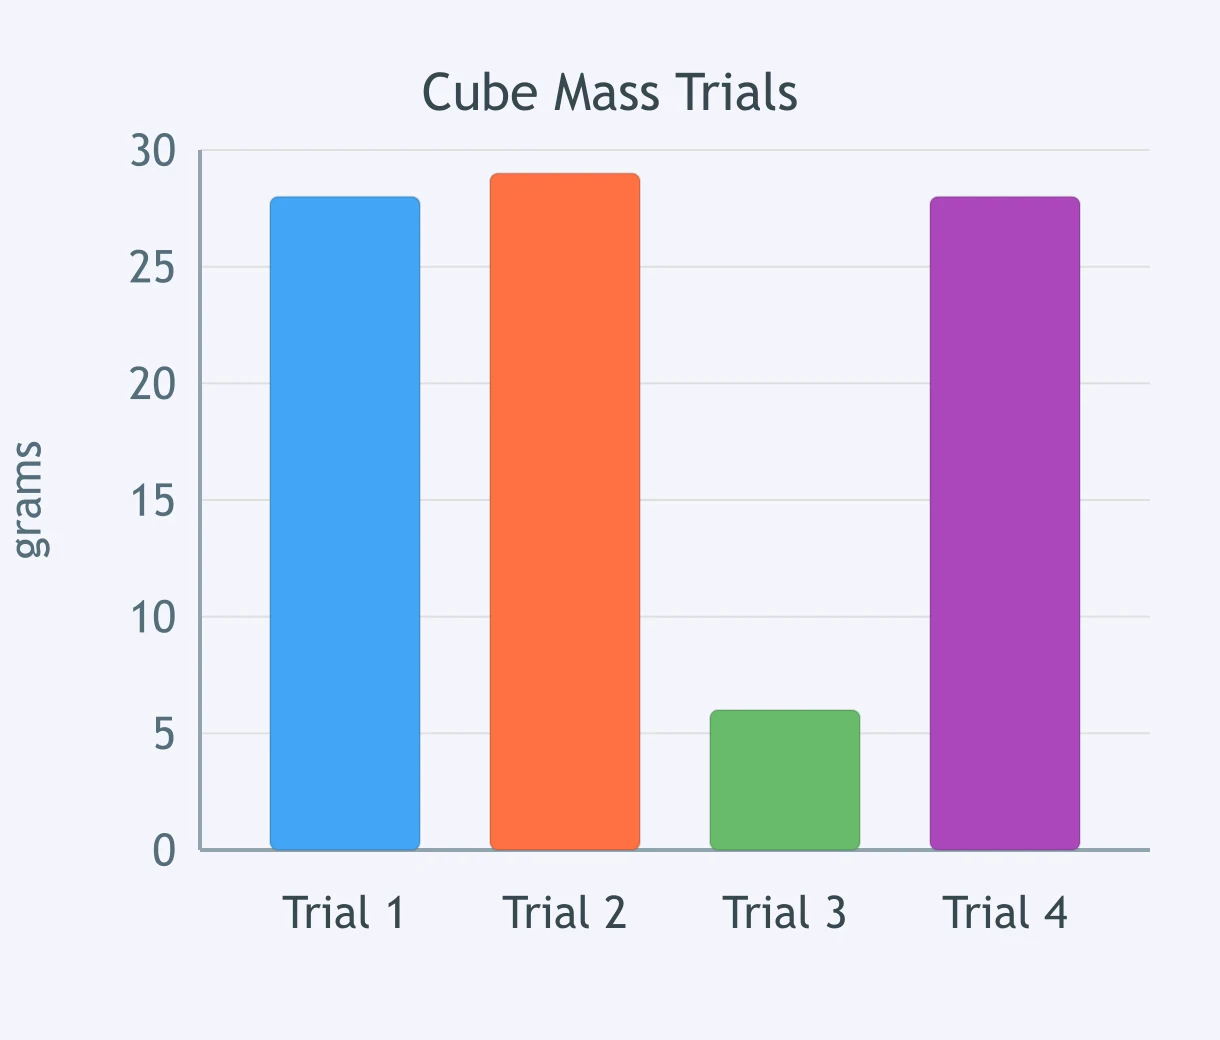
Use the bar graph of four mass trials for the same cube. What trial should be checked for an error?
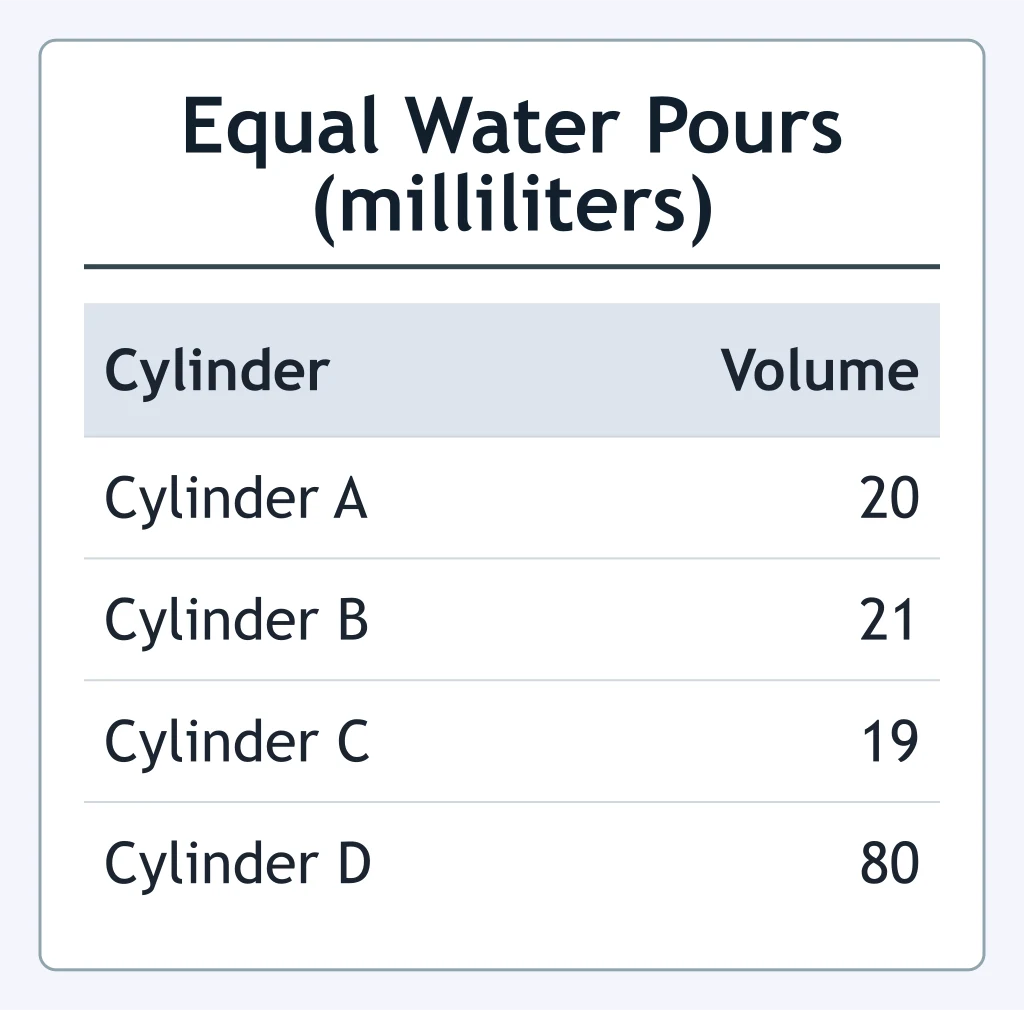
Use the data table of equal water pours. What graduated cylinder reading should be repeated because it does not fit?
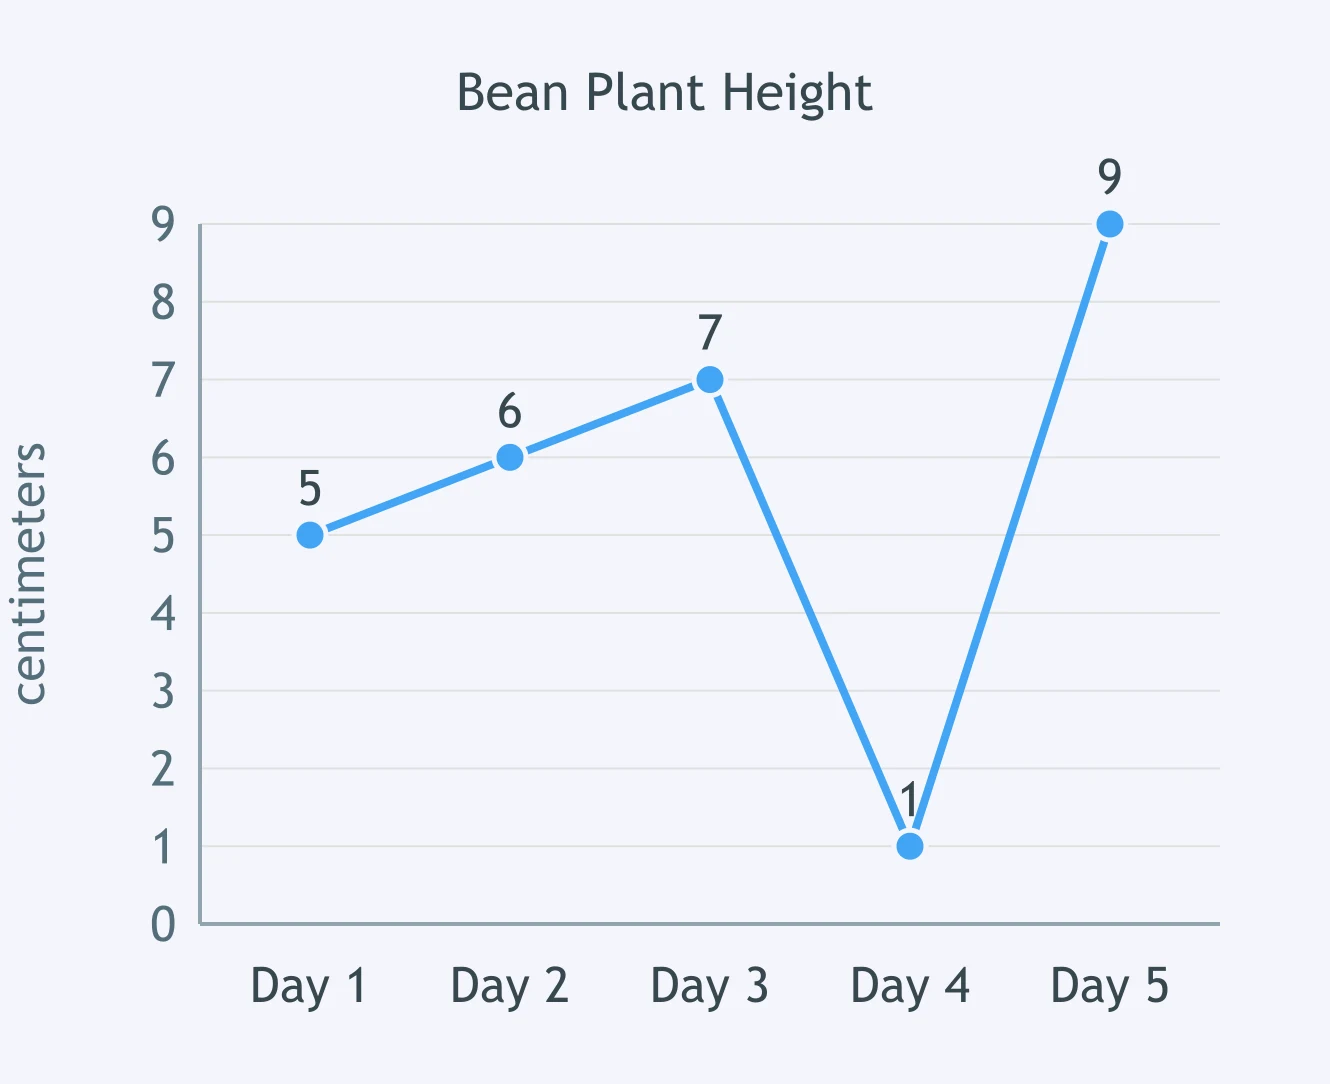
Use the line graph of bean plant height over five days. What data point likely came from measuring the wrong plant?
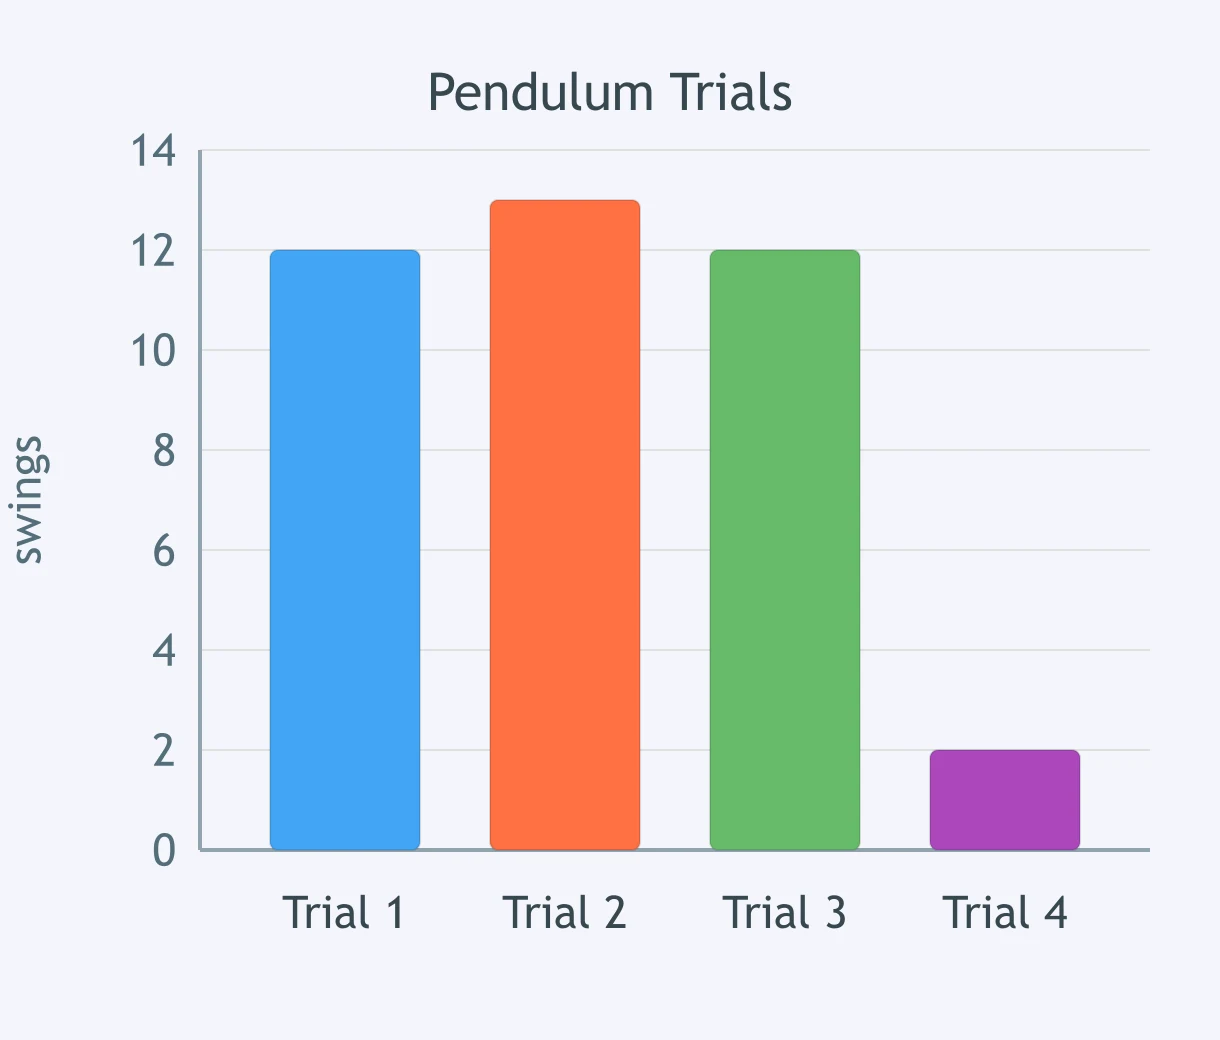
Use the bar graph of pendulum swings in 30 seconds. What trial likely has a timing error?
Crack the passcode before the zombies get in.
Answer, then swat bugs for bonus points.
Race through questions at your own speed.
Same question on every screen. Fastest wins.

Pick a tile, answer, hit bonuses and steals.
The Water Cycle
40 questions