Loading
by BlastRoom
Students read social studies data displays and decide what the data does and does not show.
#data_reading#us_grade_5_social_studies
20 questions
One question set, multiple game modes. Tap any game to see it in action. Not sure which to pick?
Answer to place stones and capture territory.
Outrun the snow together.
Earn blasts, then hunt the other team.
Answer to earn energy, then climb.

The class blasts through walls together.
Bid on mystery lots. Most money wins.
Sell tours. Nice, standard, or a total scam.

Answer, restock, and serve the rush.
More correct answers pulls the rope your way.
Answer, then shoot down the alien wave.
Answer, then tap to leap the frozen ridge.
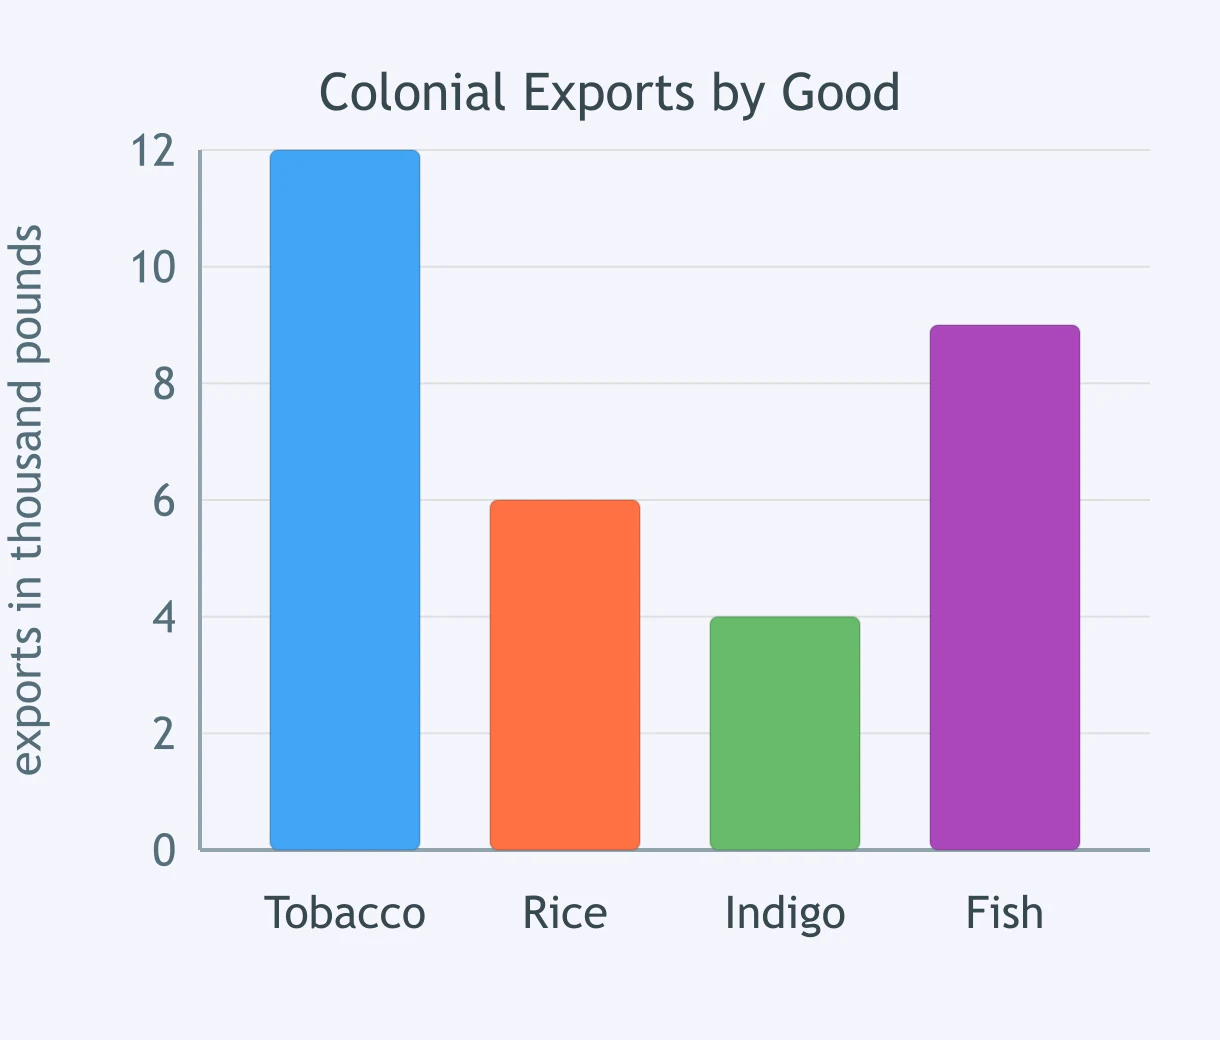
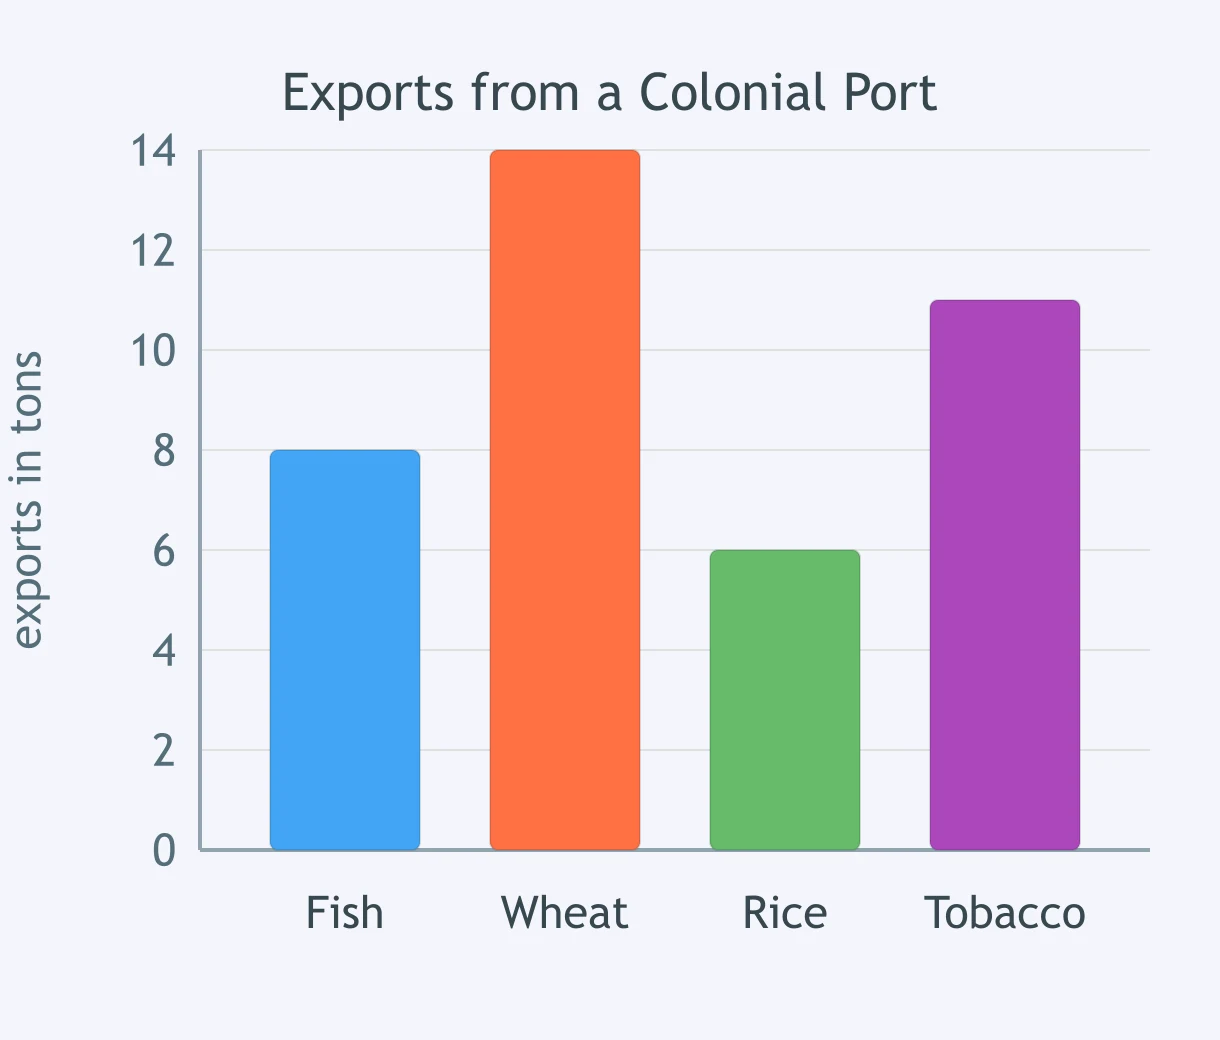
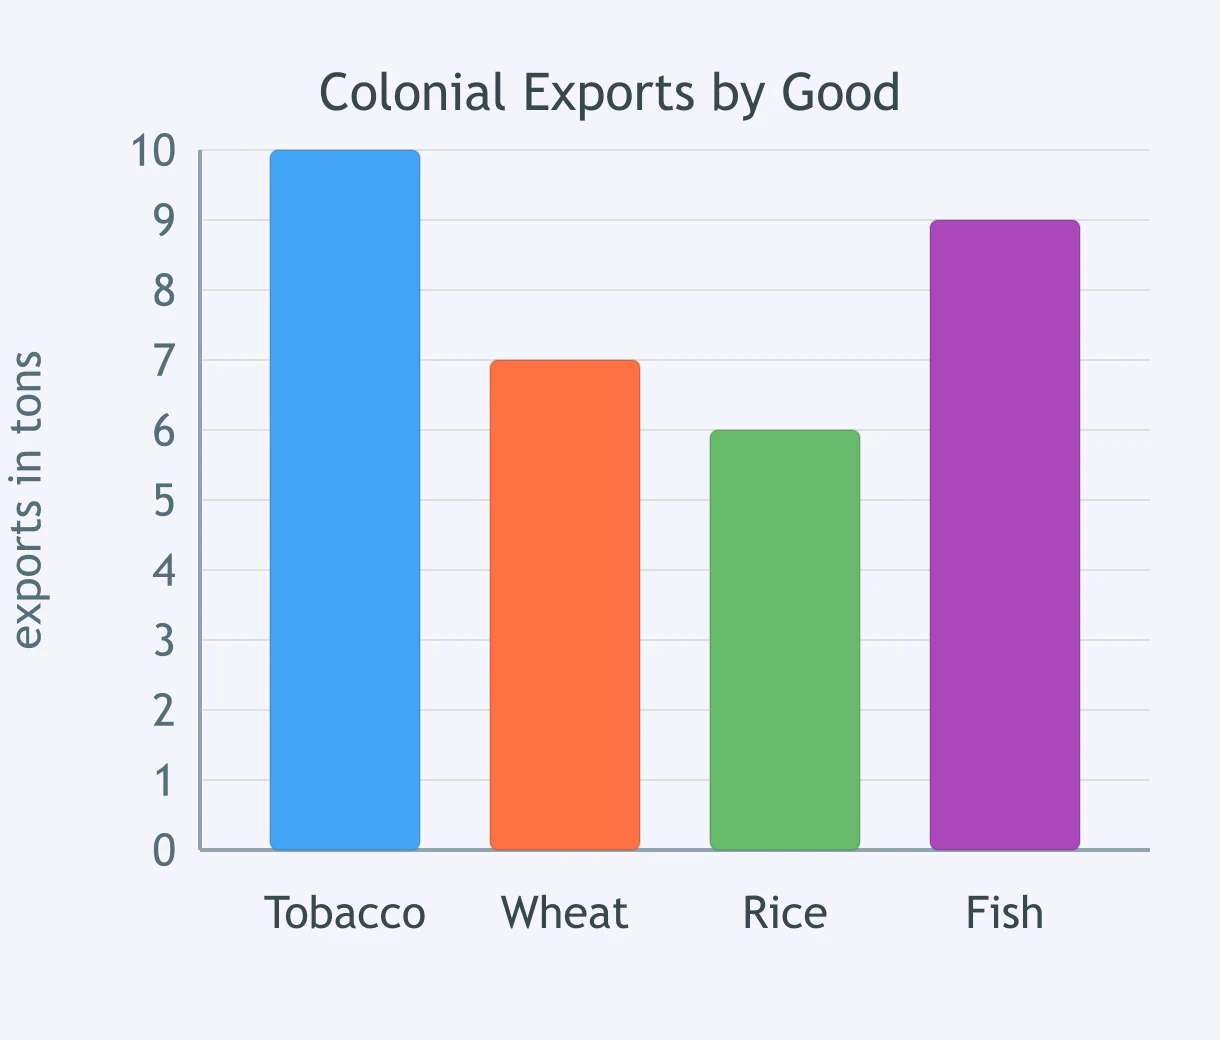
Use the bar graph about colonial exports. What value is shown for tobacco exports?
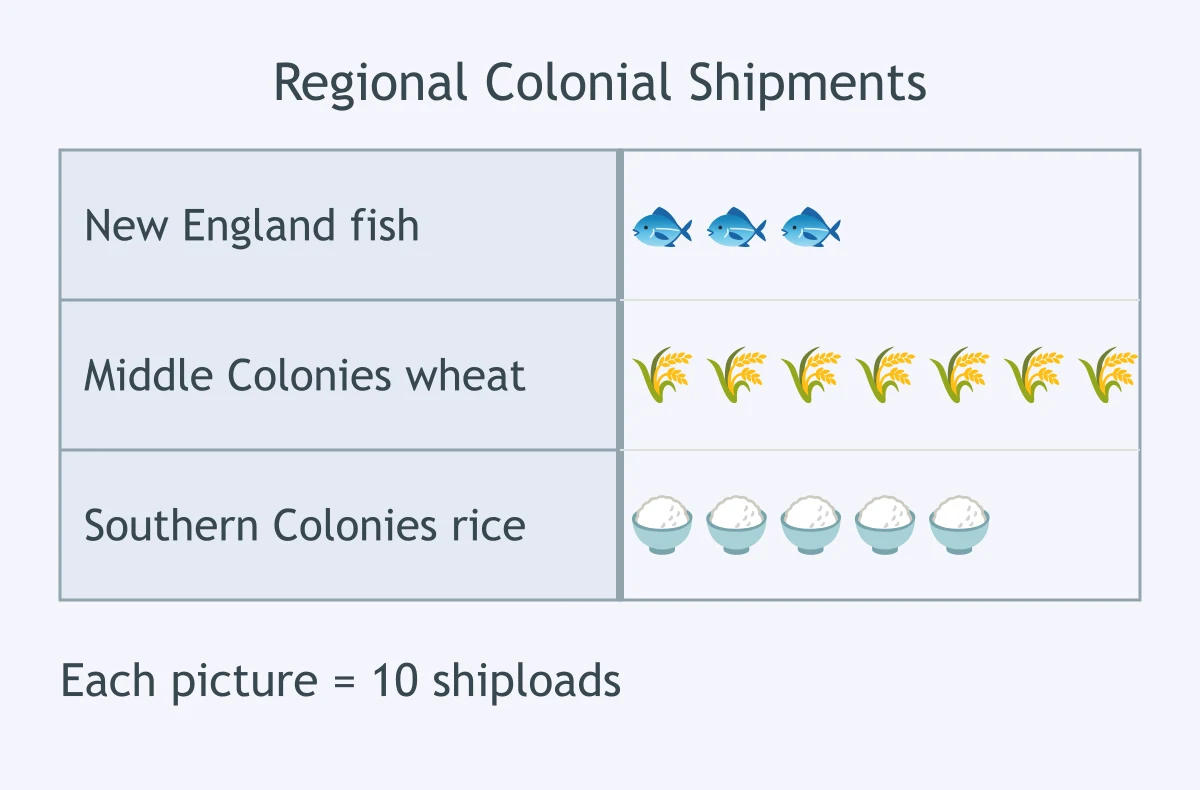
Use the picture graph about crops shipped from three colonial regions. How many wheat symbols are shown for the Middle Colonies?
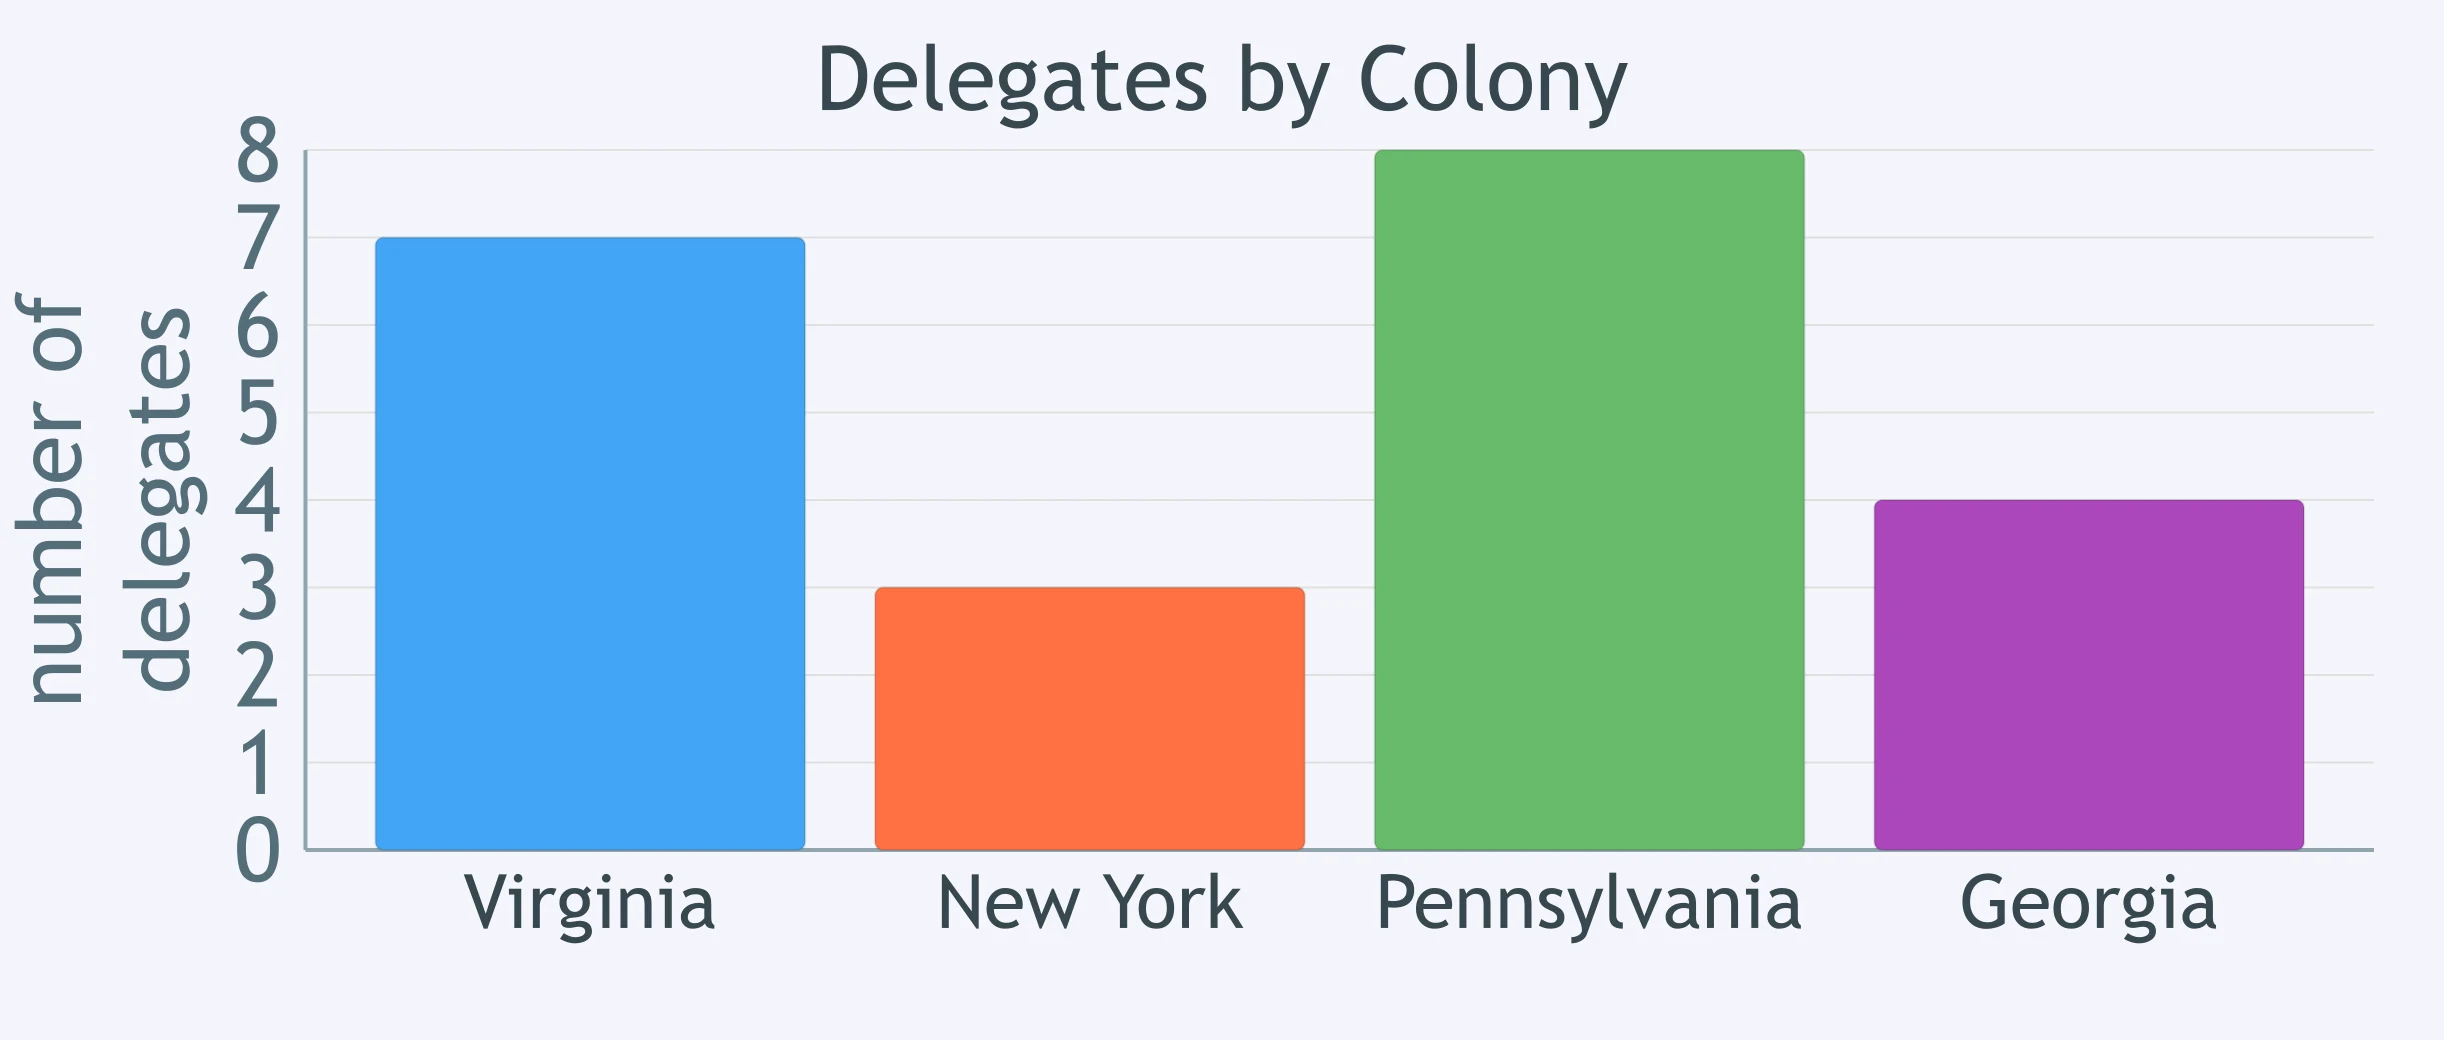
Use the bar graph about delegates at a convention. How many delegates are shown for Virginia?
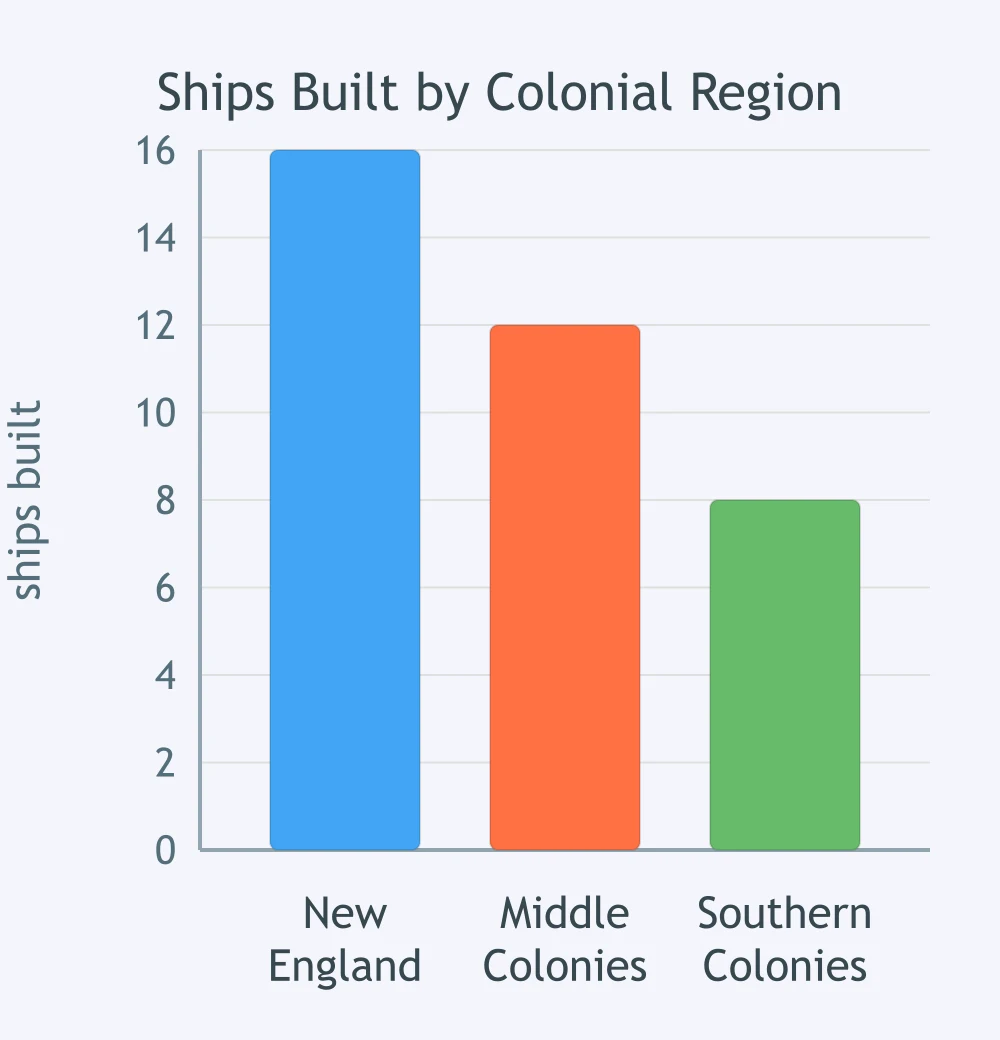
Use the bar graph about colonial shipbuilding. What value is shown for New England ships built?
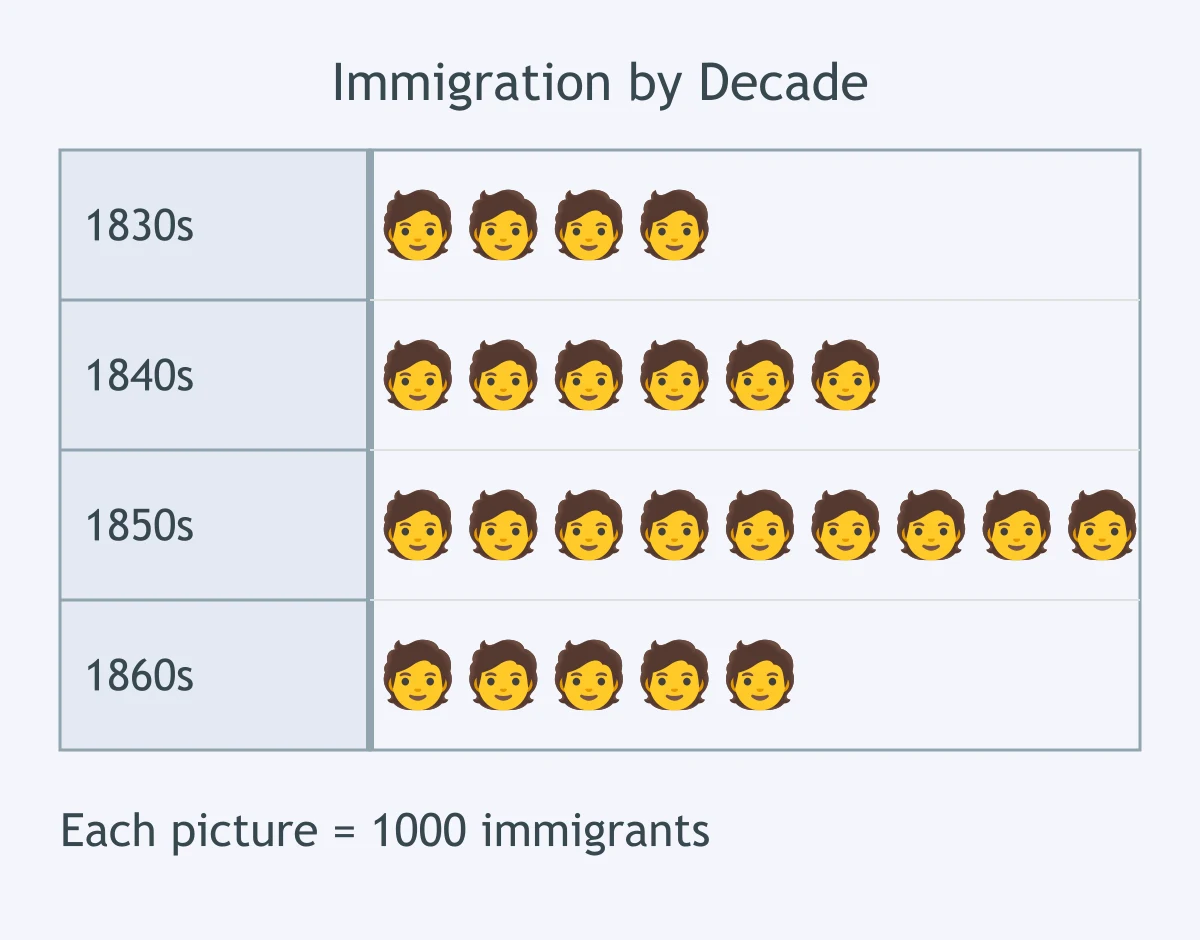
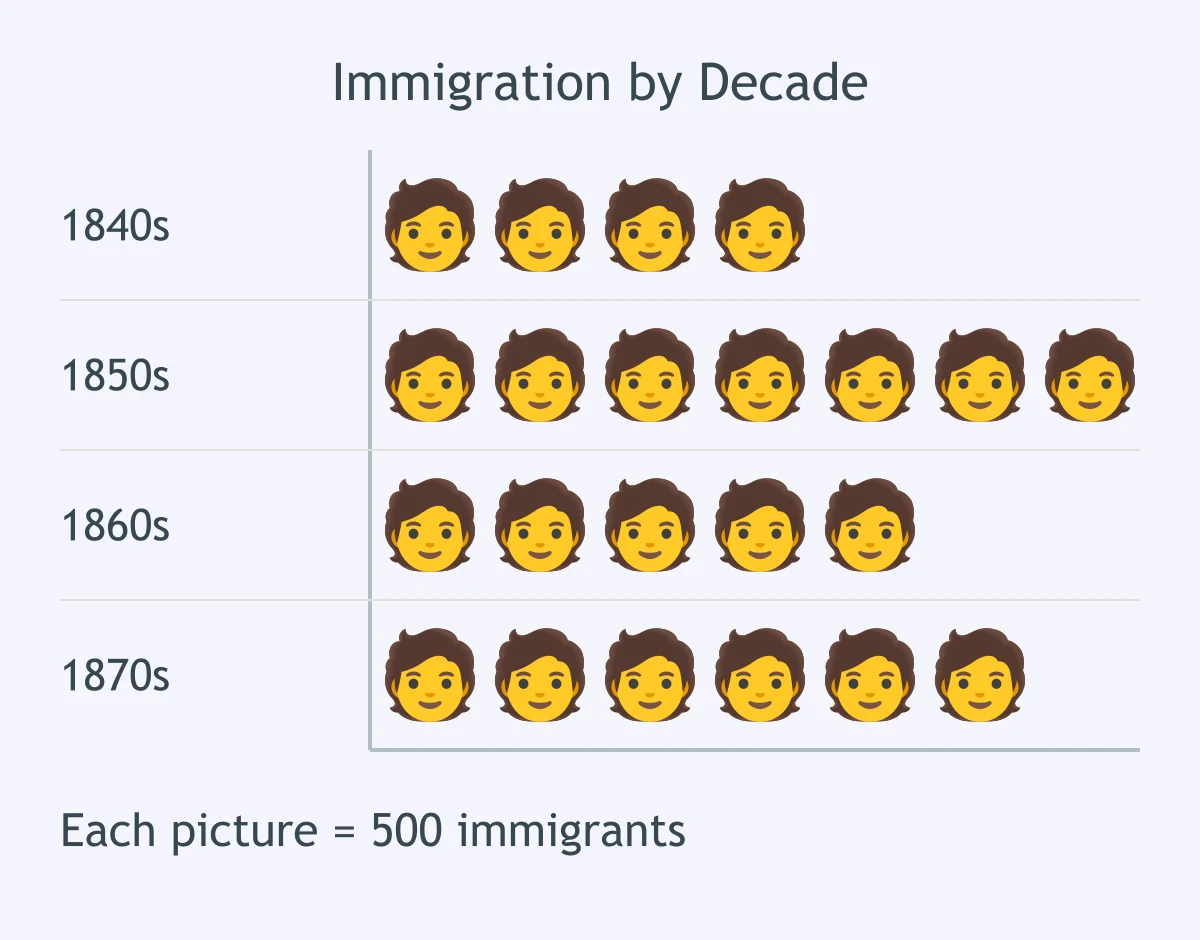
Use the picture graph about immigration by decade. How many symbols are shown for the 1850s?
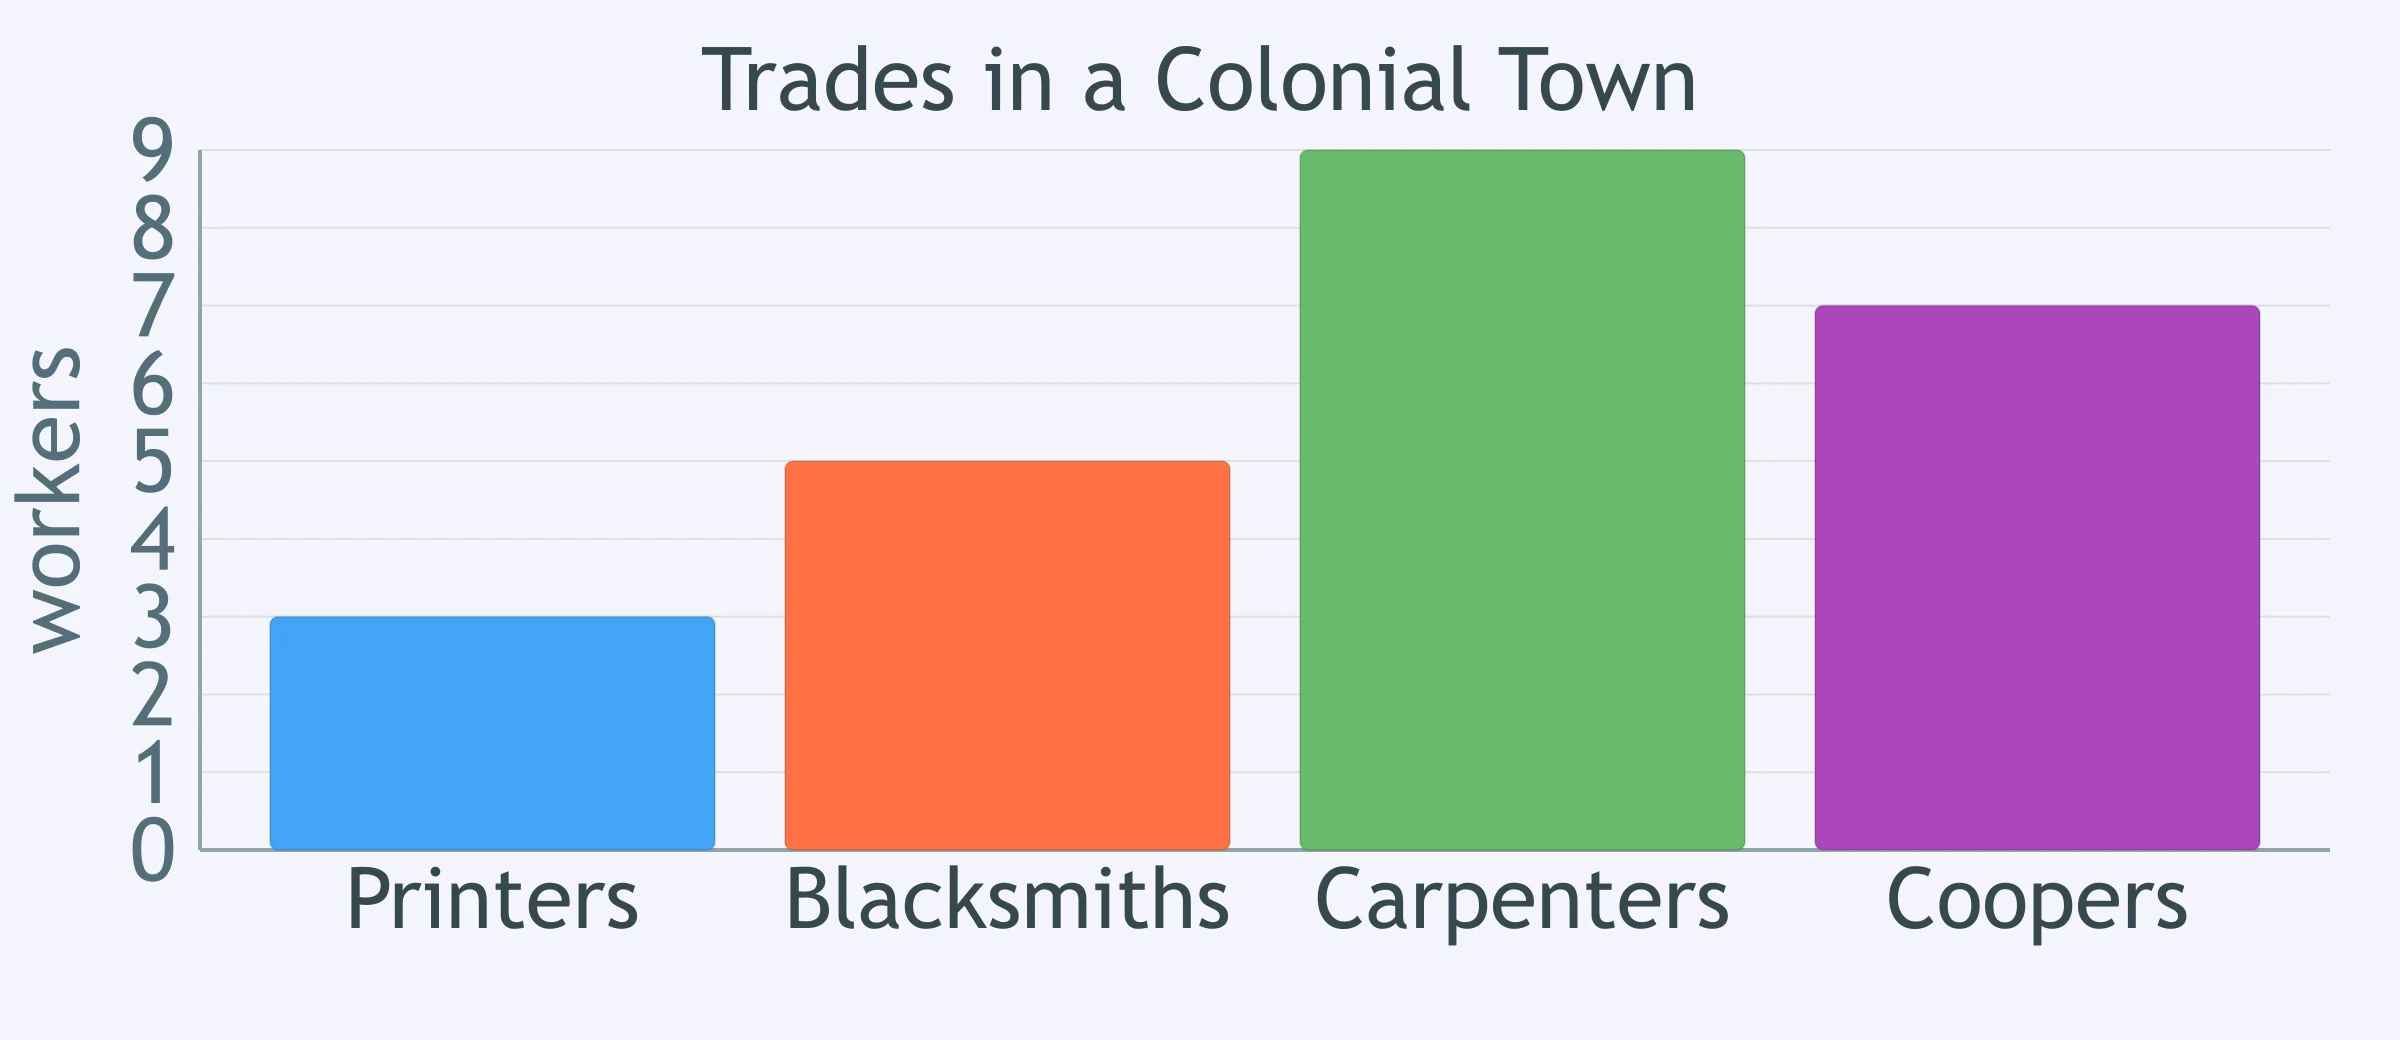
Use the bar graph about colonial town trades. How many blacksmiths are shown?
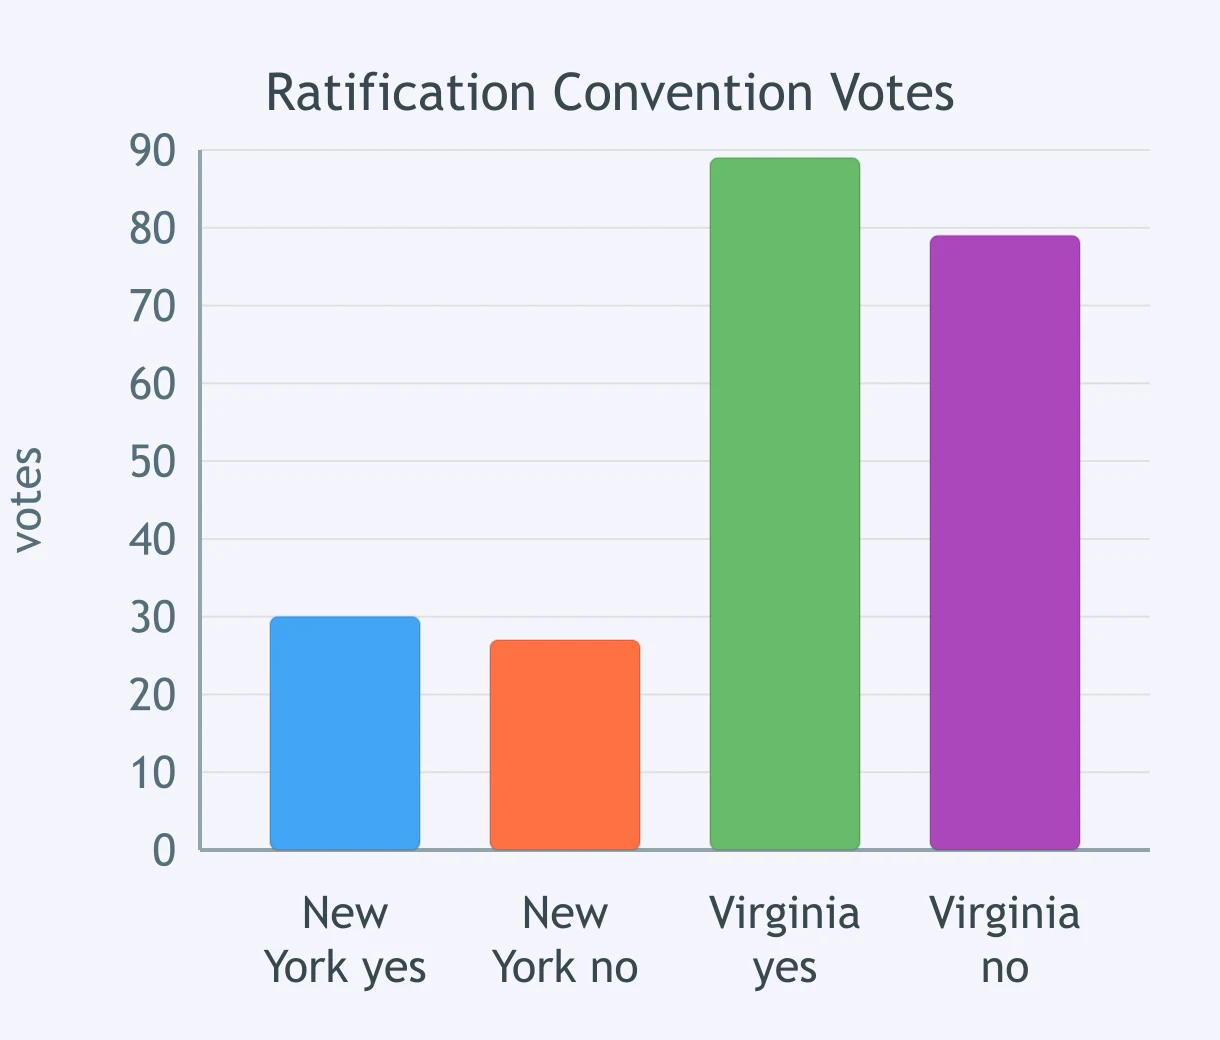
Use the bar graph about ratification votes. How many yes votes are shown for New York?
Use the bar graph about goods exported from a port. What good has the largest value?
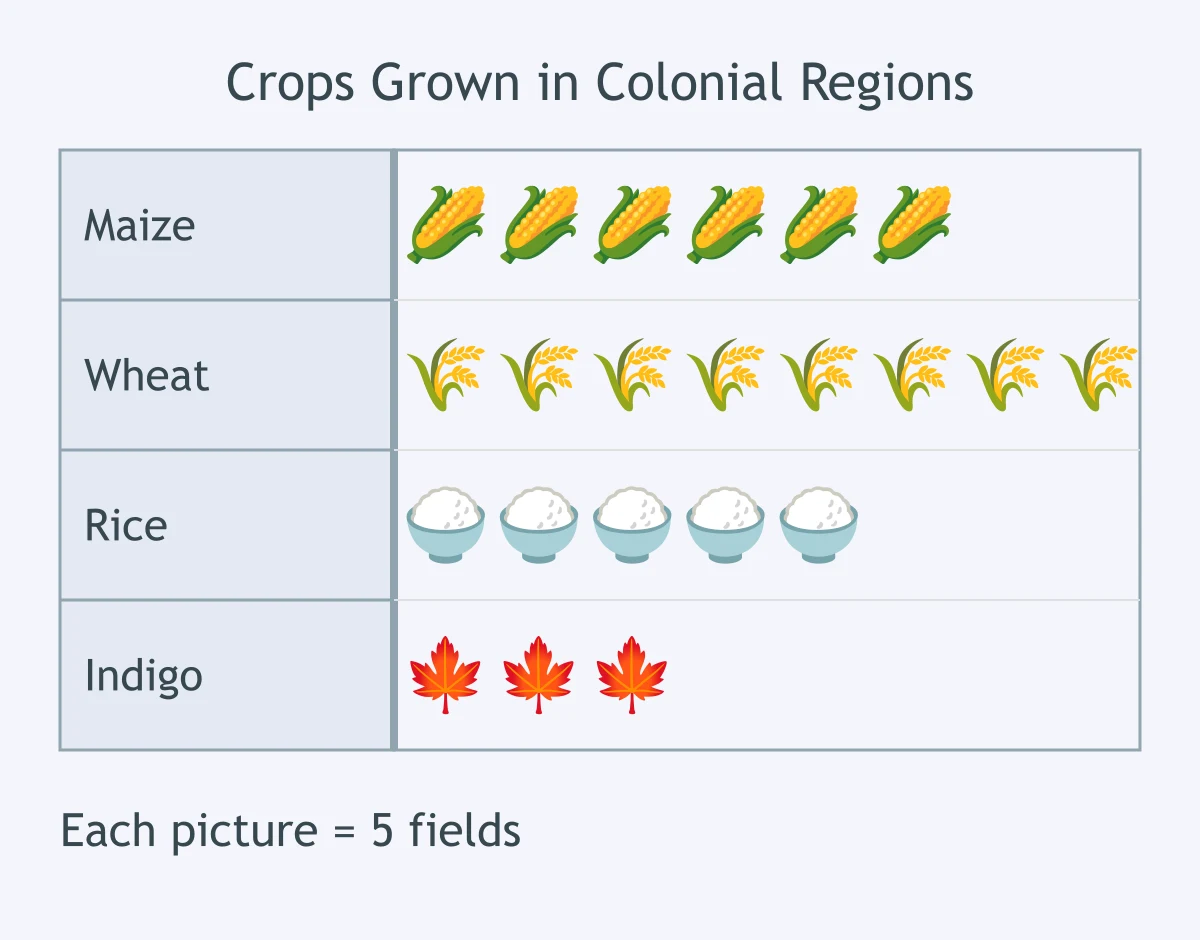
Use the picture graph about crops grown in regions. What crop has the fewest symbols?
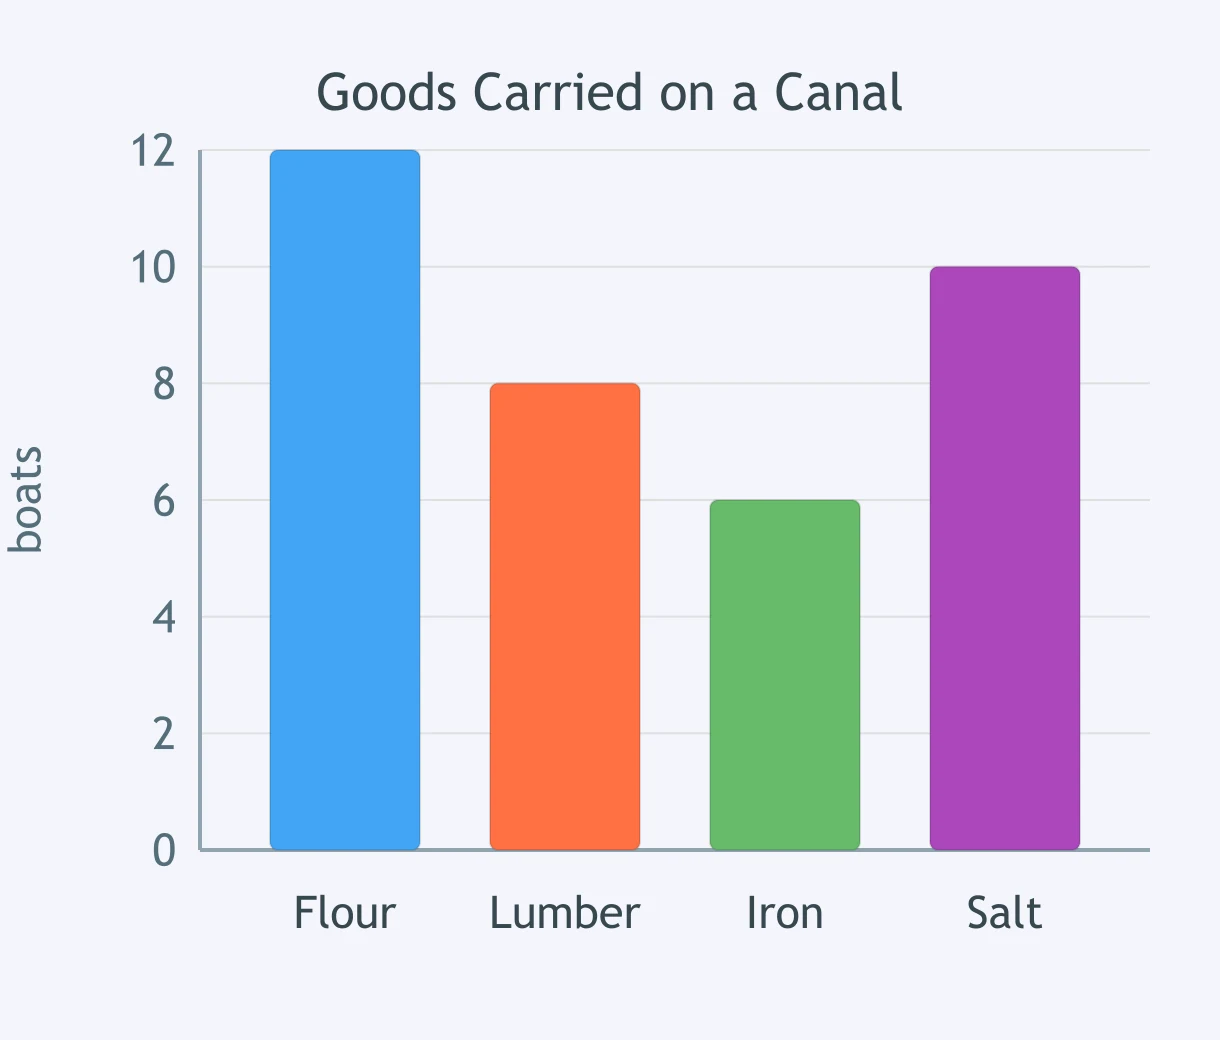
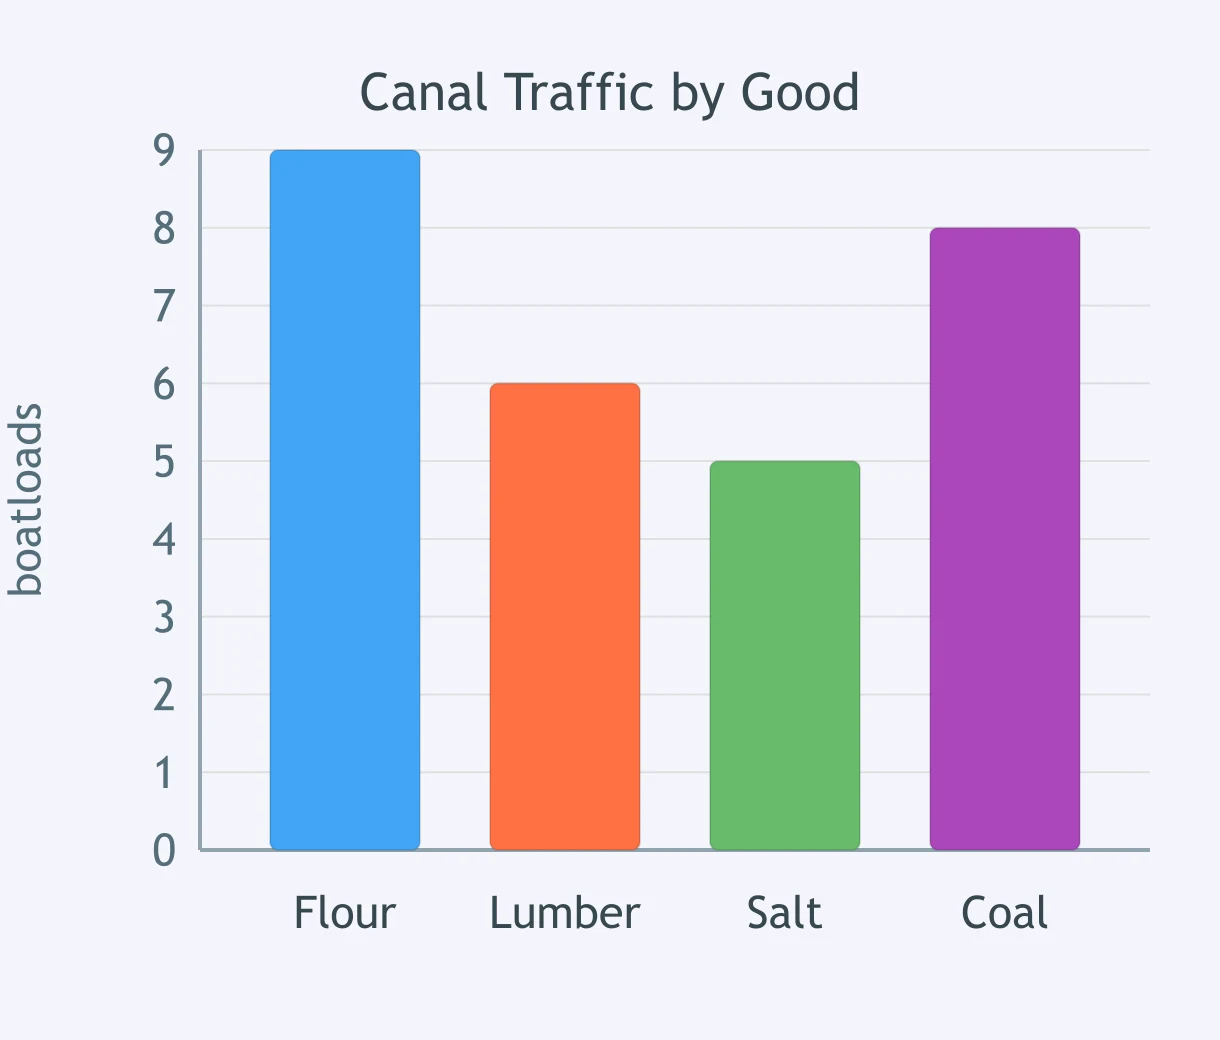
Use the bar graph about goods carried on a canal. How many more boats carried flour than lumber?
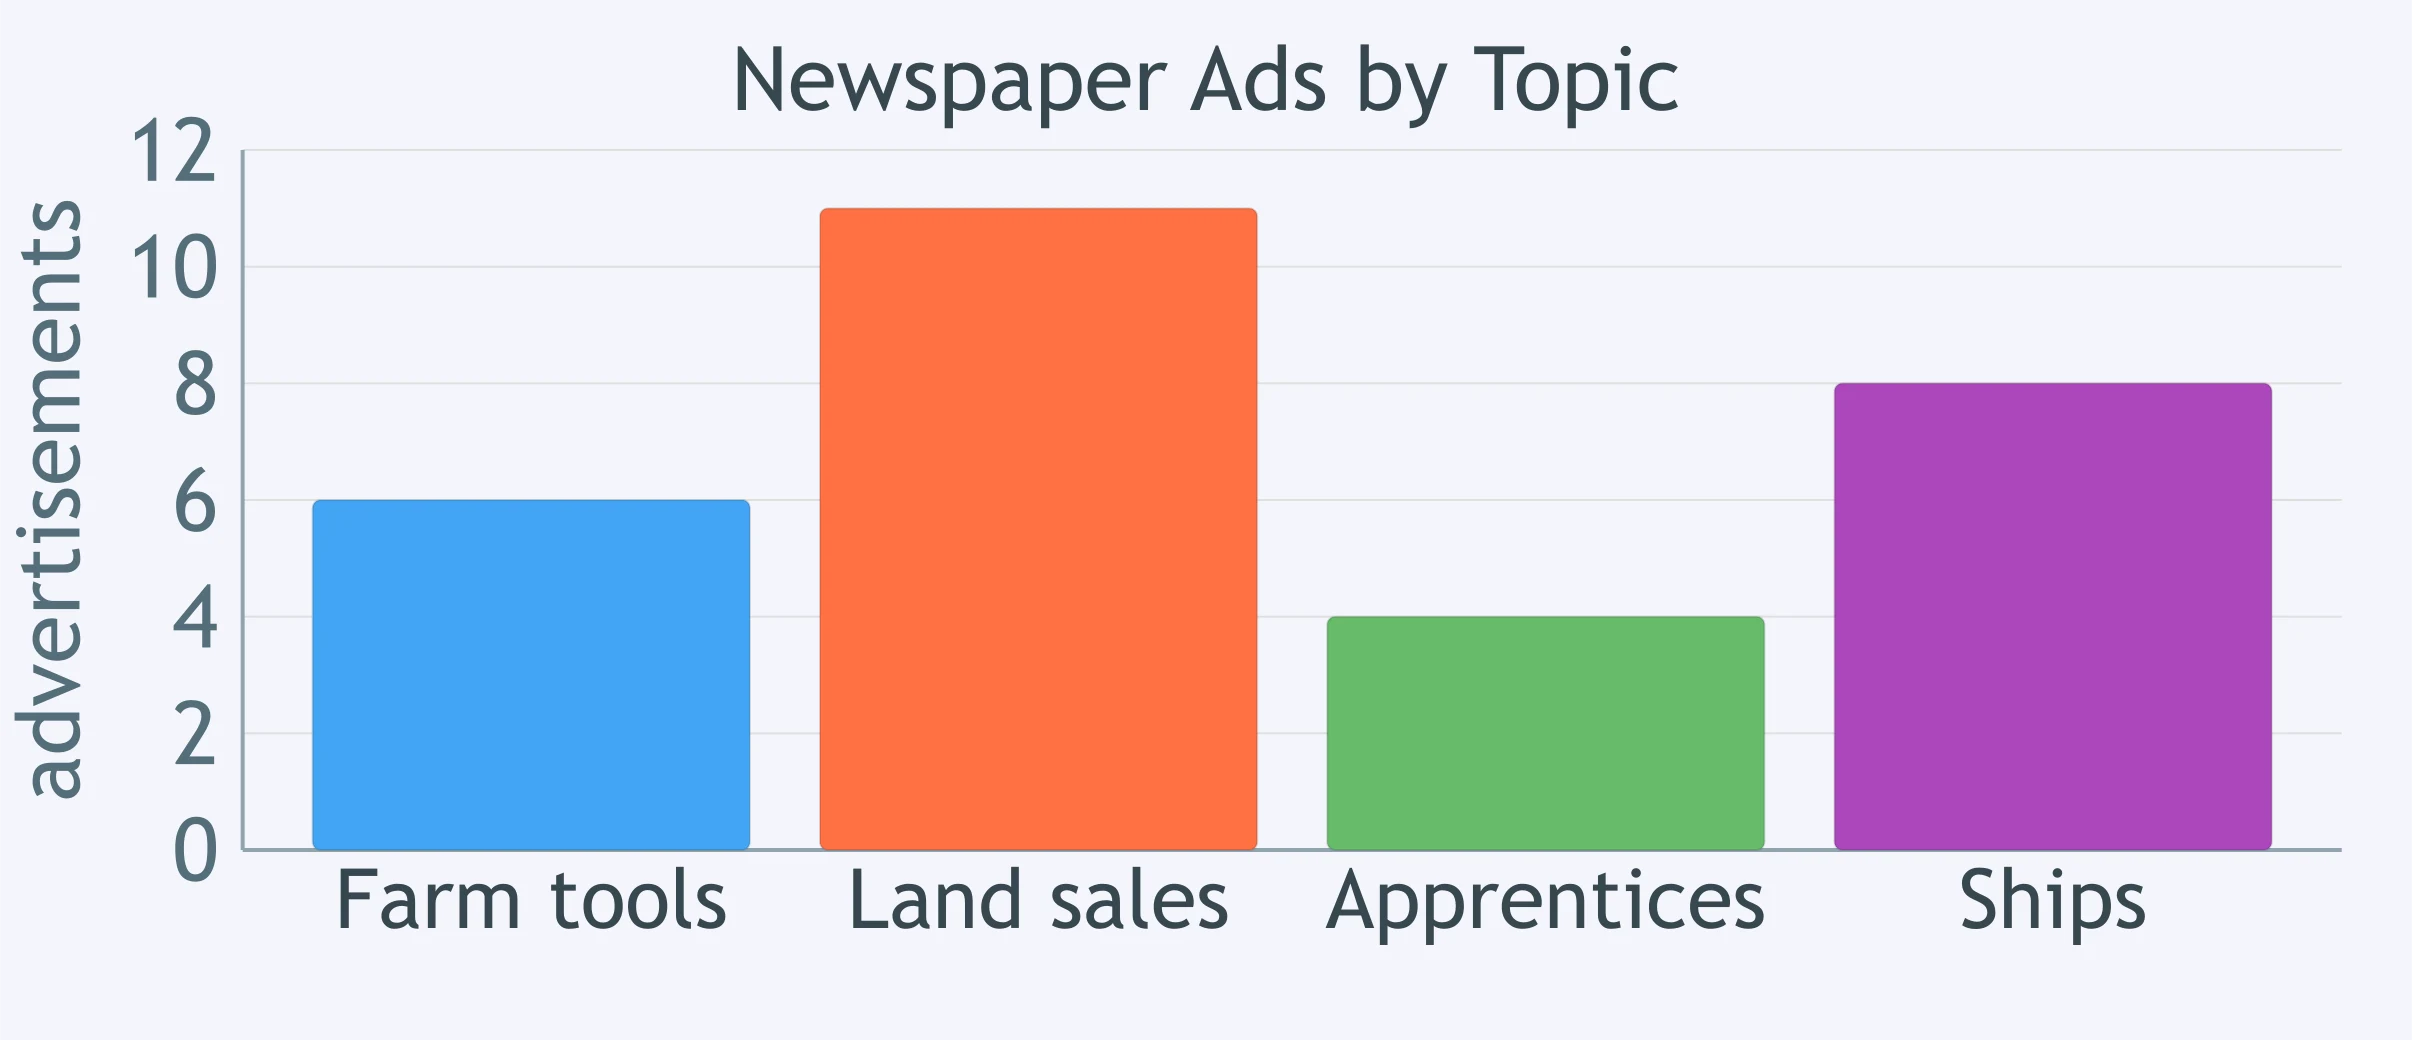
Use the bar graph about colonial newspaper ads. How many fewer ads listed farm tools than land sales?
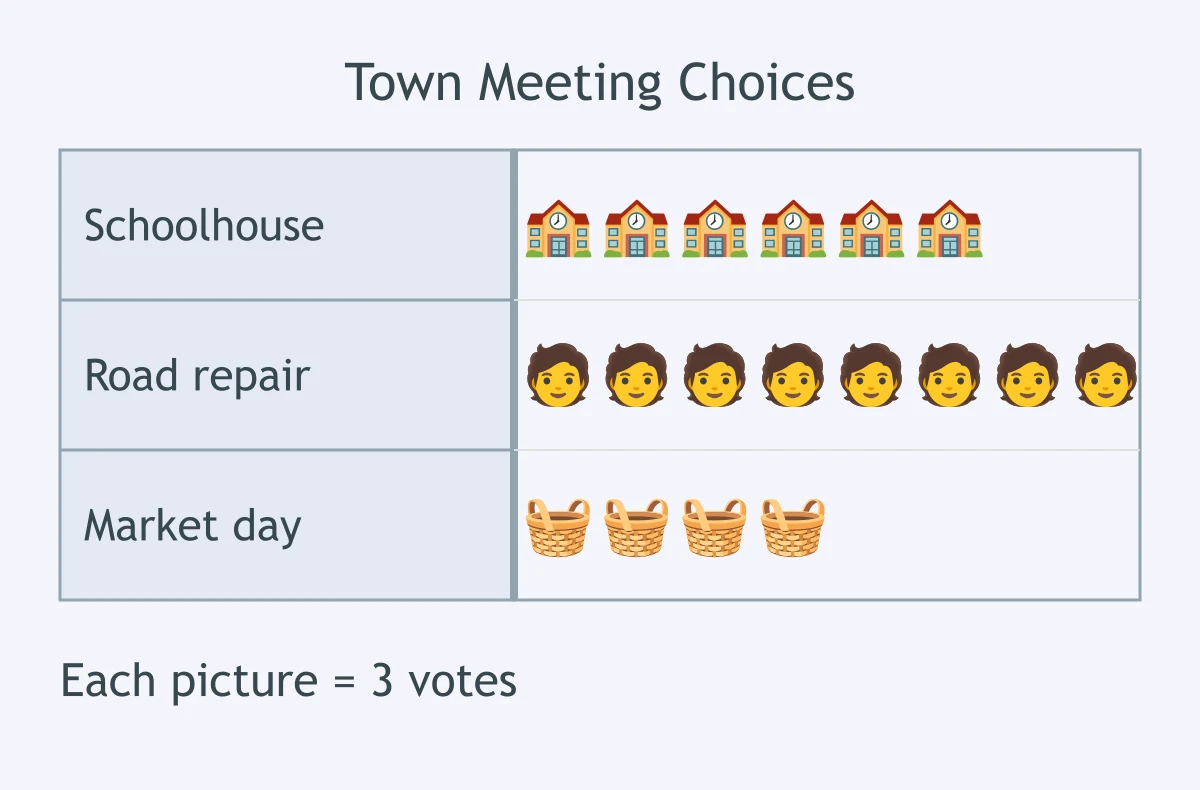
Use the picture graph about votes in a town meeting. Rank the choices from most support to least support.
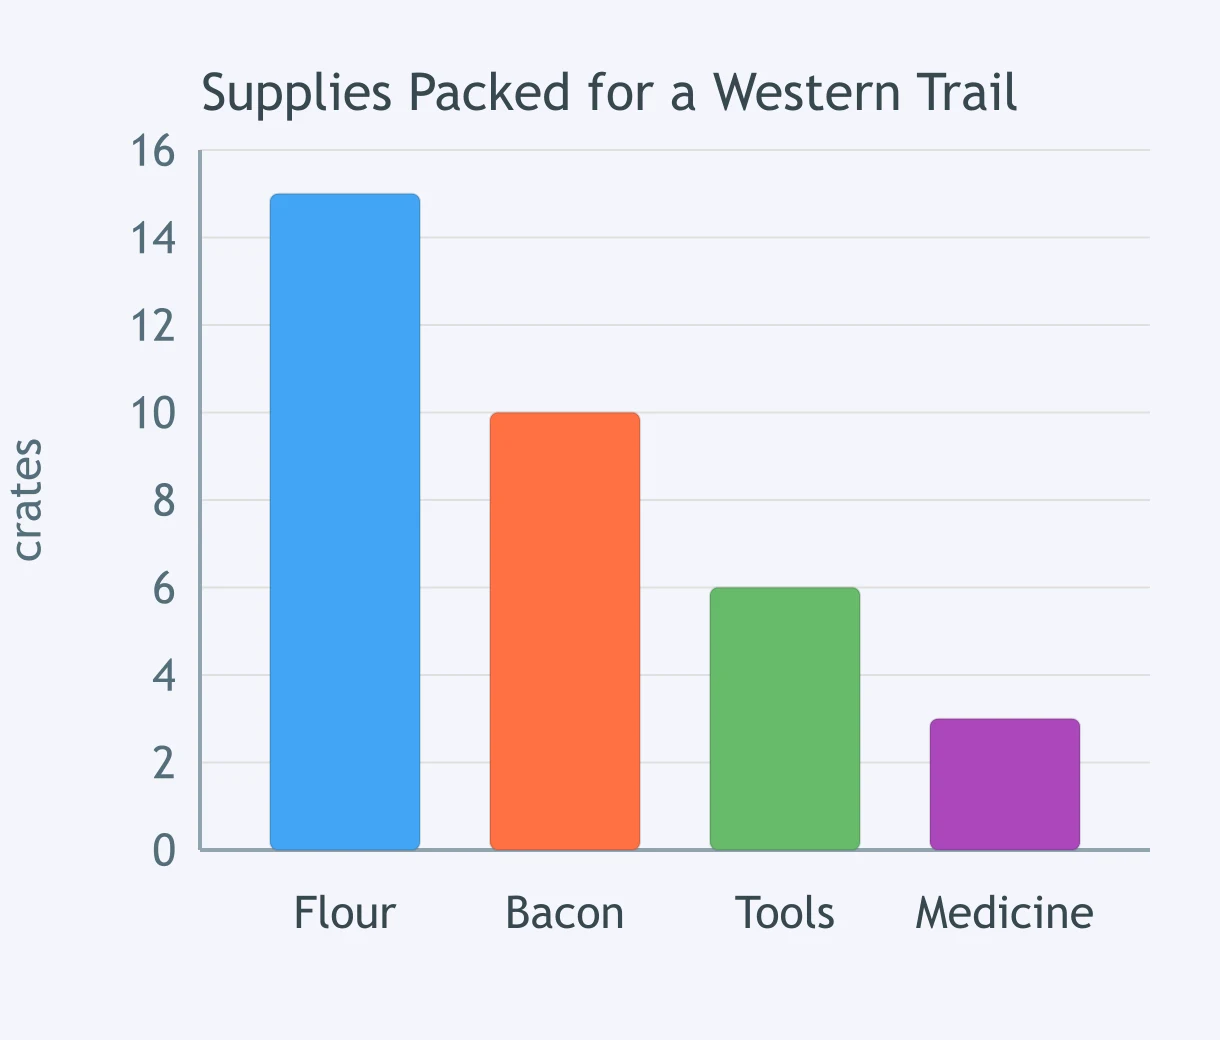
Use the bar graph about western trail supplies. What supply category is smallest?
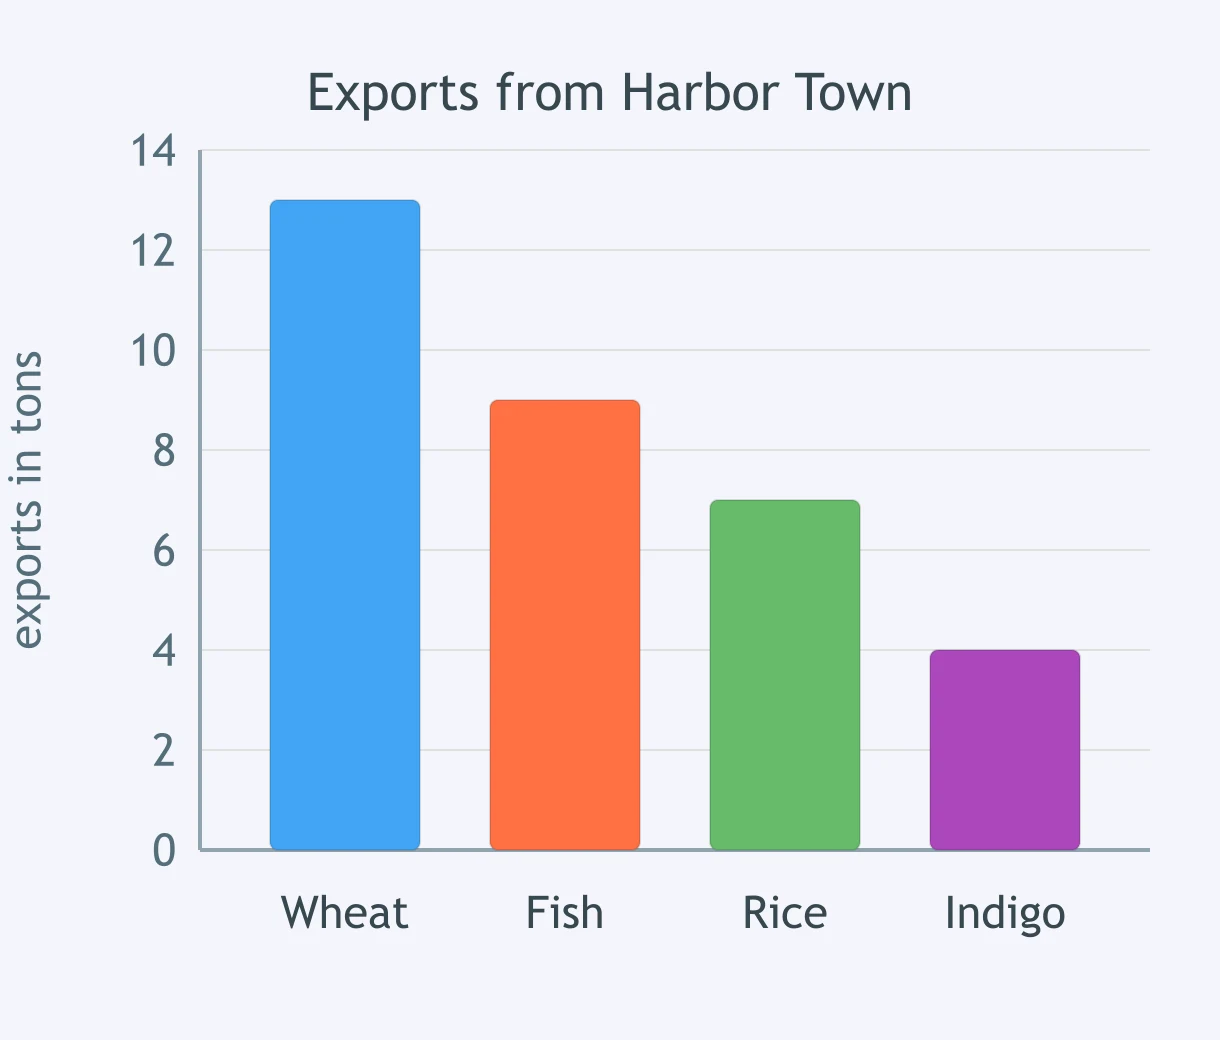
A student claims the port exported more wheat than fish. Does the bar graph support that claim?
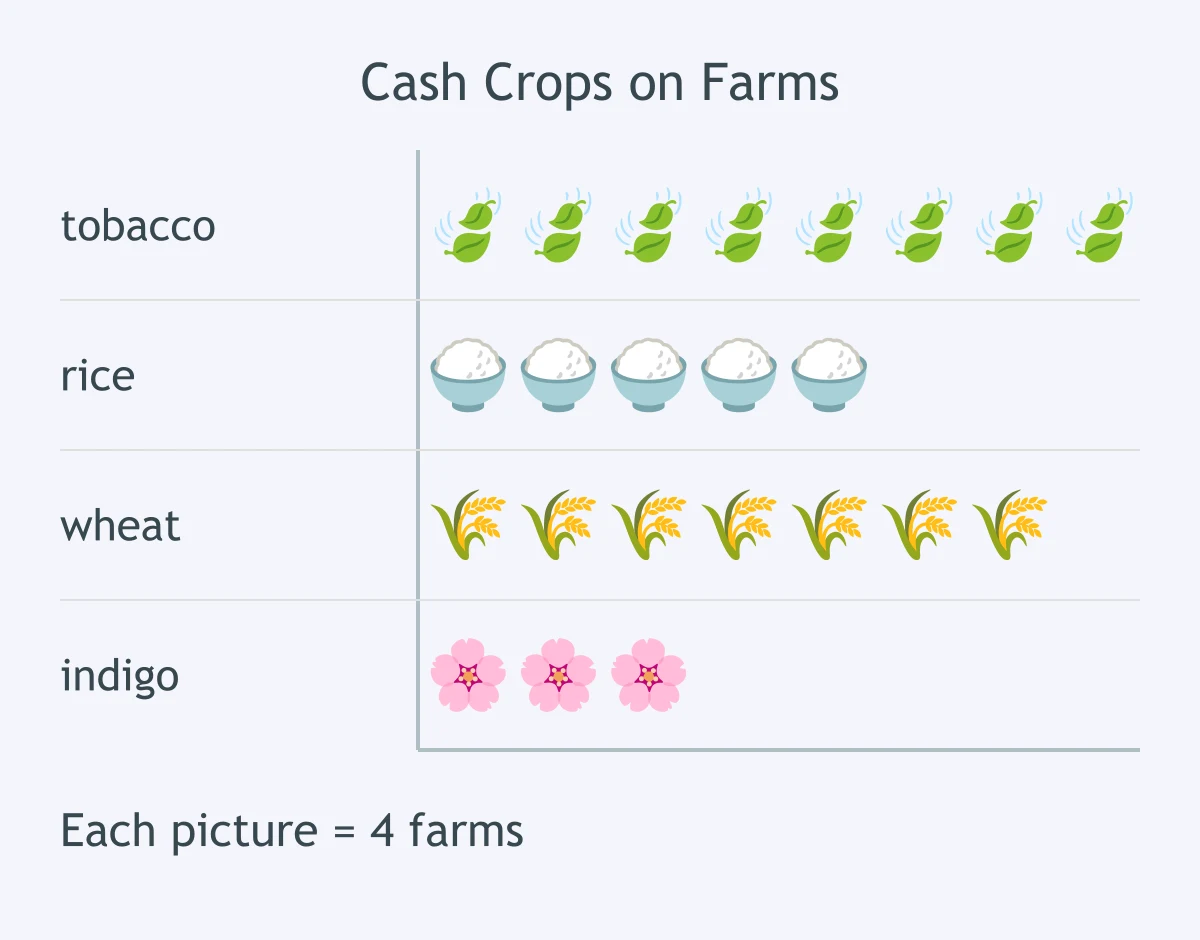
A student claims the picture graph shows rice was grown on the most farms. Does the data support that claim?
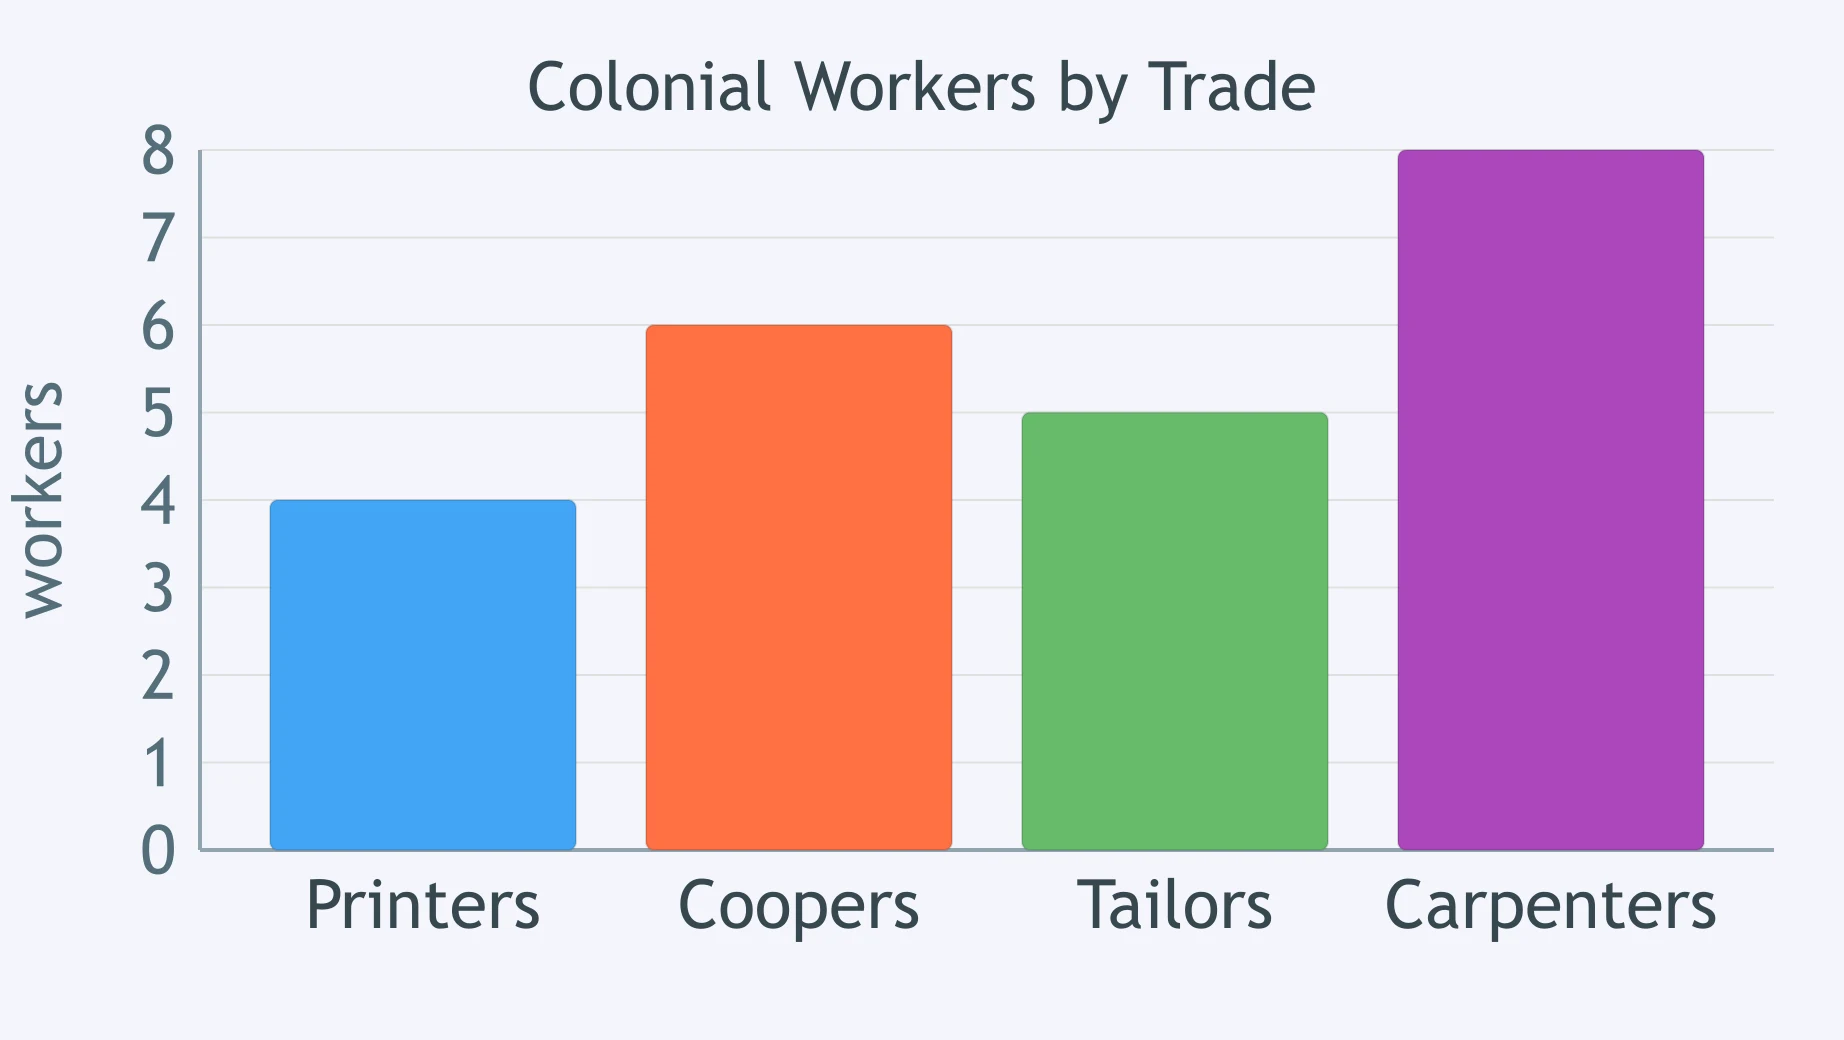
A student claims the graph shows some colonists worked as printers. Does the data support that claim?
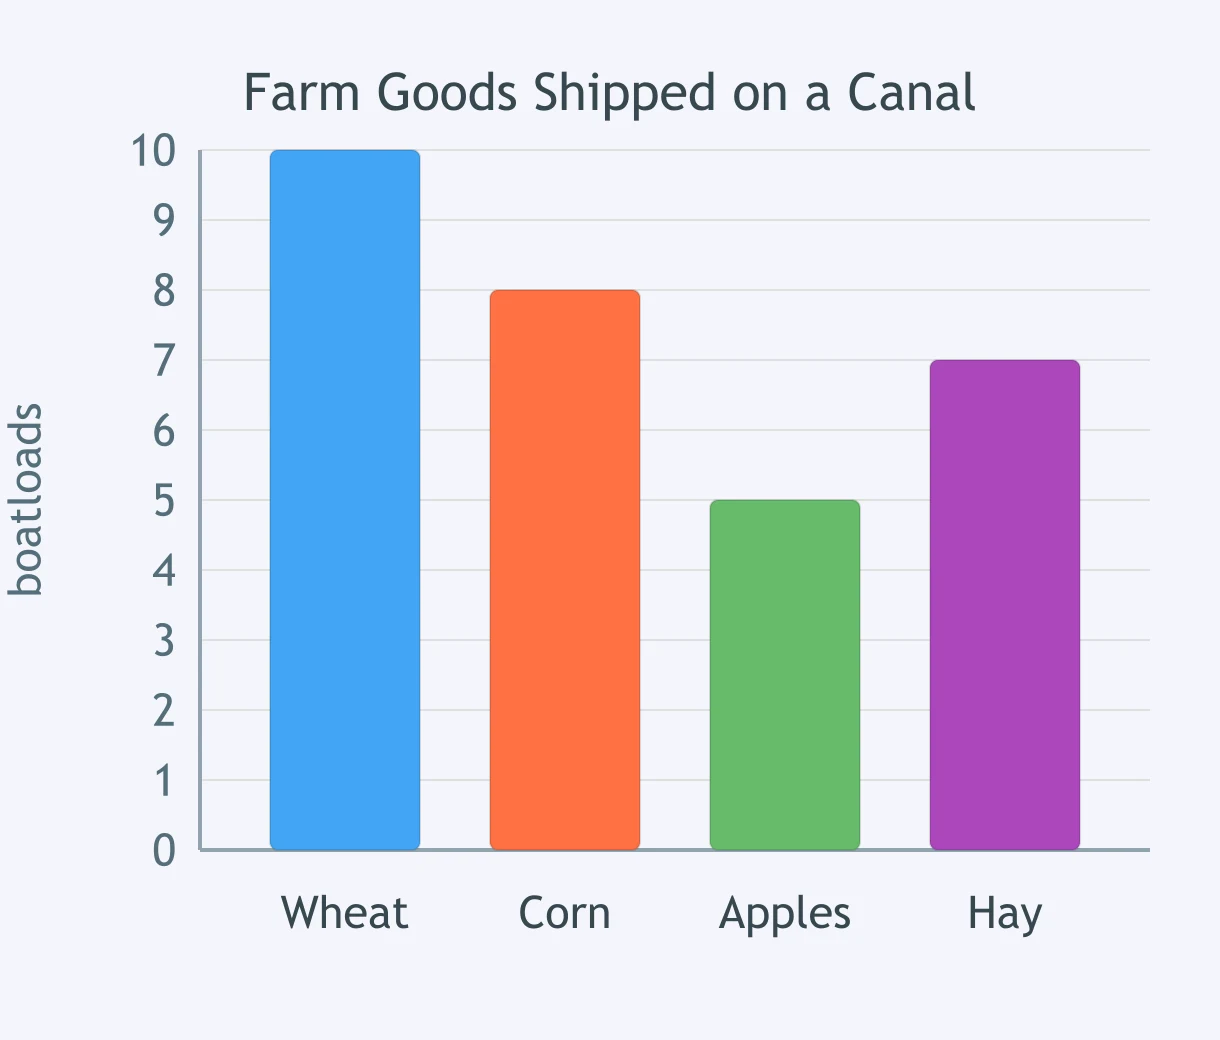
A student claims the canal data proves why farmers chose those crops. Does the figure support that claim?
In the bar graph about colonial exports, what does the title tell a reader?
In the picture graph about immigration by decade, what does the key at the bottom tell a reader?
In the bar graph about canal traffic, what does the axis label “boatloads” tell a reader?

The Course and Consequences of the American Revolution
40 questions

From the Articles of Confederation to the Constitution of 1787
40 questions

Ratification and the Bill of Rights
40 questions

Settlement Patterns and State Capitals, 1789 to the Mid-1800s
40 questions

American History Figures: Quick Facts
40 questions
Crack the passcode before the zombies get in.
Answer, then swat bugs for bonus points.
Race through questions at your own speed.
Same question on every screen. Fastest wins.

Pick a tile, answer, hit bonuses and steals.