Loading
by BlastRoom
C3 inquiry skills practice: reading a described chart, graph, artifact, or image as evidence and judging what it can support.
#skills#us_grade_6_social_studies
20 questions
One question set, multiple game modes. Tap any game to see it in action. Not sure which to pick?
A bar graph titled "Wheat Harvested in One Village" gives 400 tons in 1990, 650 tons in 2000, 900 tons in 2010, and 1,150 tons in 2020. What pattern does the graph show?
A line graph plots only the tons of wheat a village harvested in 1990, 2000, 2010, and 2020. A student wants to explain why the harvest changed. What must the student find another source for?
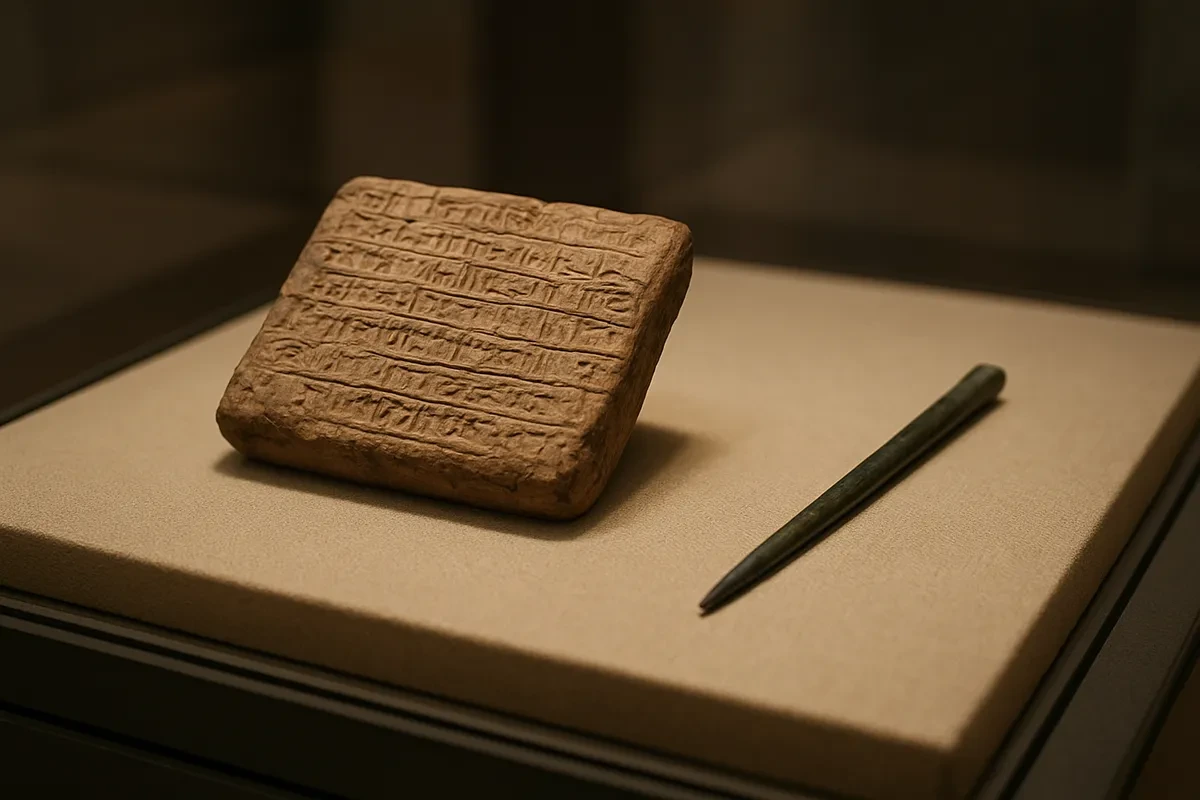
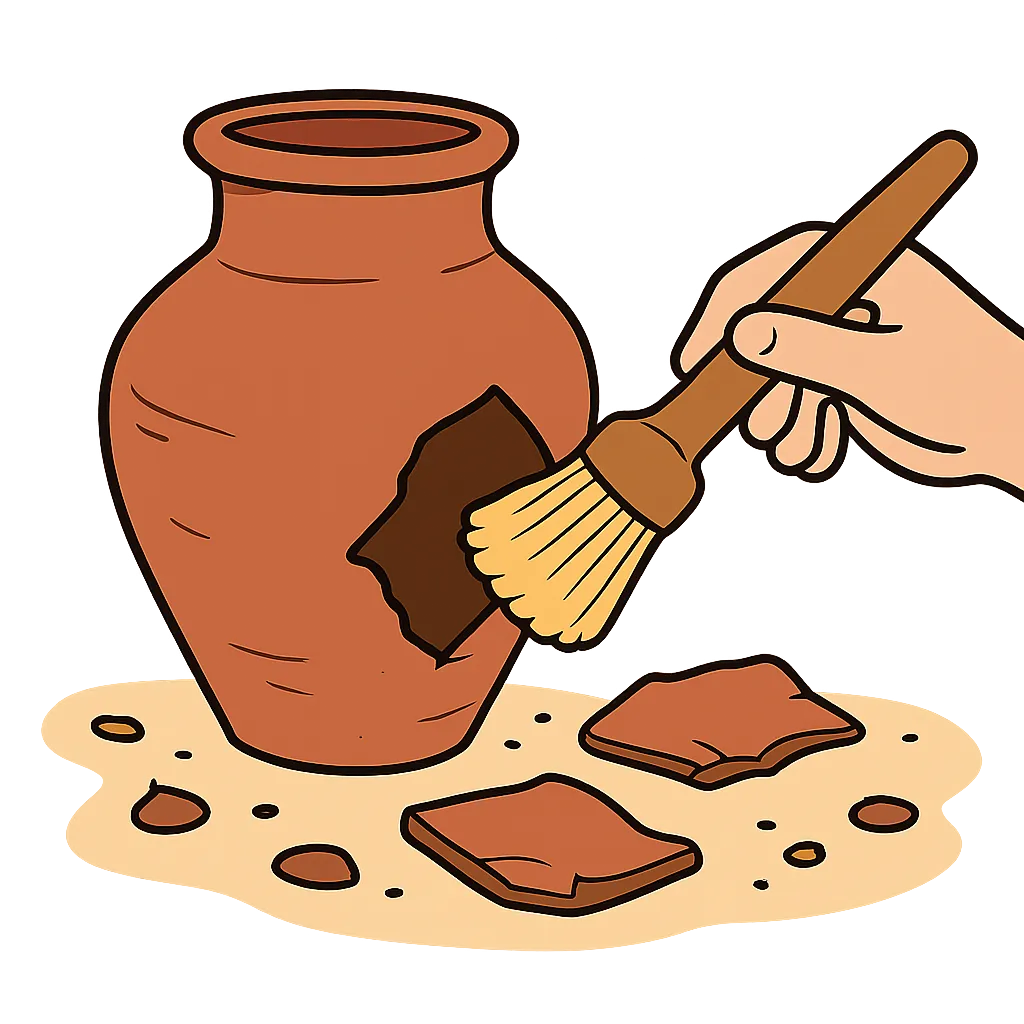
Archaeologists excavate a broken clay storage jar from the floor of a Mesopotamian house and date it to about 1800 BCE. For a study of that city in 1800 BCE, what kind of source is the jar?
A circle graph titled "Land Use in a River Valley" shows cropland 55 percent, pasture 25 percent, forest 15 percent, and towns 5 percent. What does the graph show about land in the valley?
A government land office printed a poster urging families to move west, calling the land "rich, cheap, and easy to farm." What does that wording best reveal to a historian?
A student finds grain prices for one city and year in a merchant's account book, then finds the same prices in that city's tax records for the same year. What have the two sources done?
A student copies two sentences word for word from a website into a report and names no author, website, or date anywhere. What is that called?
At the end of a report, a student lists the author, title, publisher, and date of every book and website used. What is that list made of?
A historian published a book in 2001 about ancient Egypt after studying letters that scribes wrote in 1300 BCE. For a study of Egypt in 1300 BCE, what is the 2001 book?
A table titled "Average Rainfall by Month" lists 5 mm in June, 10 mm in July, 190 mm in August, and 210 mm in September. What does the table show about rainfall?
An engineer measured a river's depth during the week it flooded and wrote the numbers down. A traveler wrote about the same flood twenty years later from memory. Whose account is more reliable for the flood's depth?
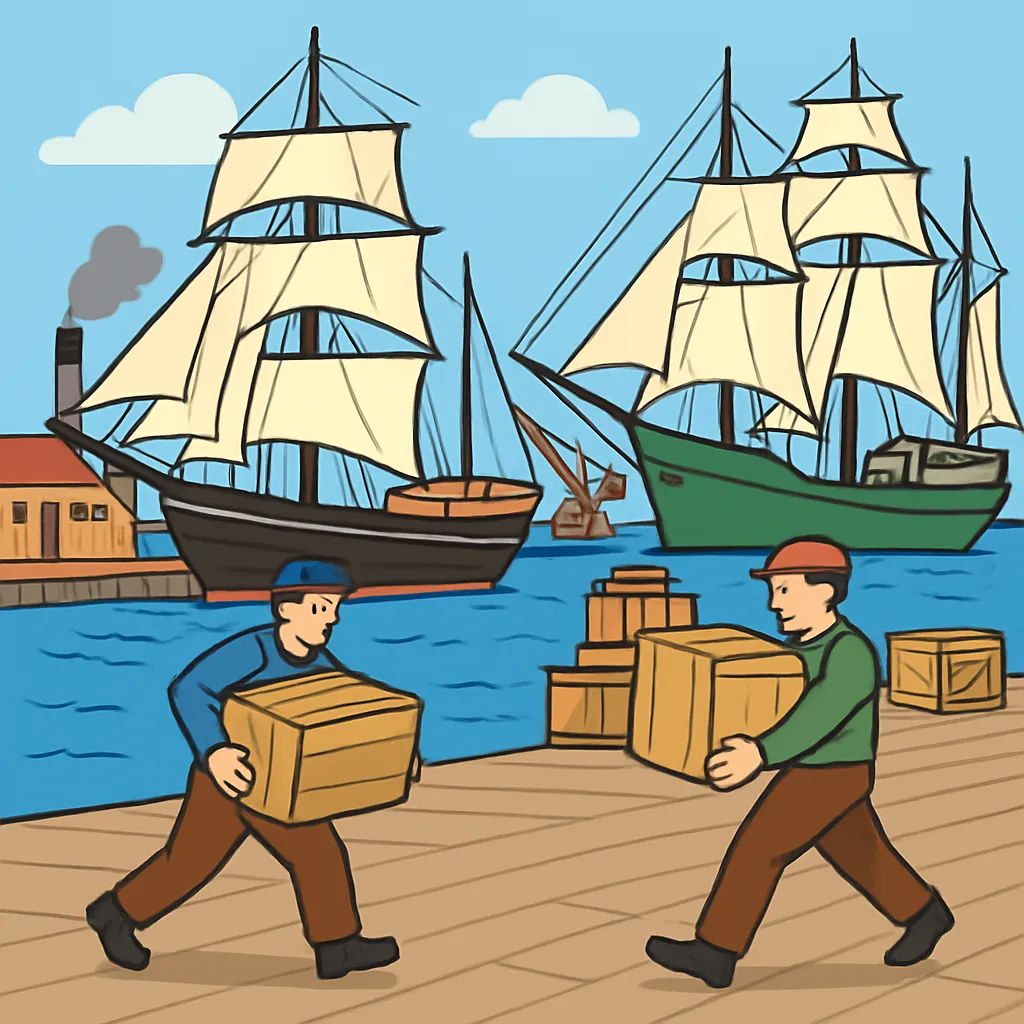
A photograph taken at a harbor in 1910 shows dozens of sailing ships tied up and workers unloading wooden crates onto the dock. What claim does the photograph best support?
A student claims a town grew after the railroad reached it in 1872. A table shows the town had 120 households in 1870 and 640 households in 1890. How does the table function in the student's report?
One historian argues a city shrank because of a long drought. A second historian uses merchant records to argue that trade routes shifted away from the city instead. What is the second argument called?
A bar graph shows a country's exports as 20 million tons in 1980, 24 in 1990, 26 in 2000, and 27 in 2010. What statement goes beyond what this graph can show?
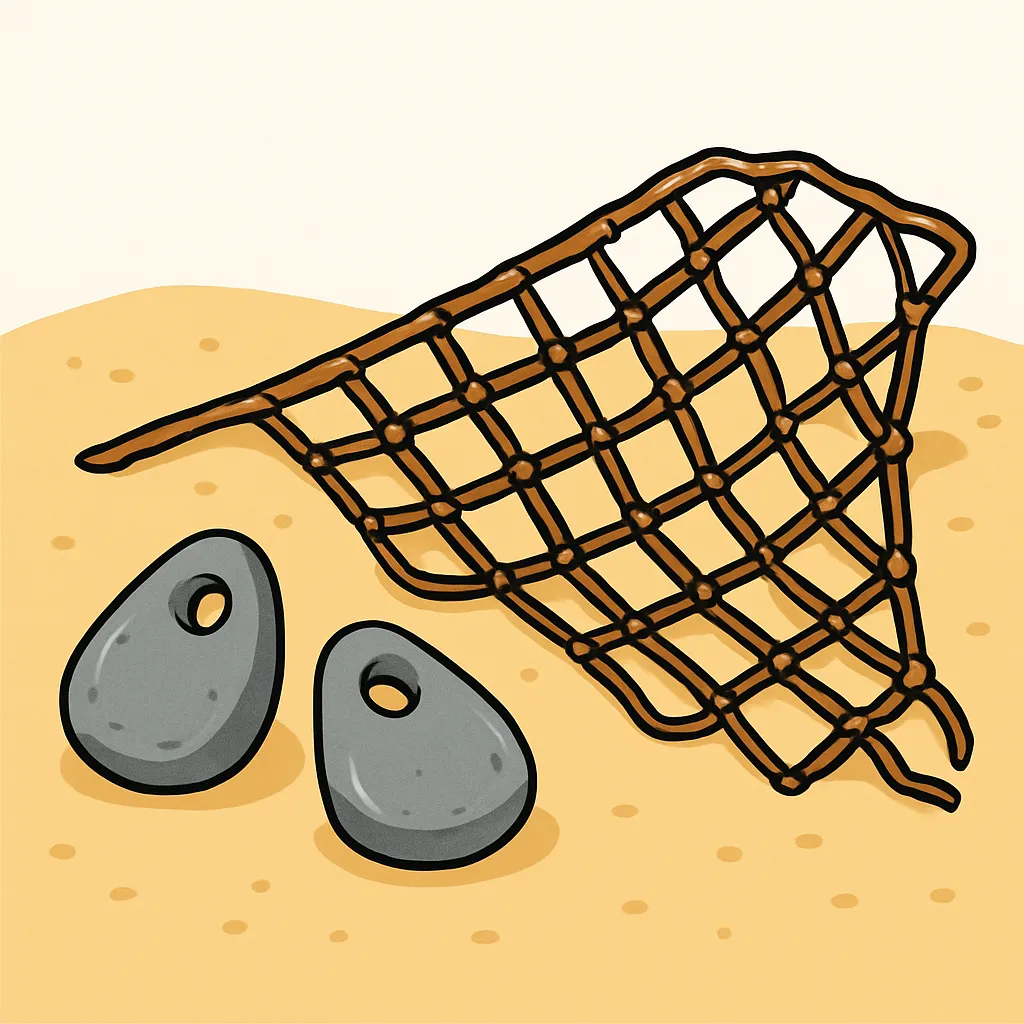
In the ruins of a coastal village, archaeologists uncover thousands of fish bones and dozens of small stone net weights. What does this evidence most directly support?
A photograph of a battlefield taken fifty years after the battle is a primary source about the battle.
A chart in a report gives no author, no date, and no source for its numbers. Why is it weaker evidence than the same chart with all three given?
A merchant's diary from 1400 calls a city market fair and profitable. A farmers' petition from the same city and year complains that market fees are far too high. What do the two sources mainly show?
A student copies a chart from a museum website into a report and writes the museum's name and the page's date underneath it. What is the student doing?
Crack the passcode before the zombies get in.

Pick a tile, answer, hit bonuses and steals.

Citing Sources and Avoiding Plagiarism
40 questions