Loading
by BlastRoom
Task 1 prompts that carry two figures. Every item shows both and asks for the sentence that links them, so the answer holds a value from each rather than reporting one chart and then the other.
#writing_task_1#ielts_6_0
25 questions
One question set, multiple game modes. Tap any game to see it in action. Not sure which to pick?
Figure 1 shows rail commuting in Eastford from 2012 to 2022; Figure 2 shows household spending shares in 2022. Which sentence uses both figures?
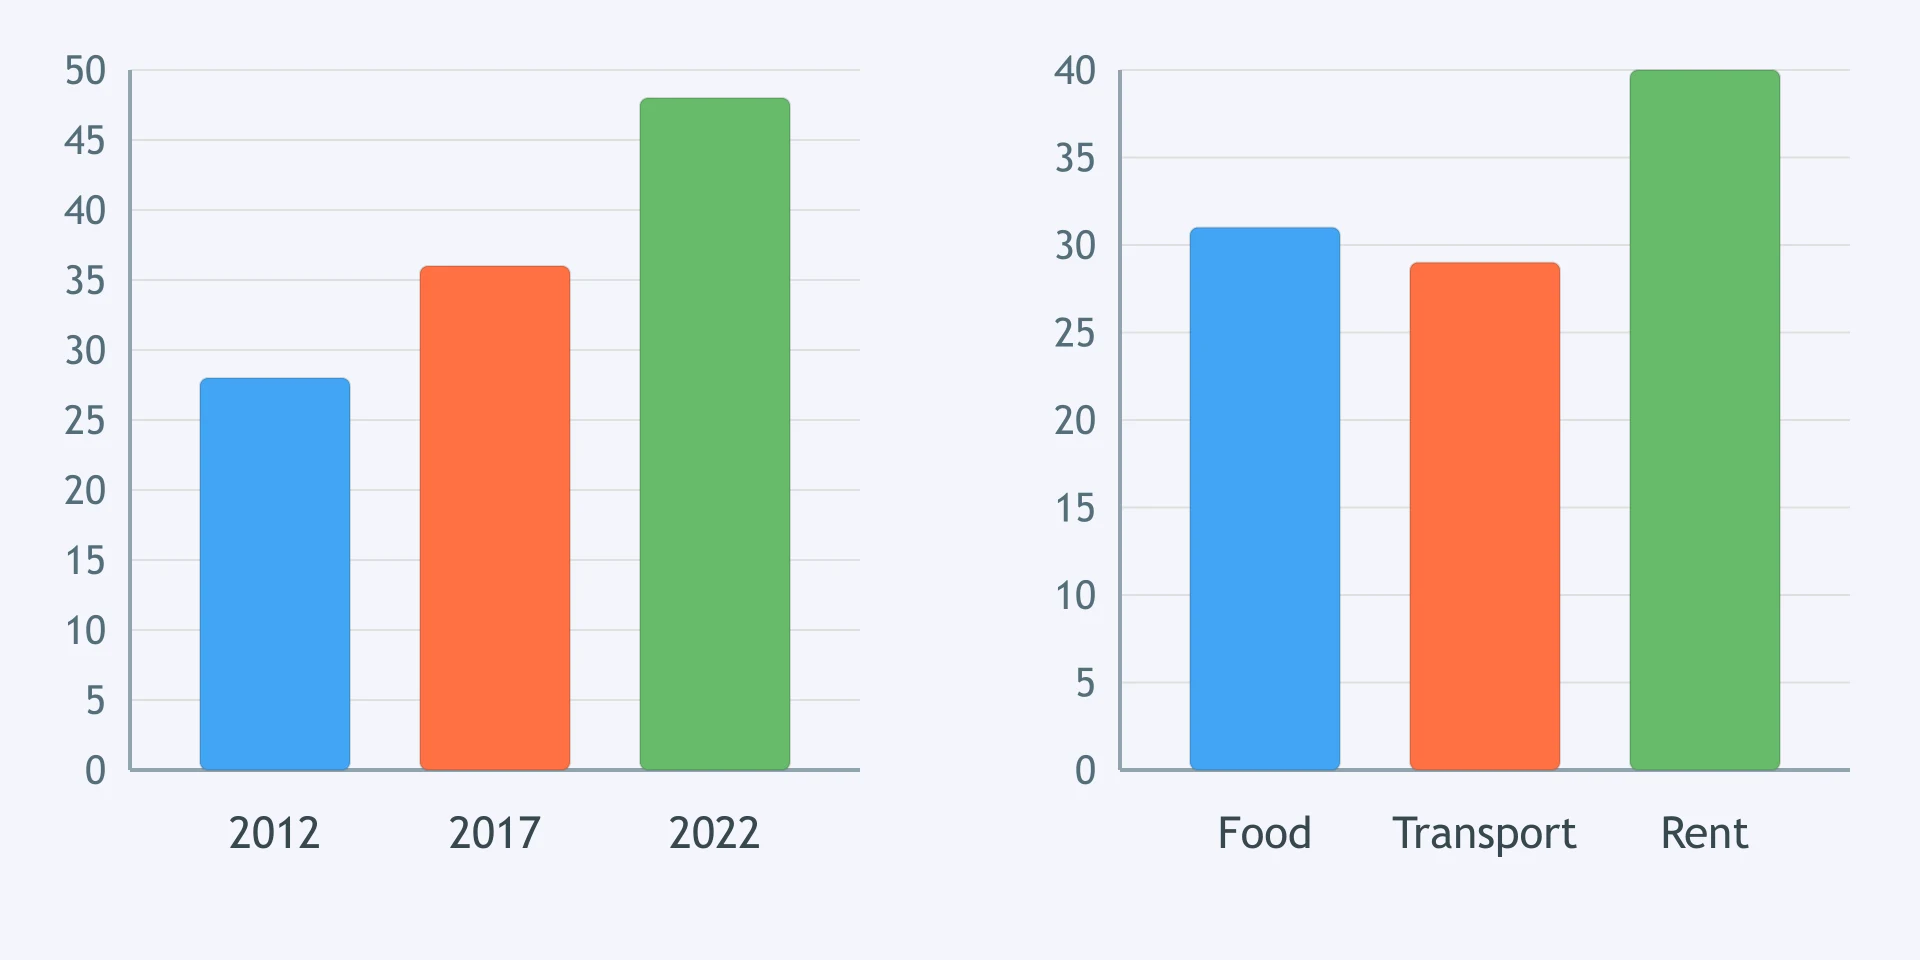
One figure compares electricity sources; the other compares electricity use by sector. Which sentence draws on both figures?
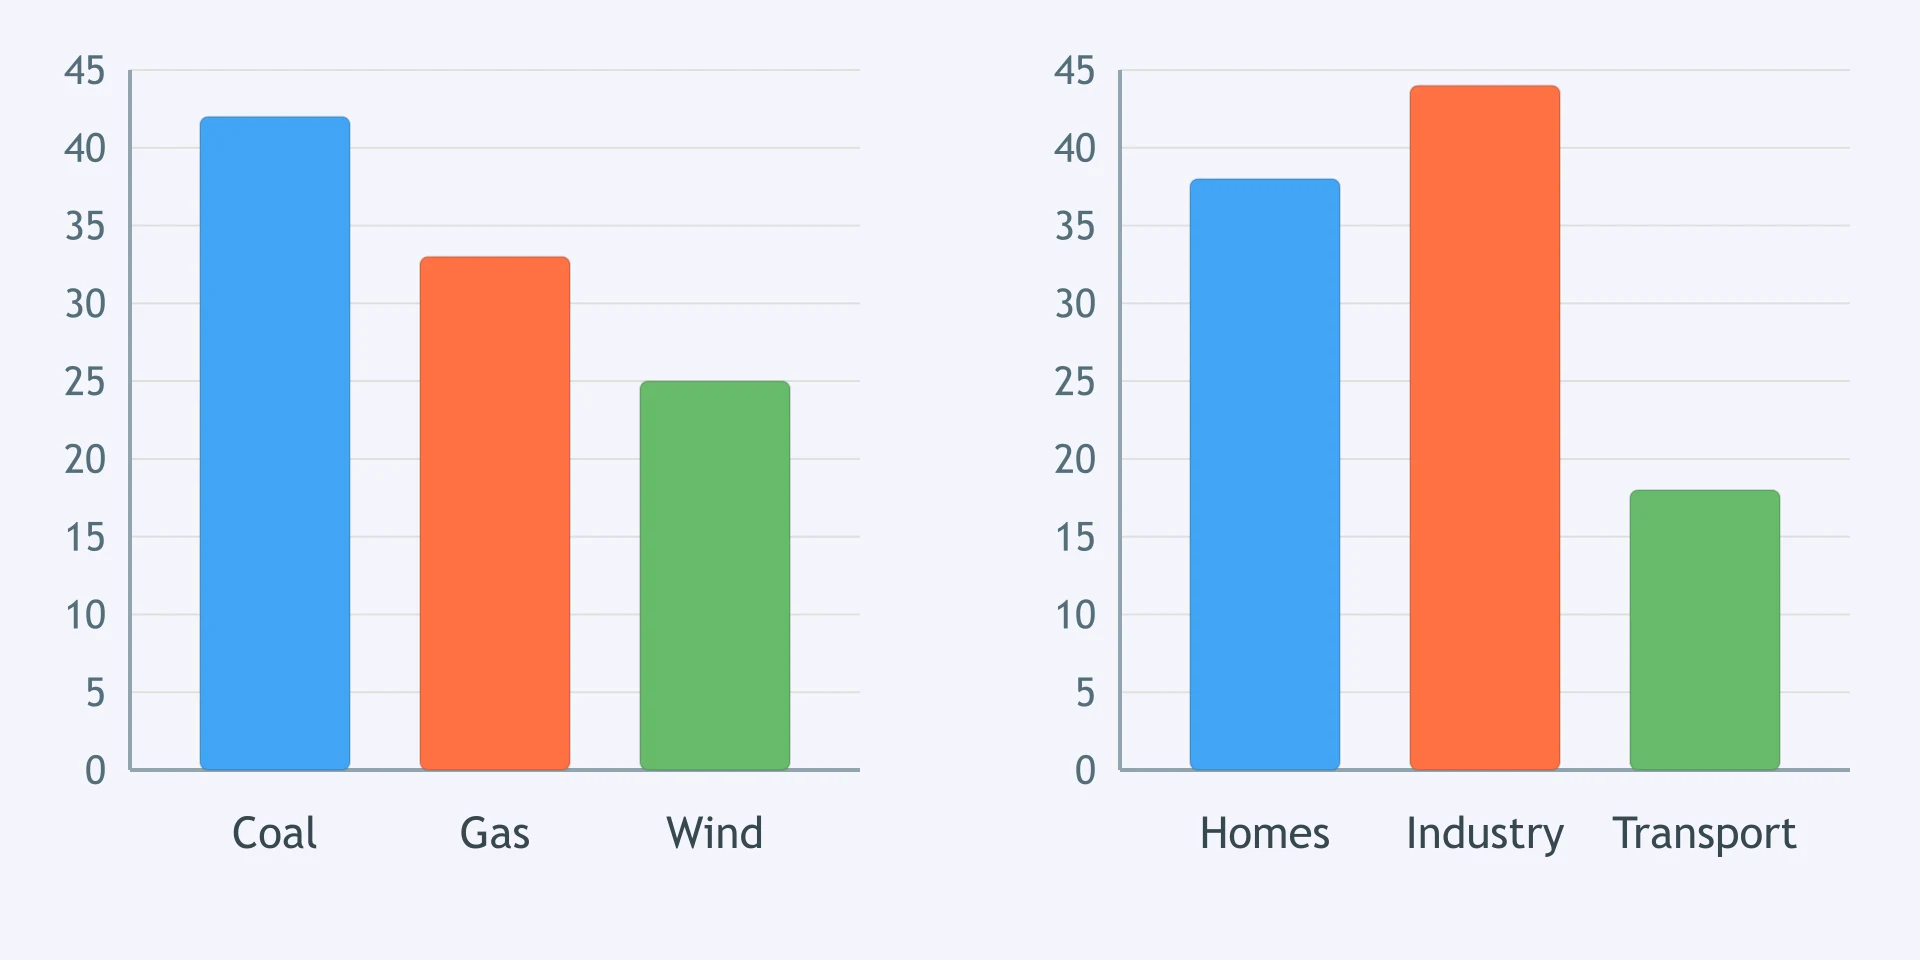
Figure 1 gives course enrolment by qualification; Figure 2 gives delivery mode. Which sentence reports information from both?
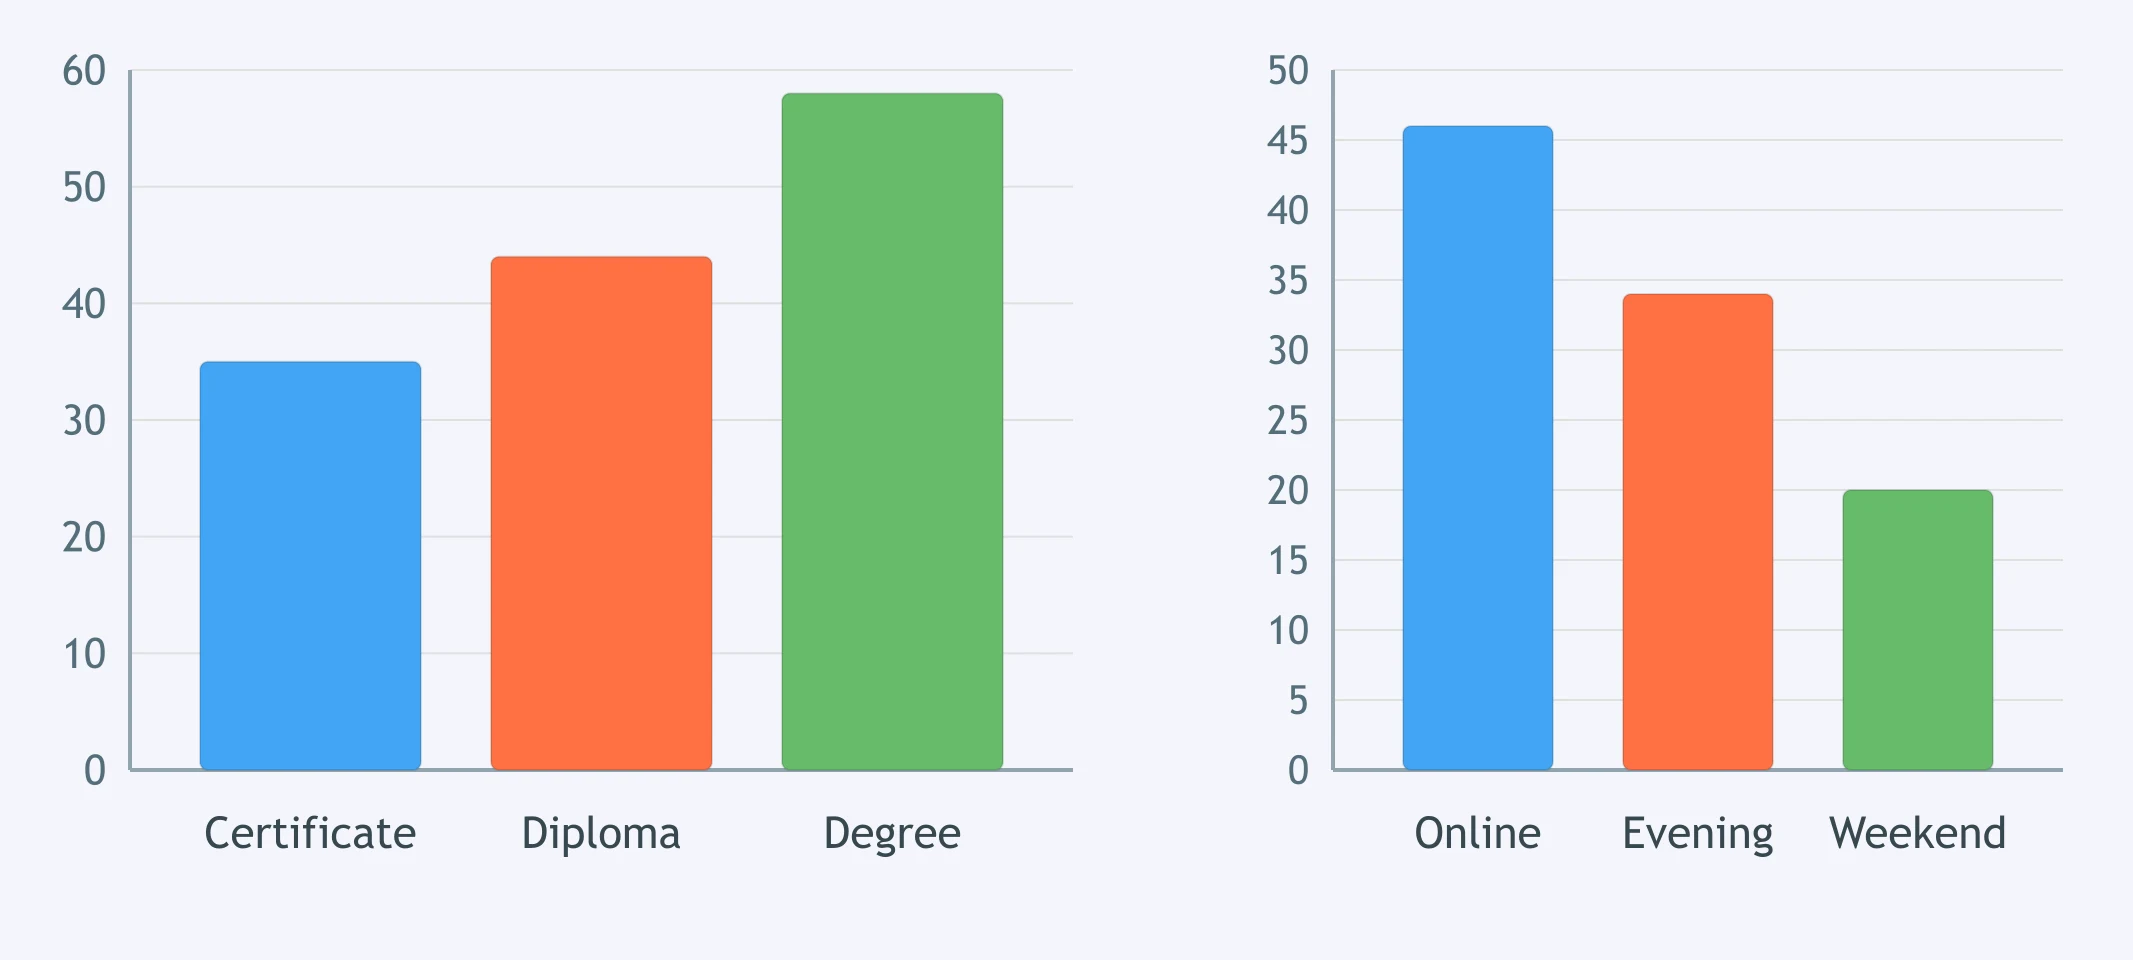
The first figure shows leisure visits by venue; the second shows the age profile of visitors. Which sentence links the two figures?
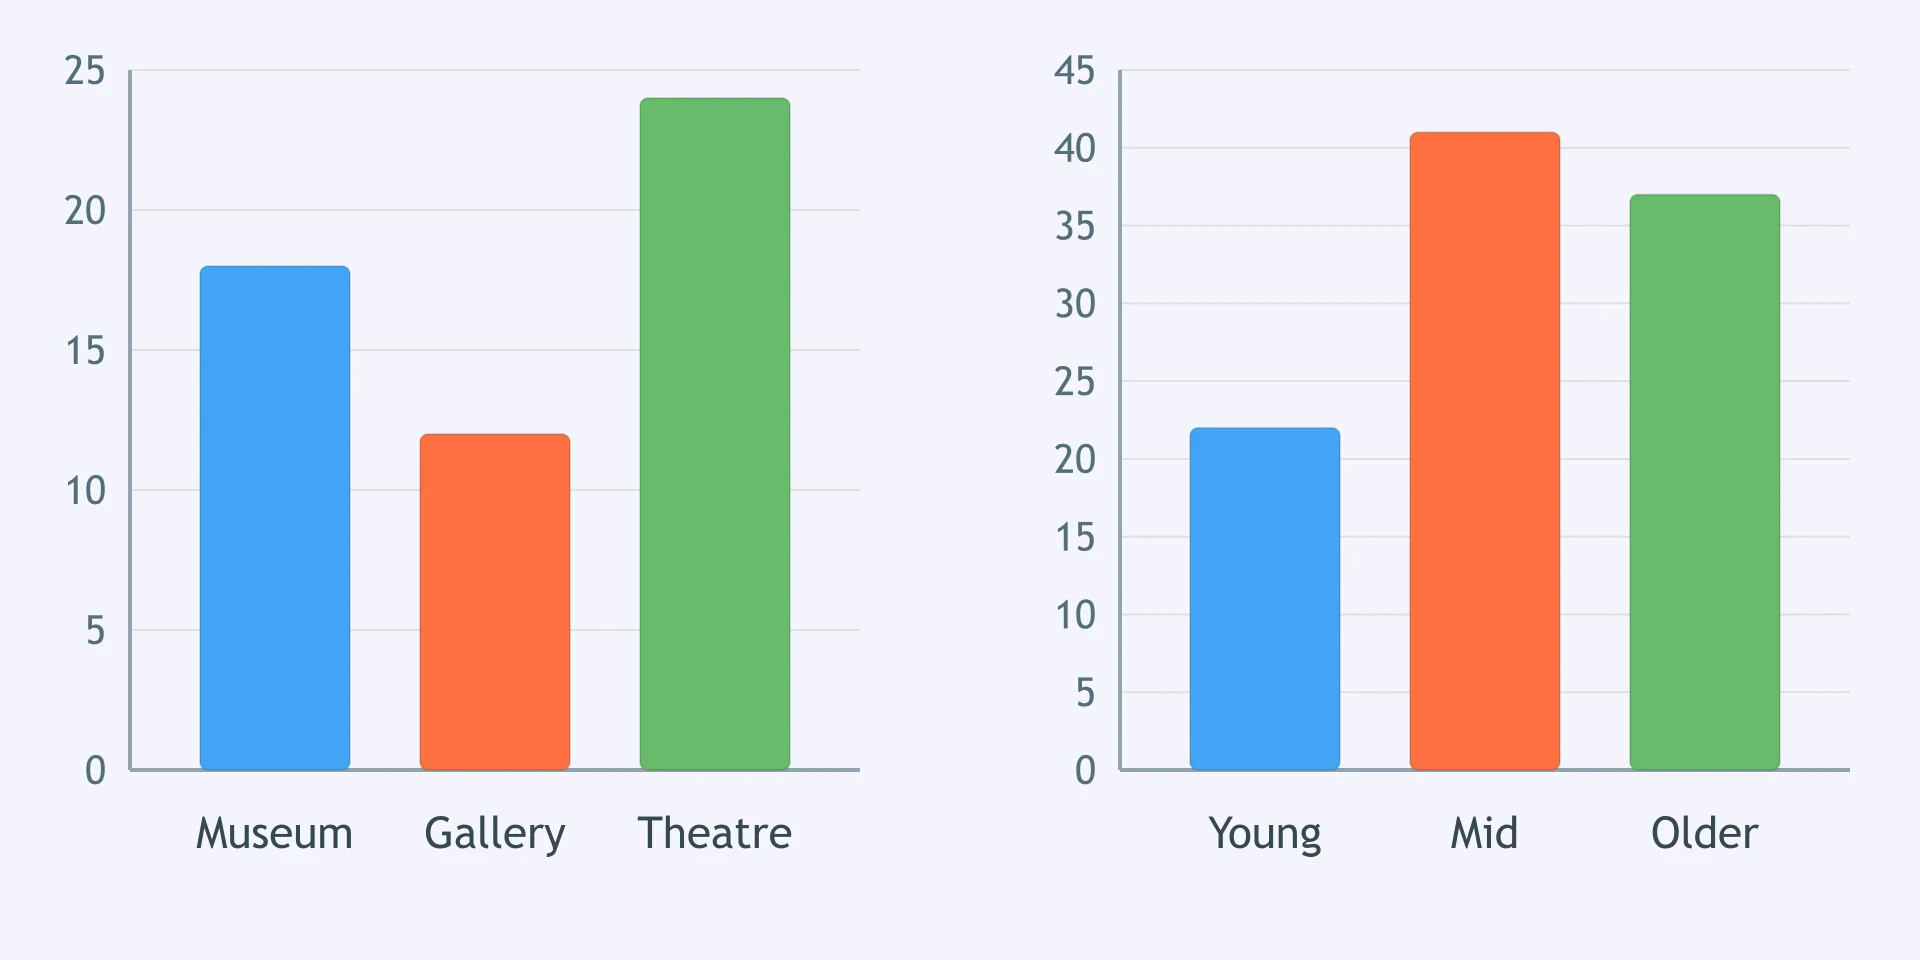
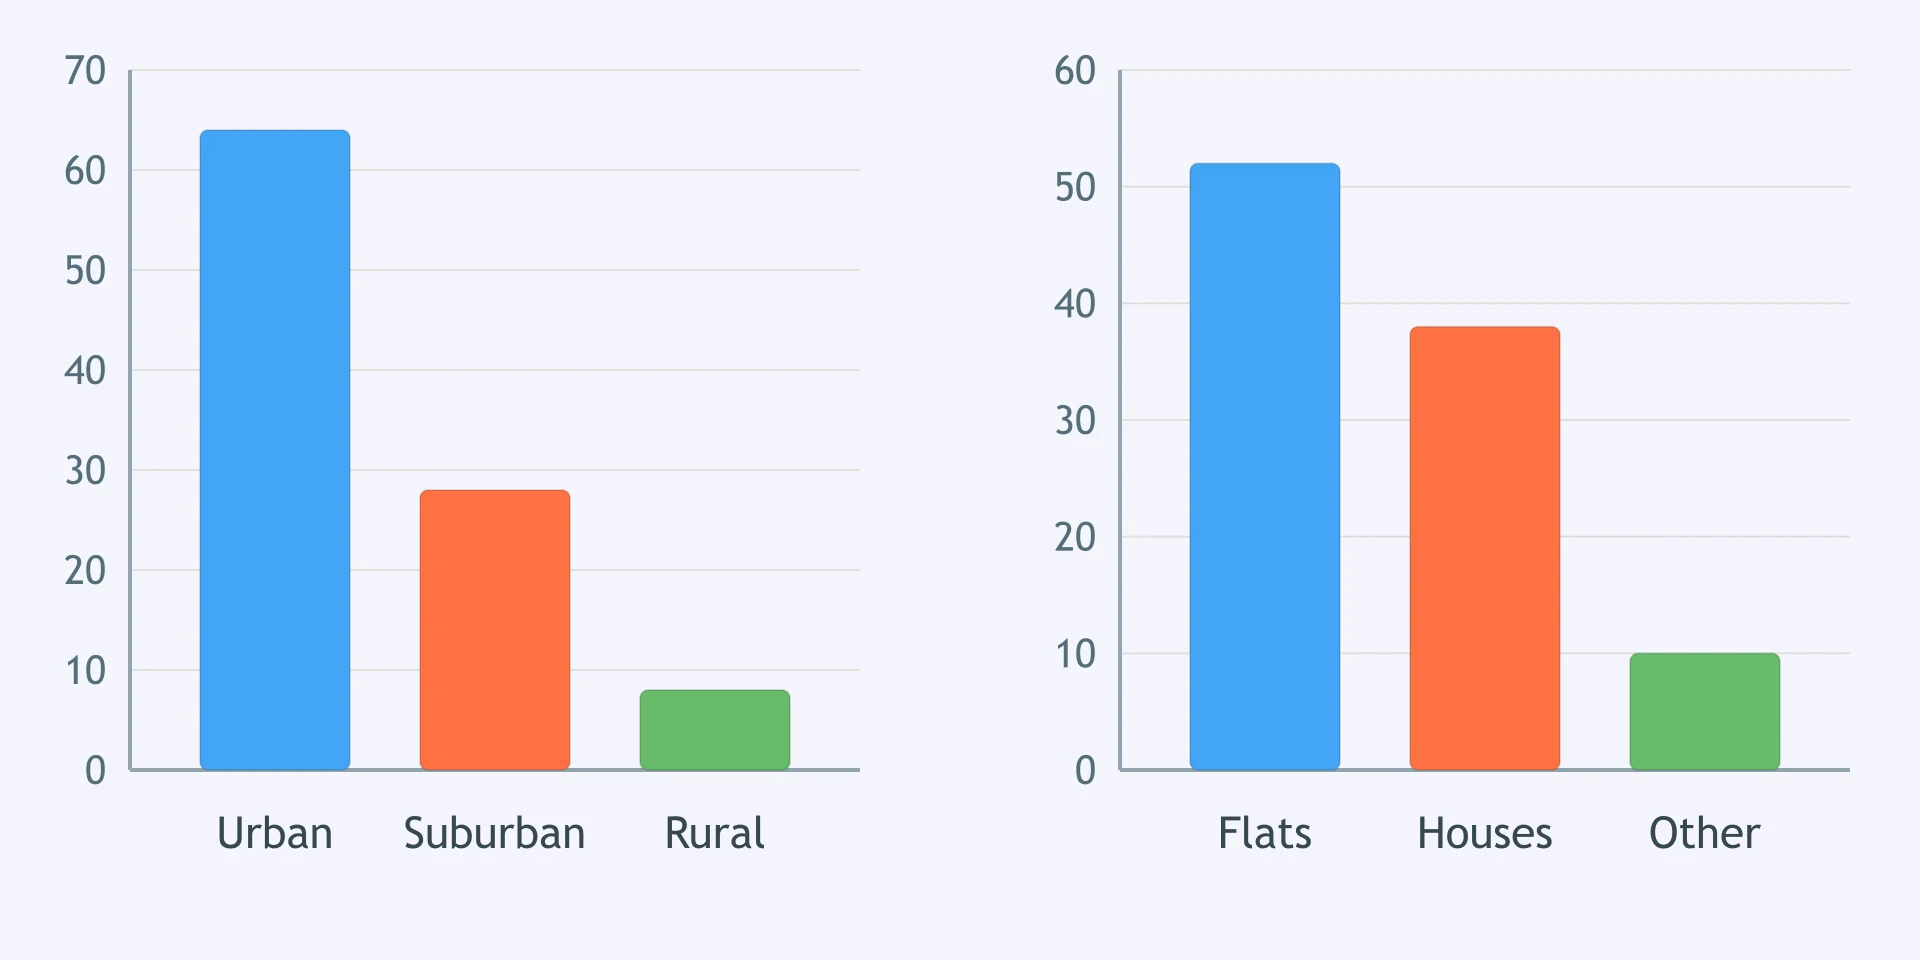
Figure 1 shows population distribution by area; Figure 2 shows housing type. Choose the sentence that uses both figures.
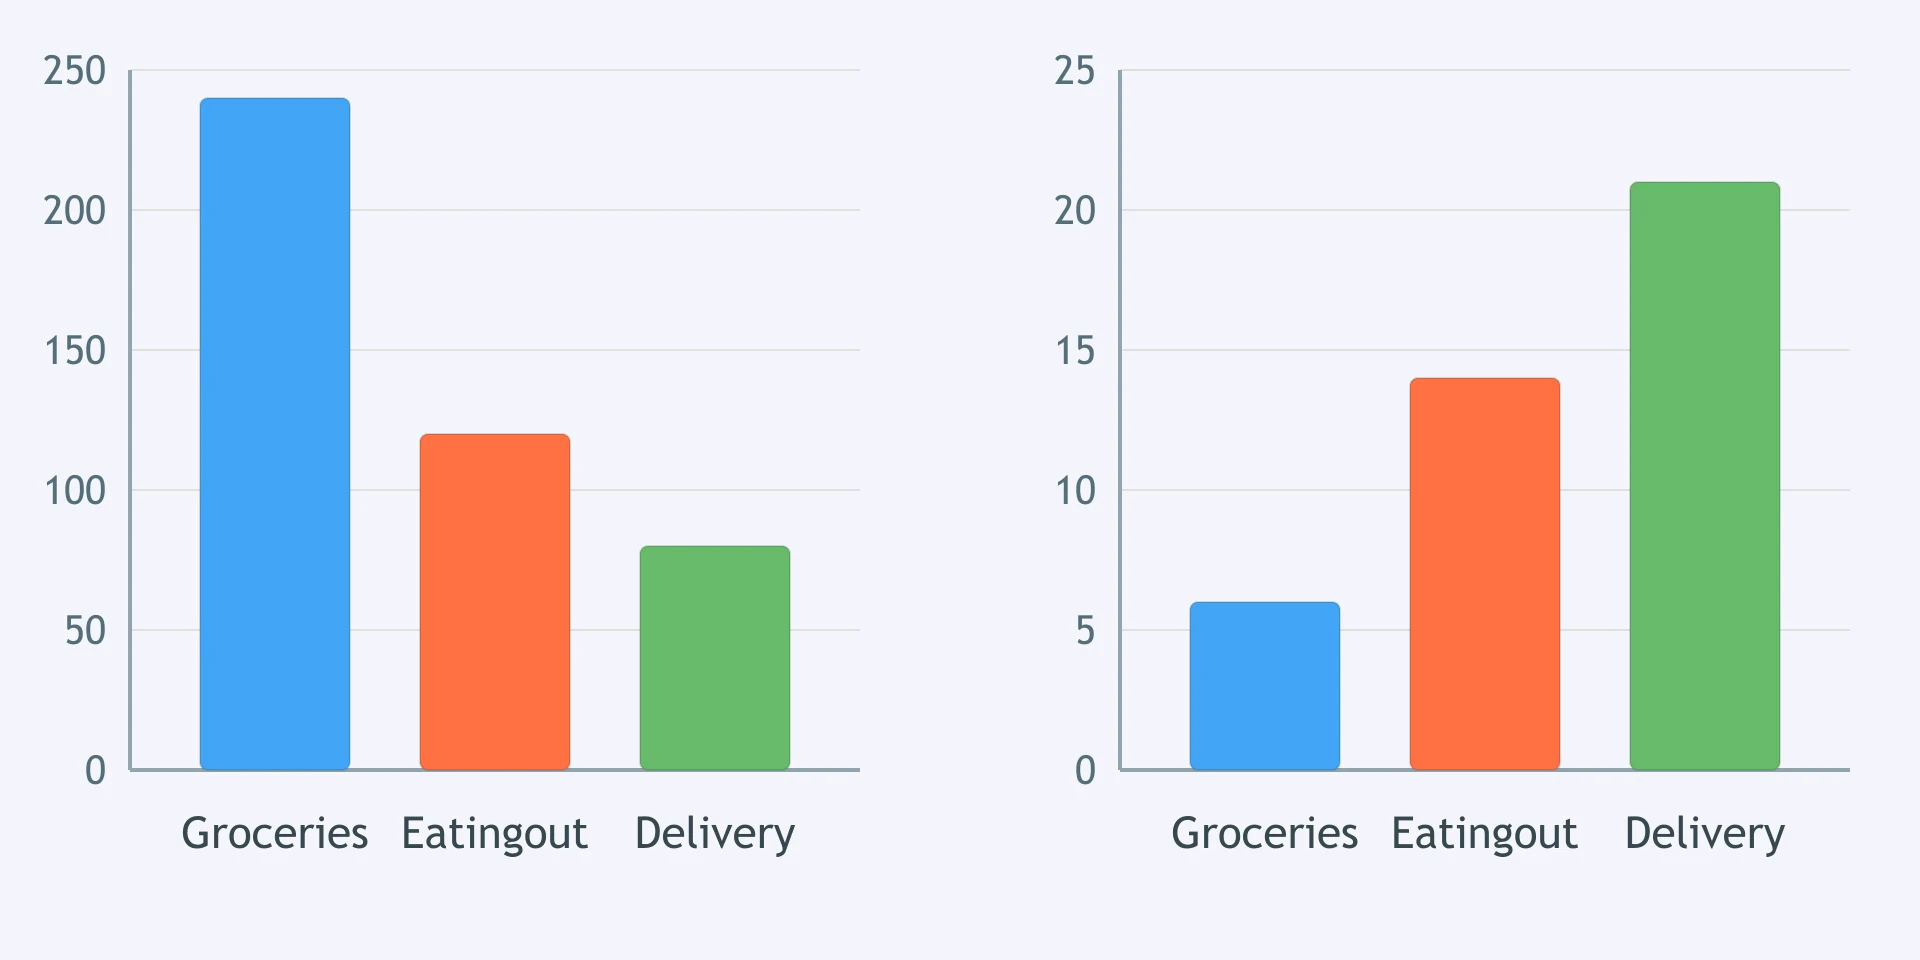
One figure shows weekly food spending by category; the other shows price rises for the same categories. Which sentence draws on both?
The first figure gives paid working hours; the second gives unpaid care hours for the same age groups. Which comparison is accurate?
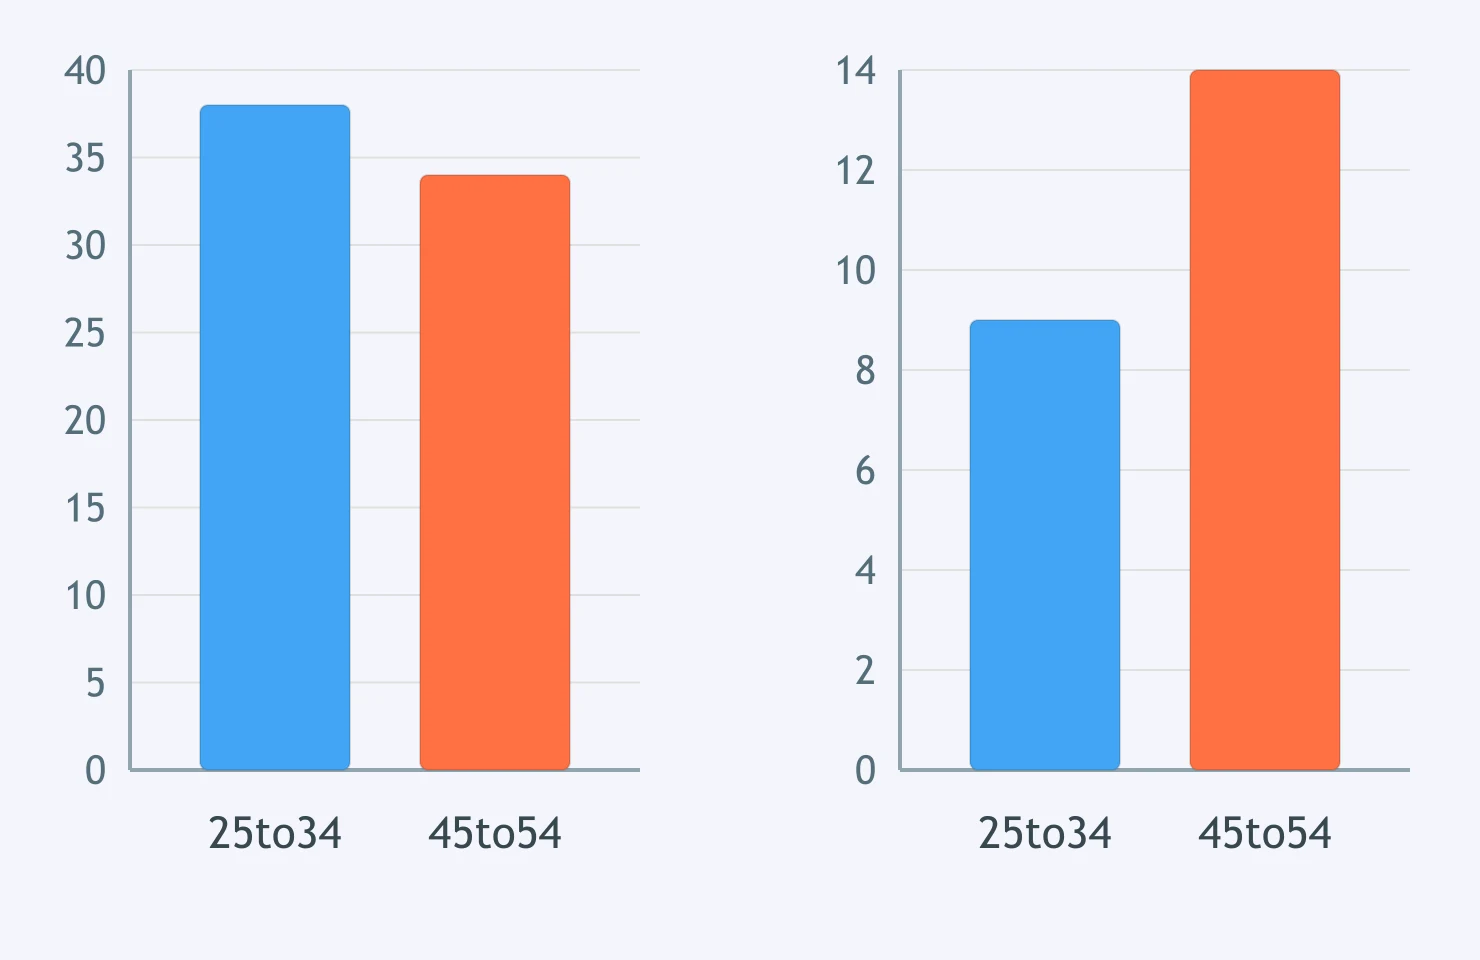
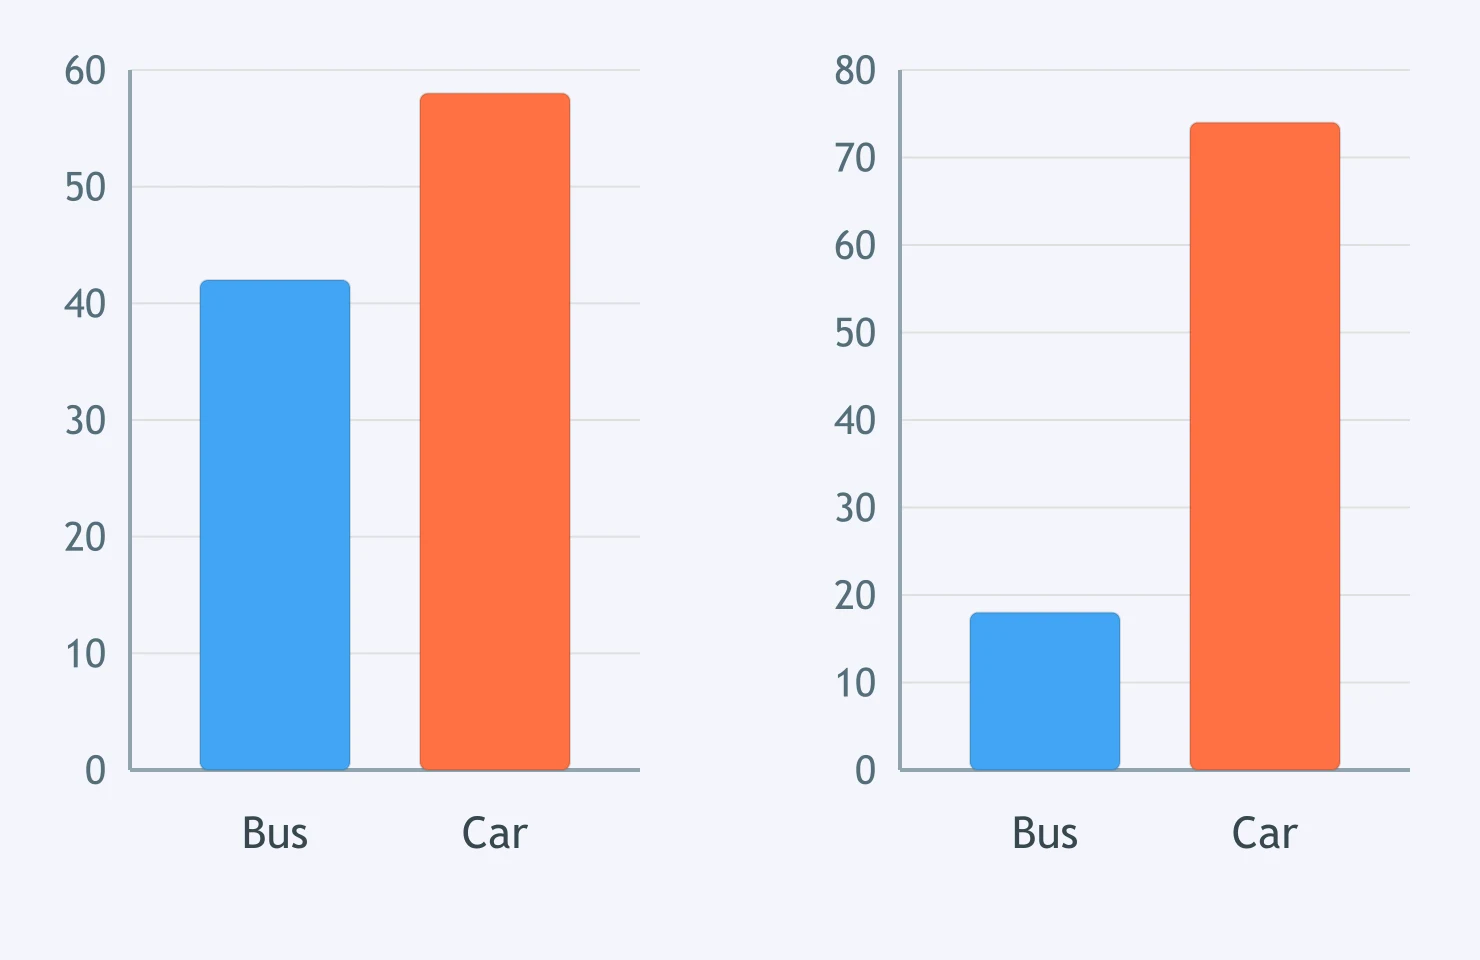
Figure 1 shows trips by mode; Figure 2 shows transport emissions by mode. Which sentence correctly compares buses and cars?
The first figure compares renewable capacity; the second compares cost per unit. Which statement about solar and wind is accurate?
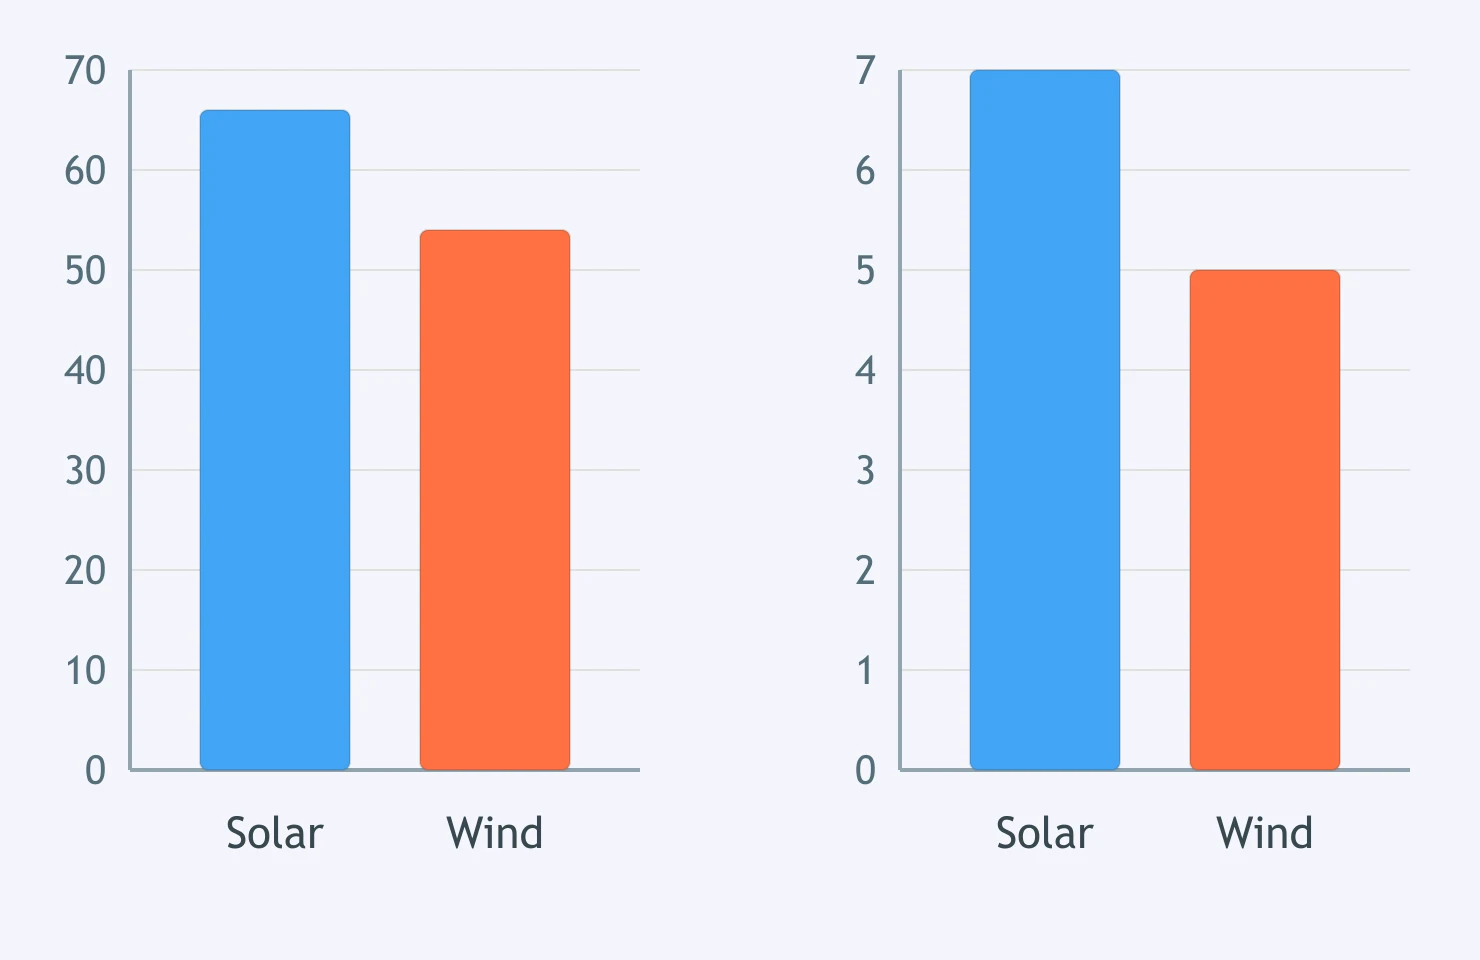
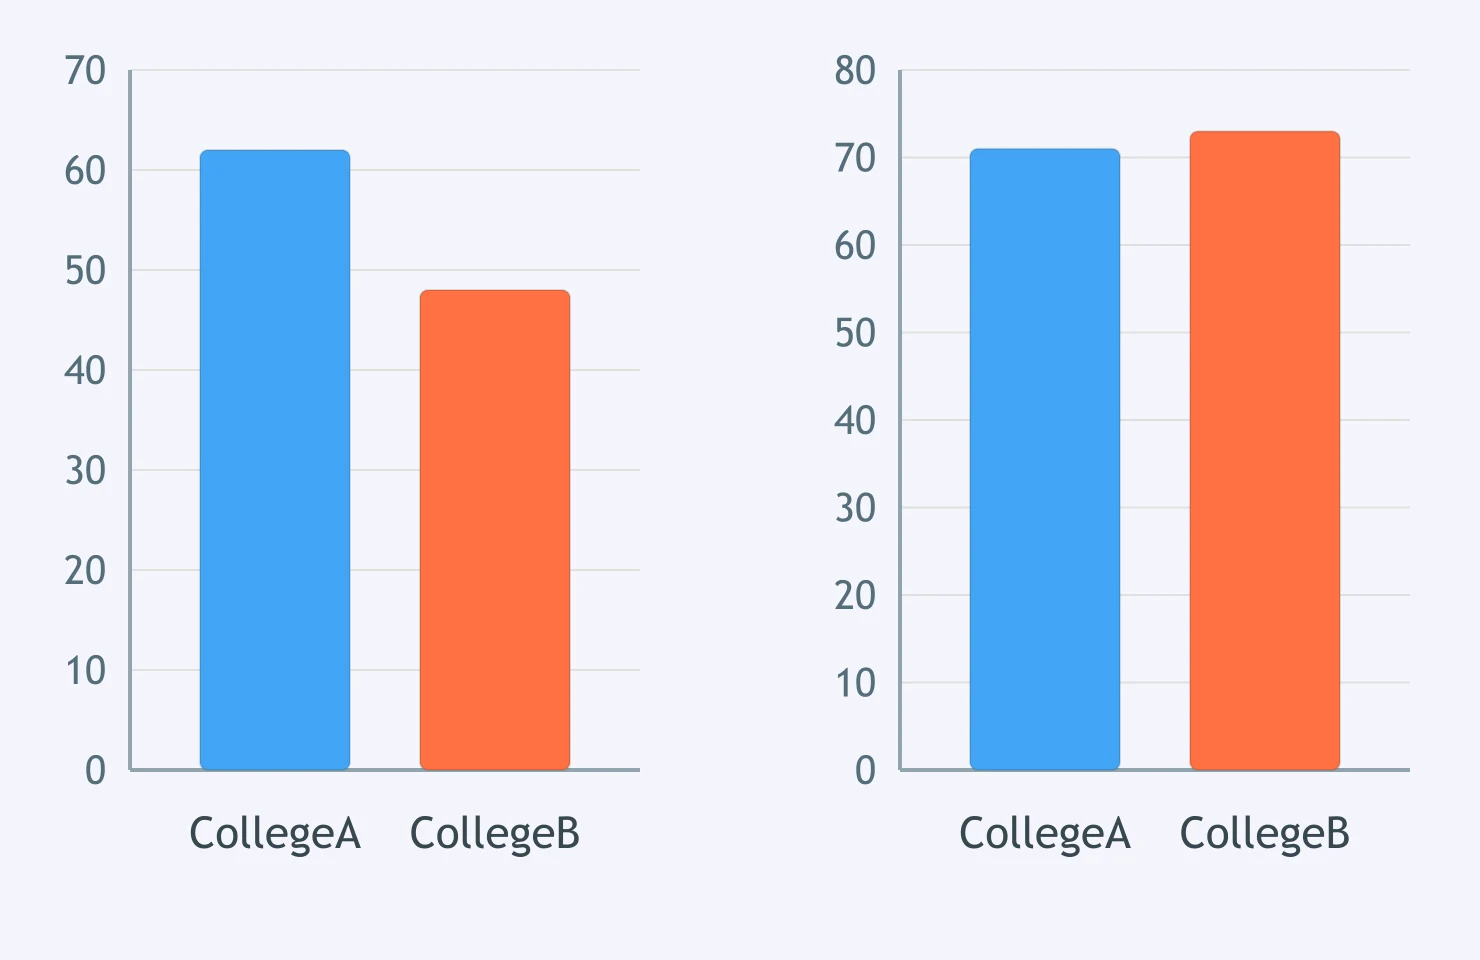
Figure 1 shows study-app use by college; Figure 2 shows pass rates. Which comparison is accurate?
One figure compares city populations; the other gives green space per resident. Which sentence is accurate?
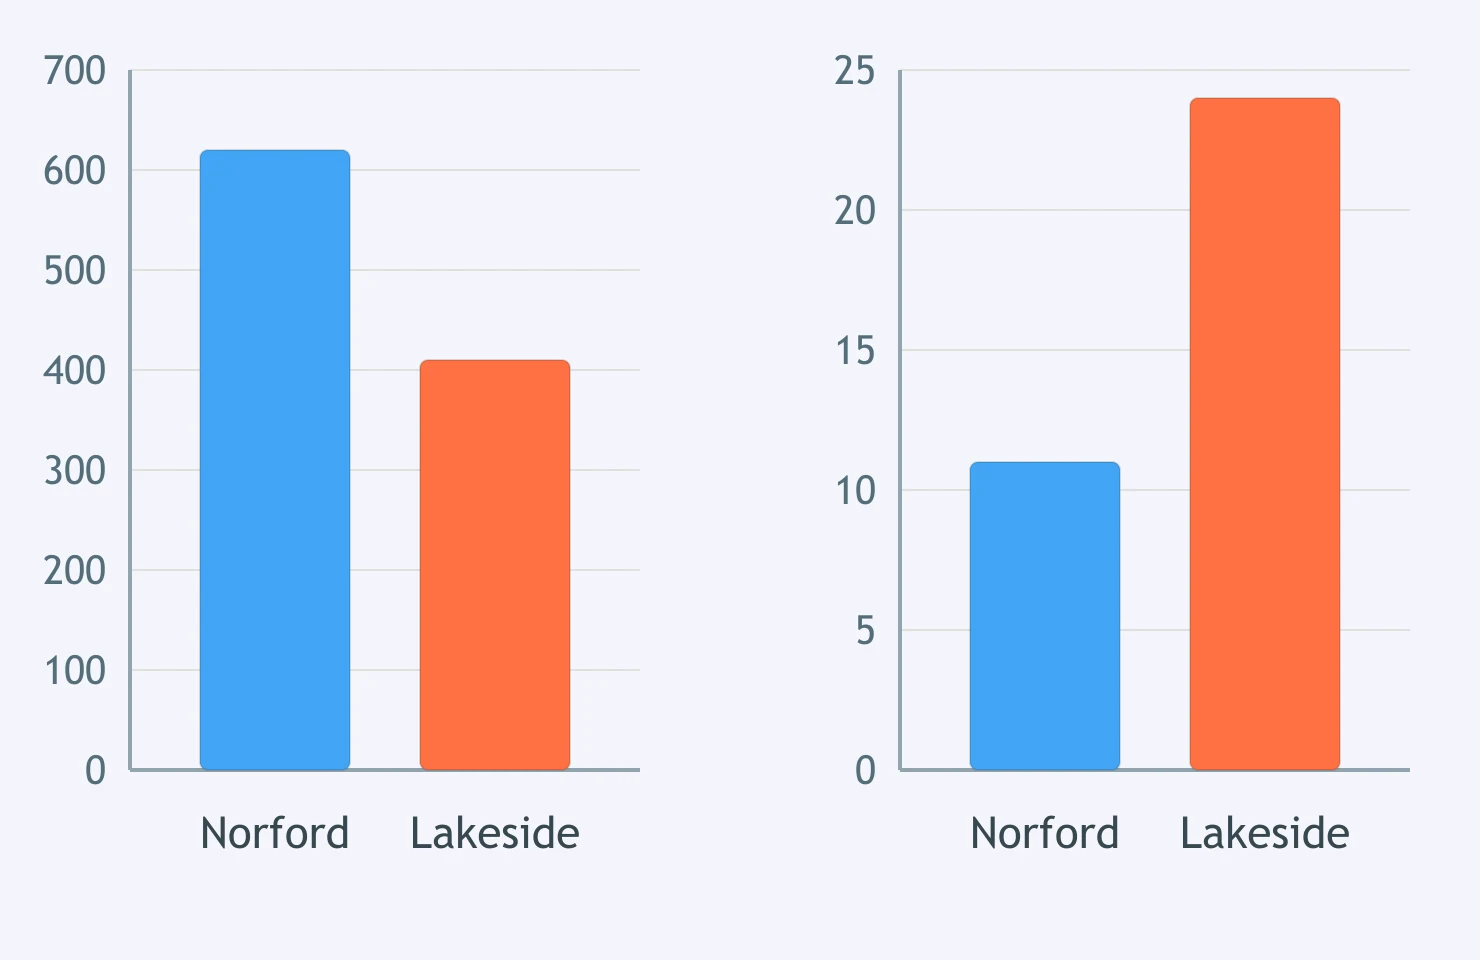
Figure 1 shows council spending on two travel services; Figure 2 shows satisfaction with them. Which comparison is correct?
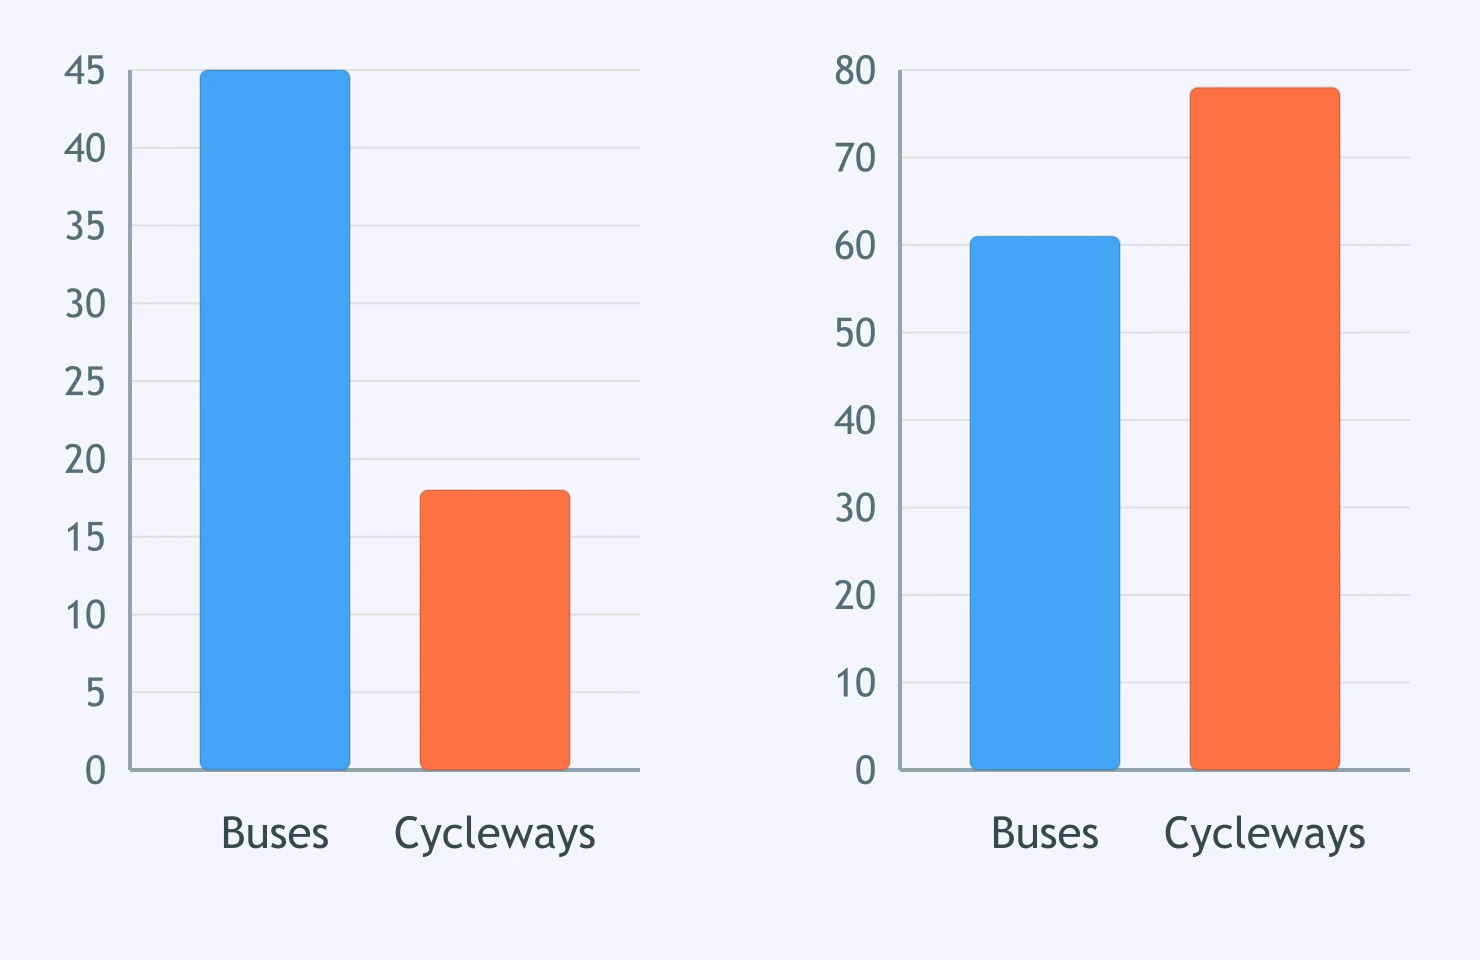
Figure 1 tracks home internet access from 2010 to 2020; Figure 2 shows device shares in 2020. Which overview covers both figures?
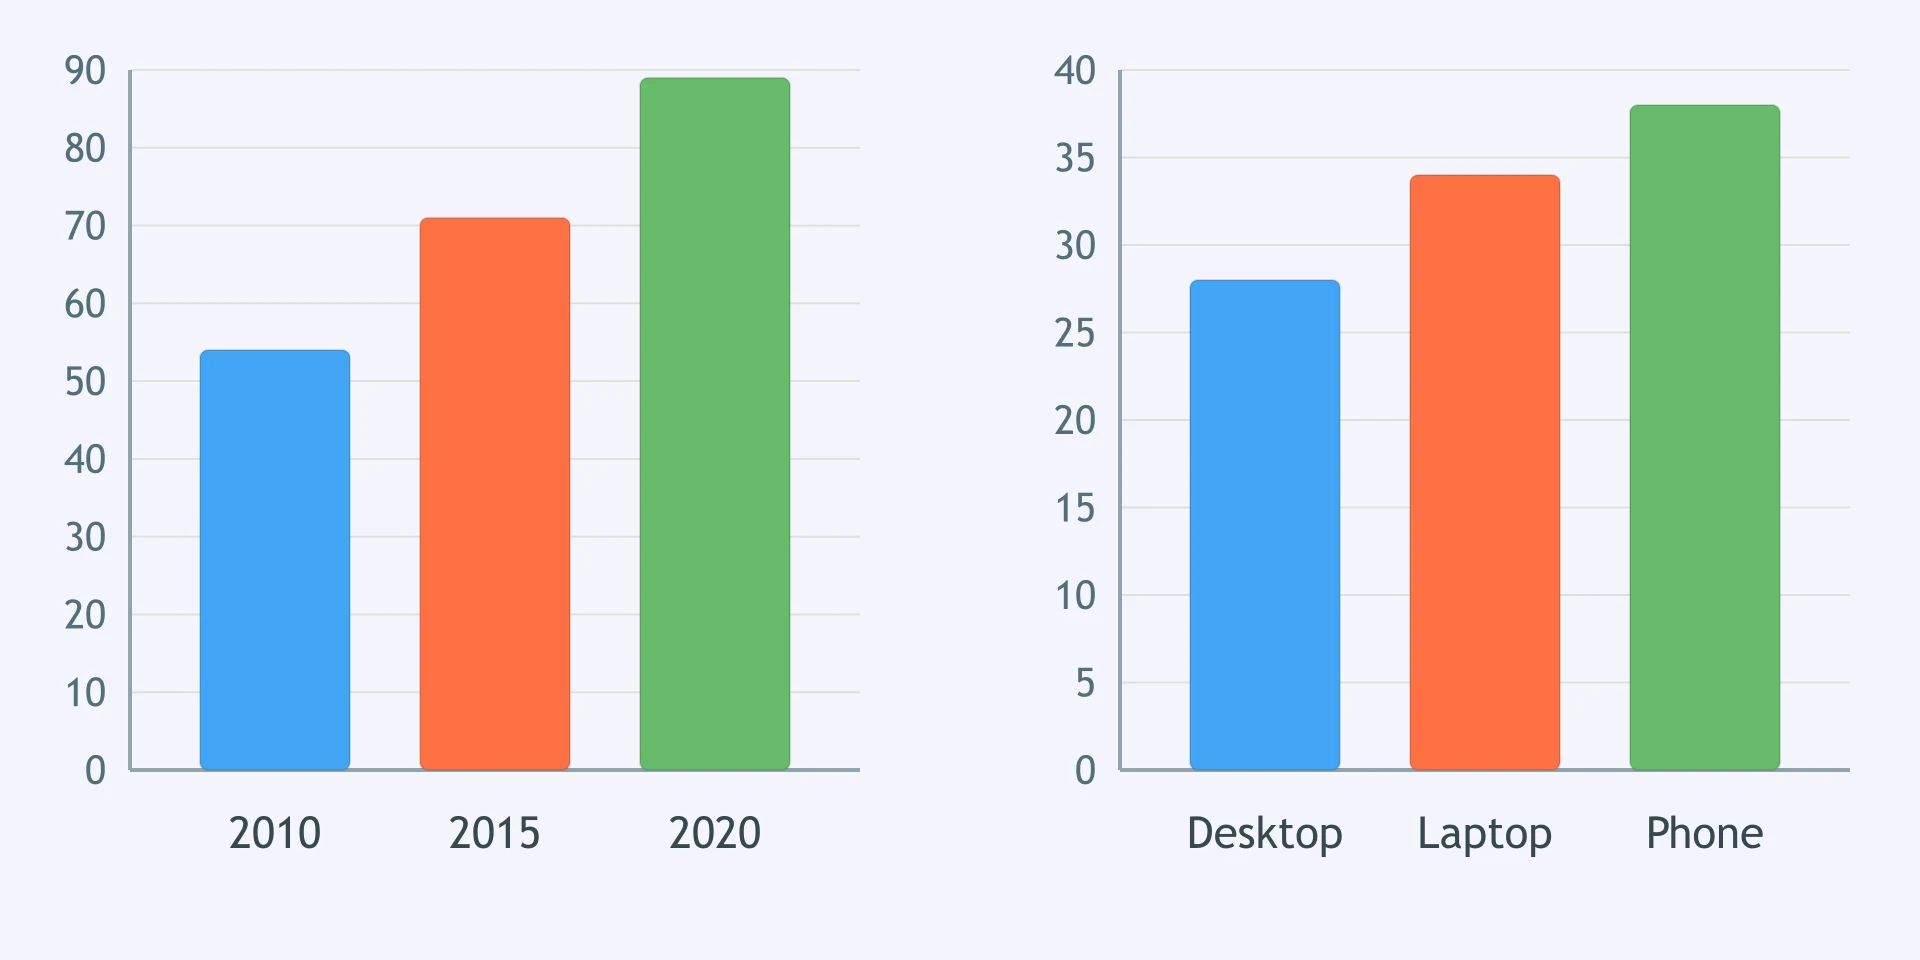
The first figure shows solar capacity over time; the second shows user groups. Which overview works best?
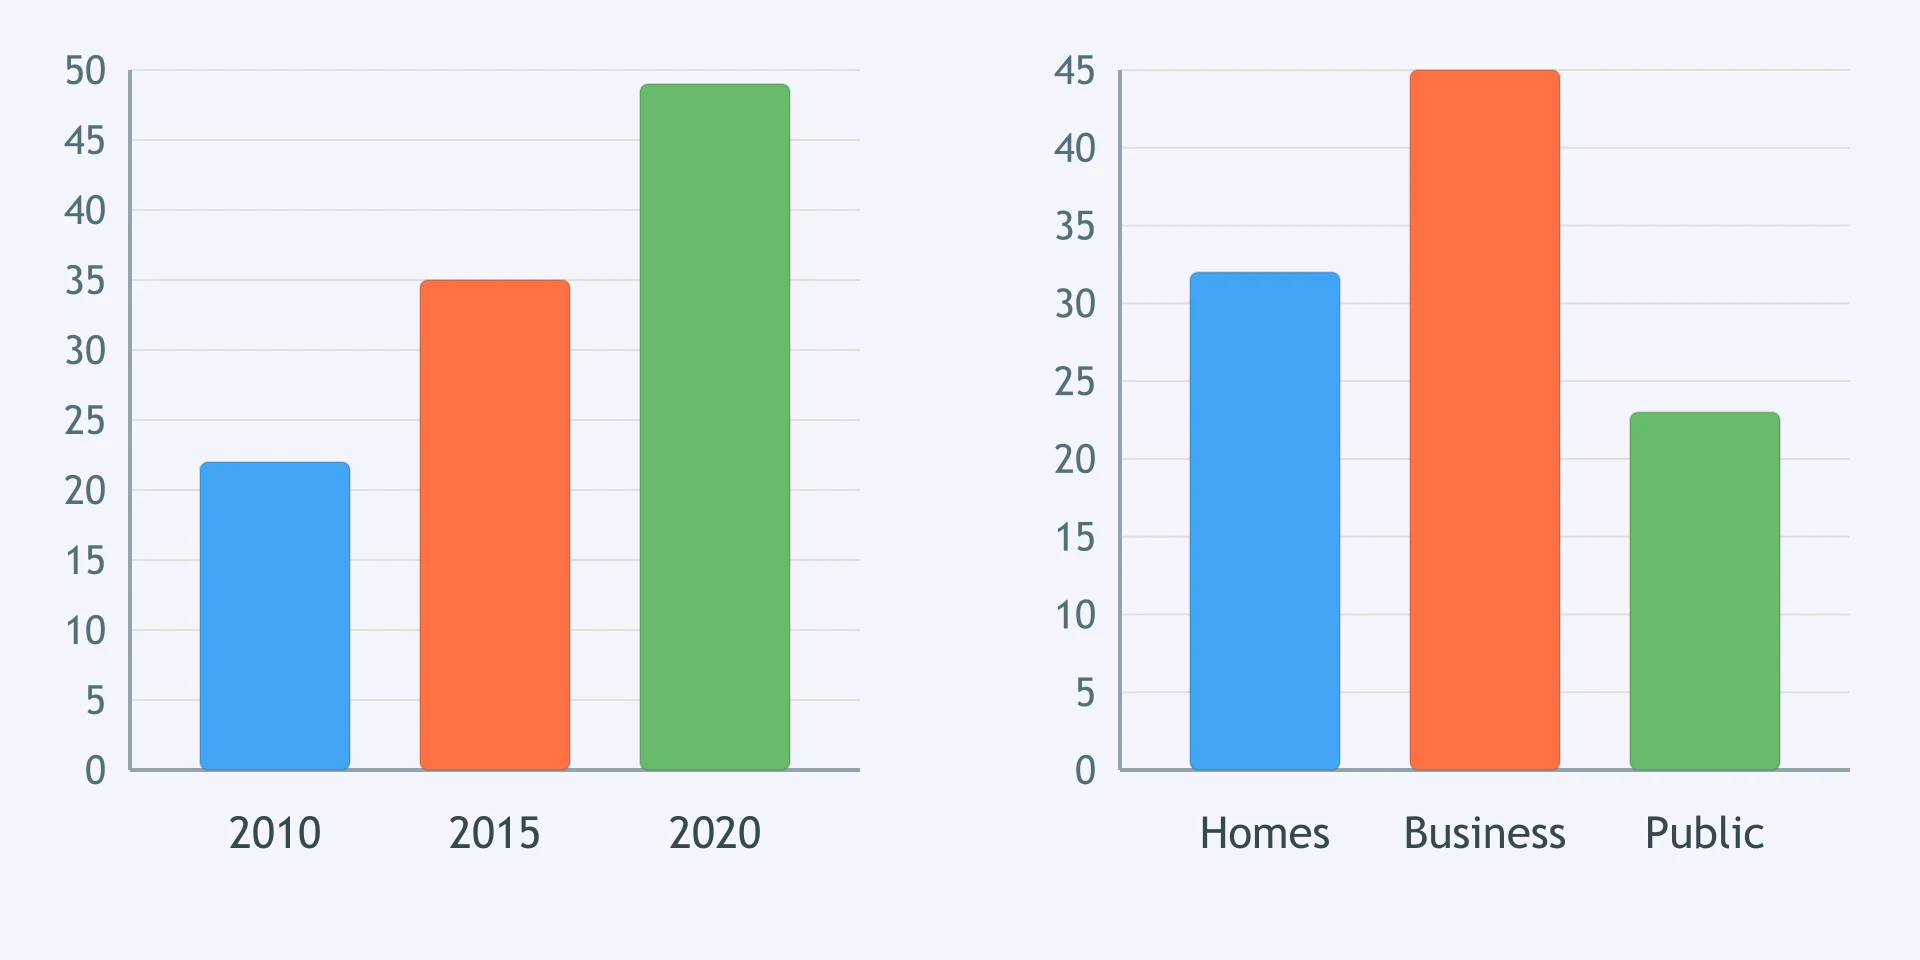
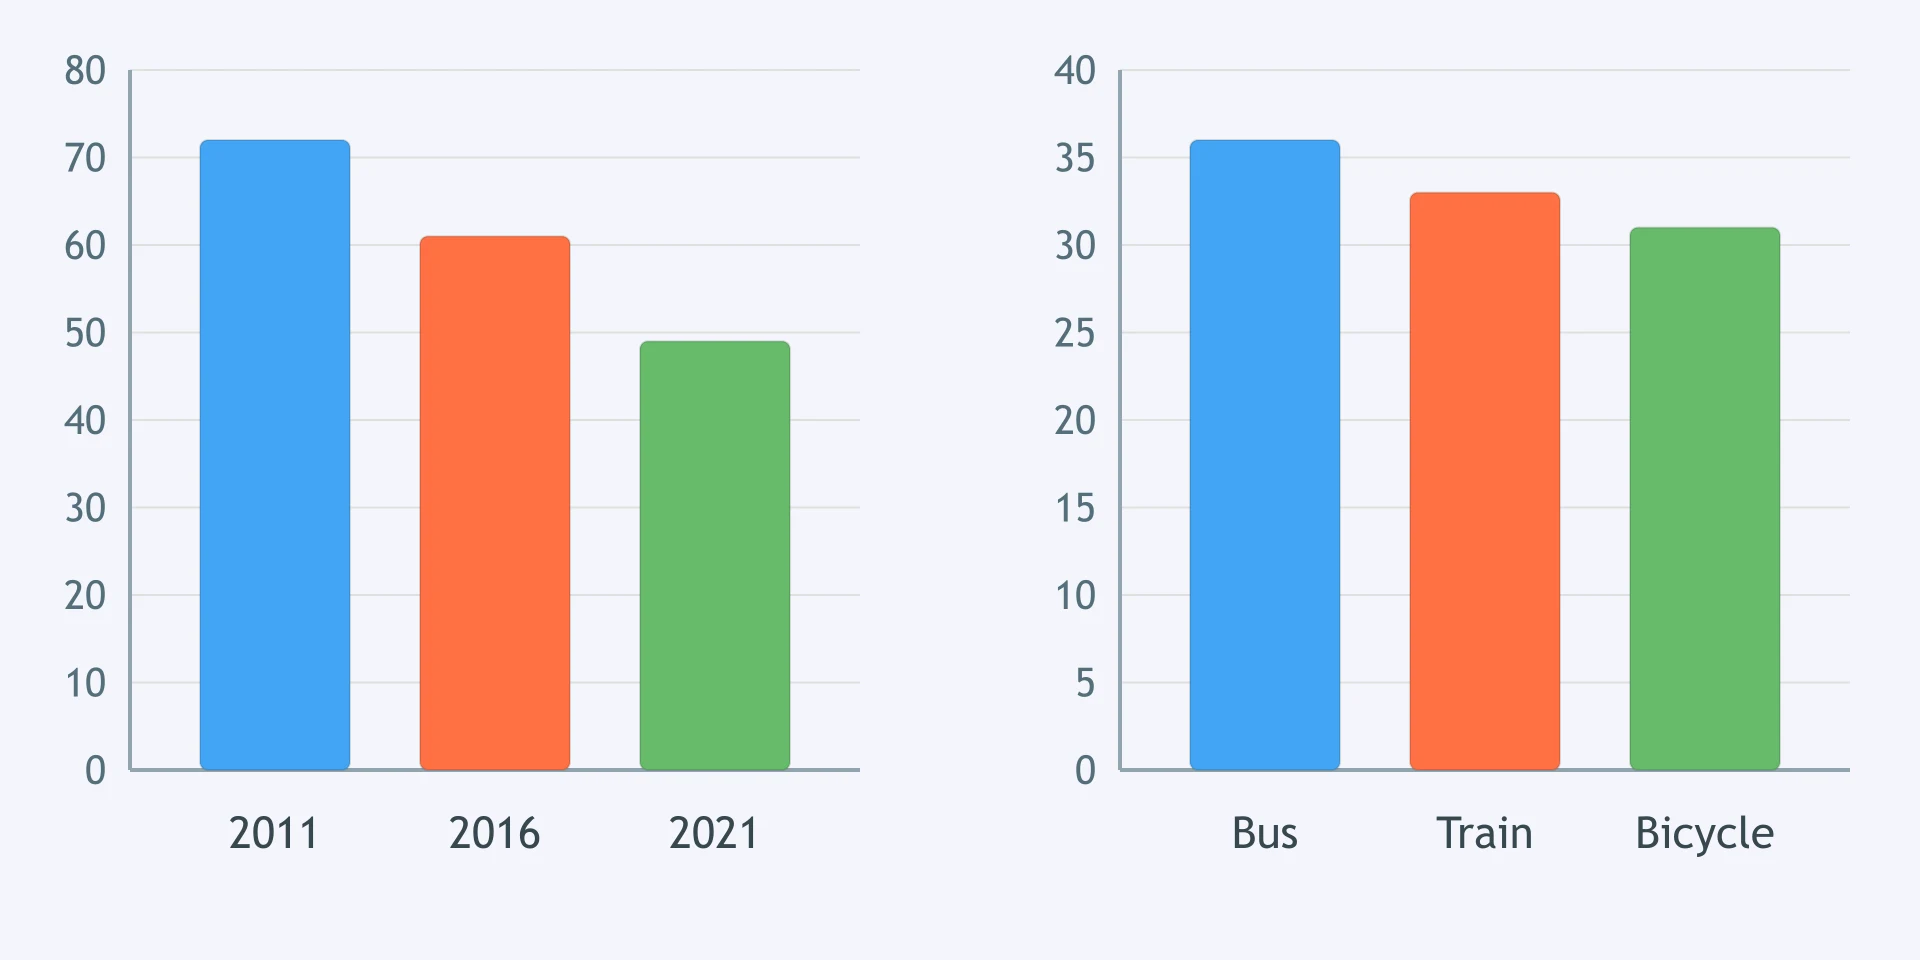
Figure 1 shows car commuting from 2011 to 2021; Figure 2 shows shares of alternative modes in 2021. Which overview covers both?
The first figure shows course enrolments; the second shows completion rates by mode. Which overview reports both figures?
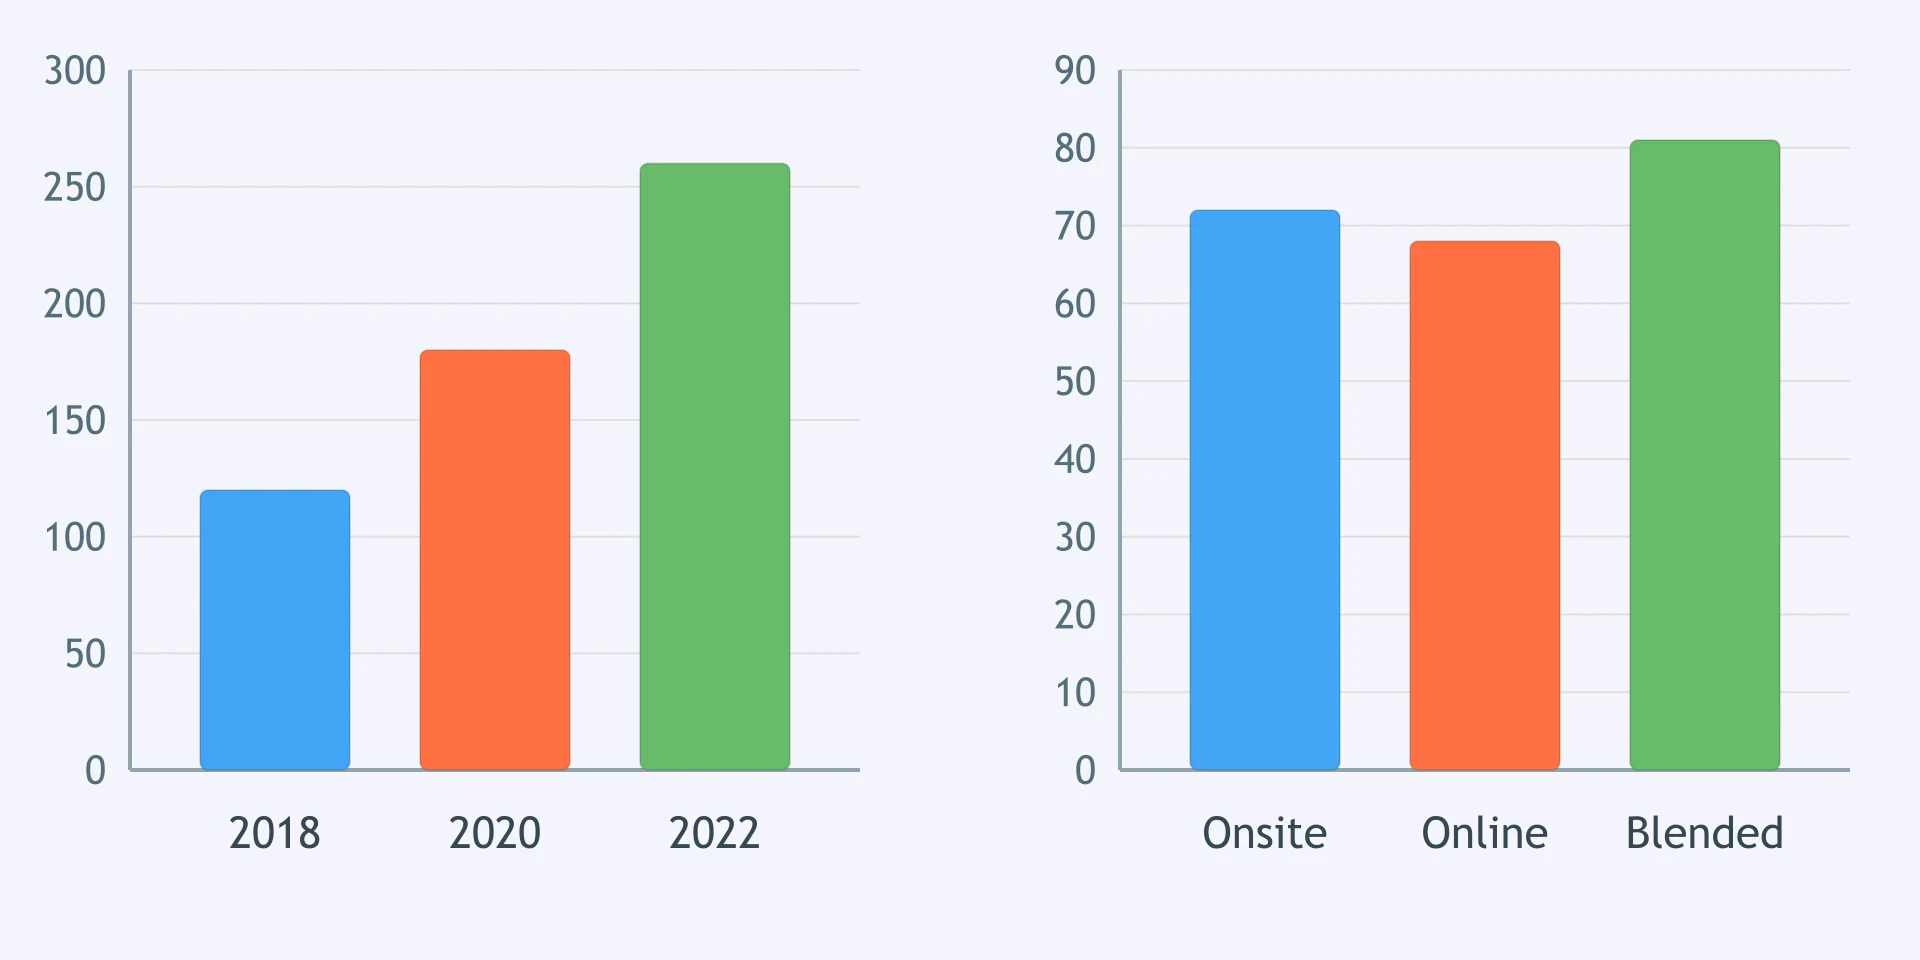
Figure 1 shows water use over time; Figure 2 shows water sources in 2025. Which overview covers both figures?
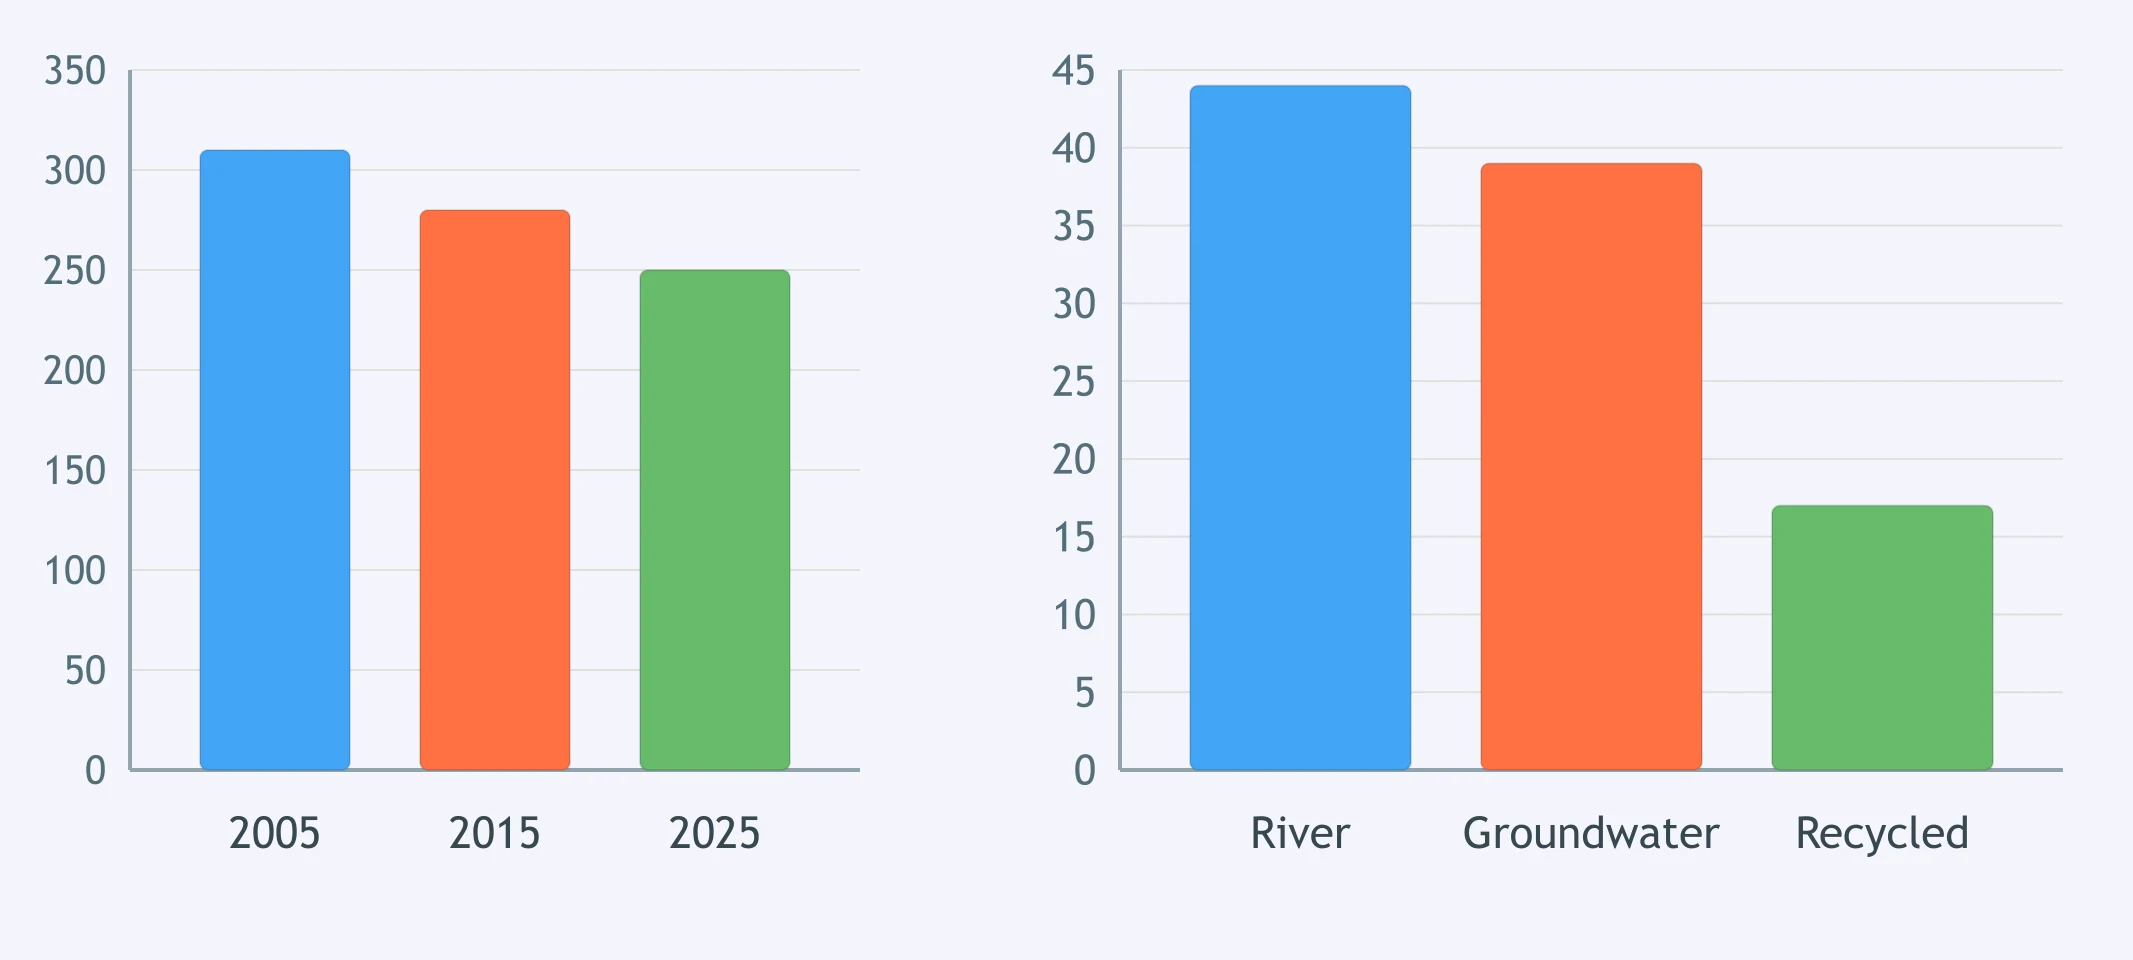
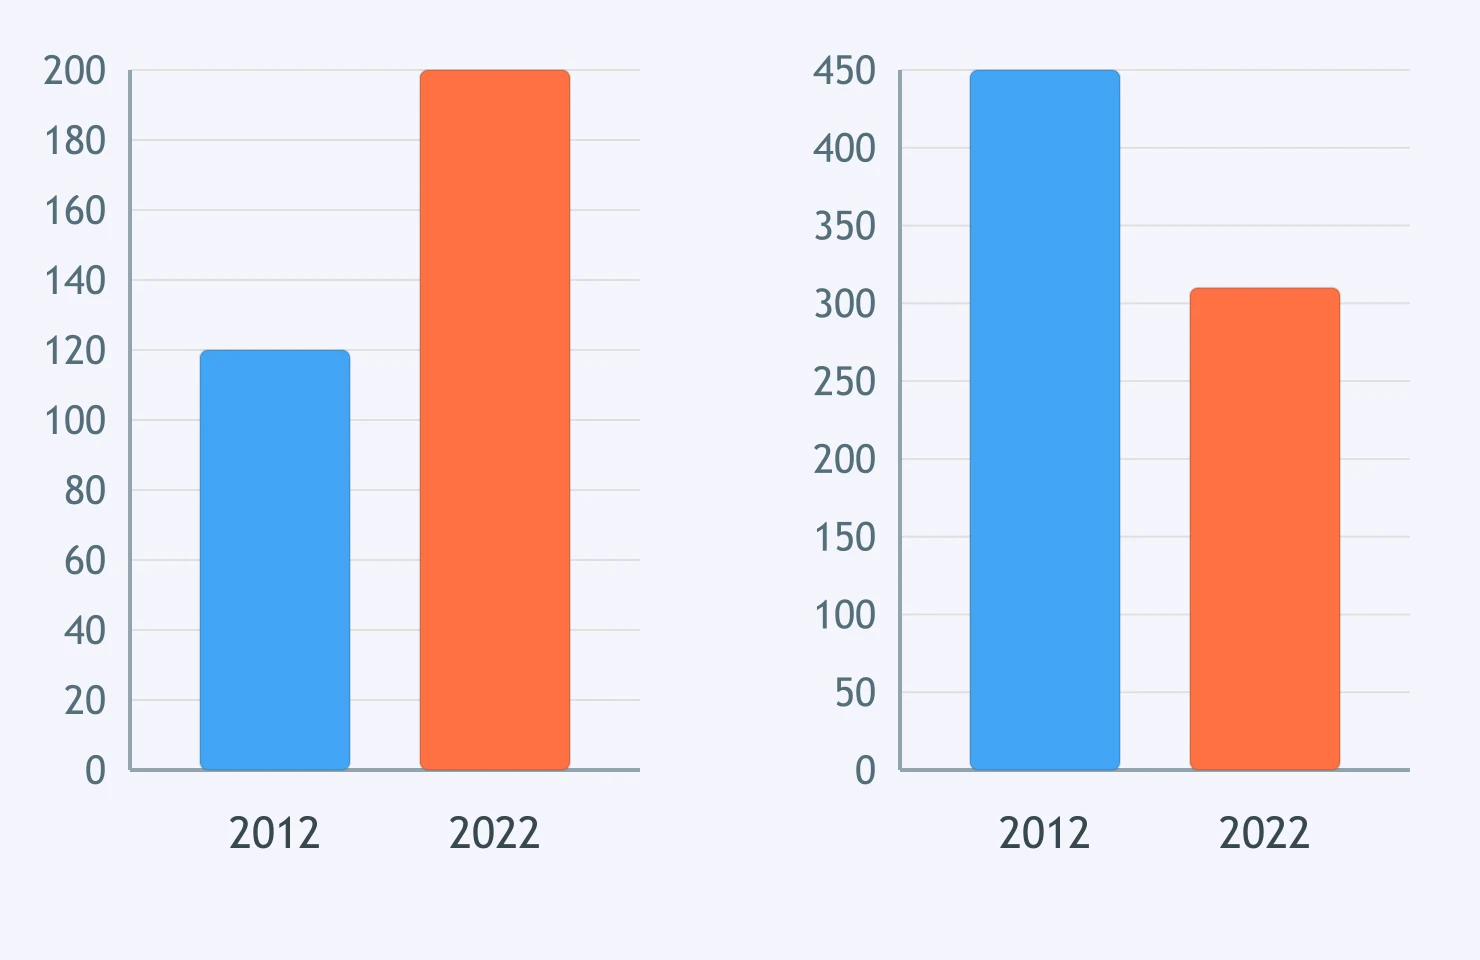
Figure 1 shows bus passengers; Figure 2 shows car journeys, both in 2012 and 2022. Bus use rose from 120,000 to 200,000; ___, car journeys fell from 450,000 to 310,000.
The first figure shows the renewable share of electricity; the second shows monthly bills. Renewables rose from 18% to 32%; ___, average bills fell from $96 to $88.
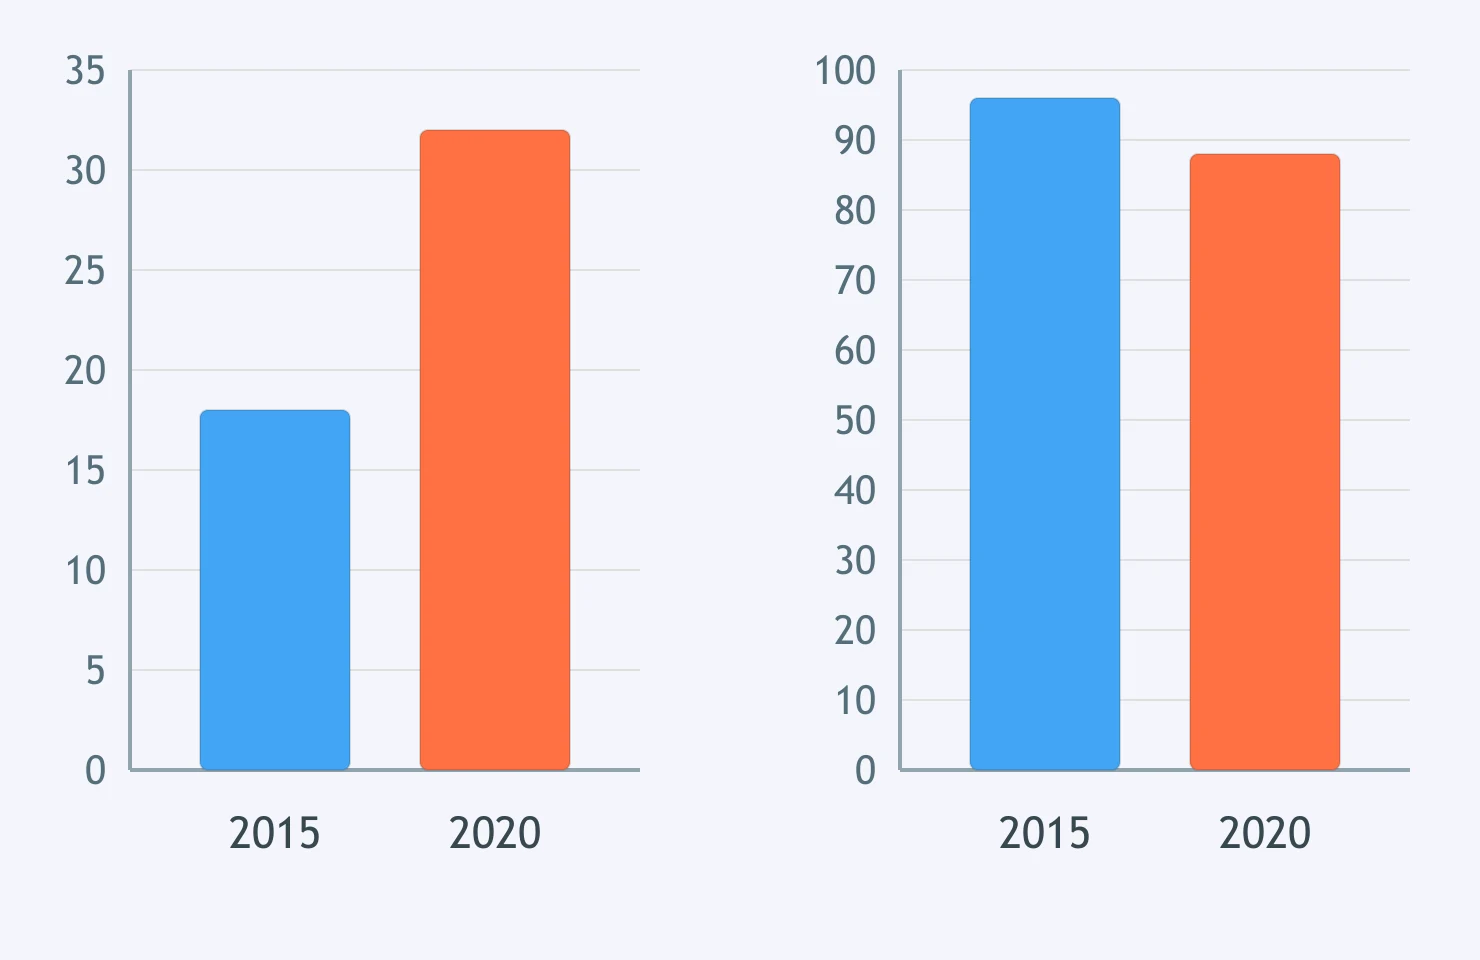
Figure 1 gives council budget shares; Figure 2 gives park visits. Parks received only 12% of the budget; ___, park visits climbed from 1.4 million to 2.1 million.
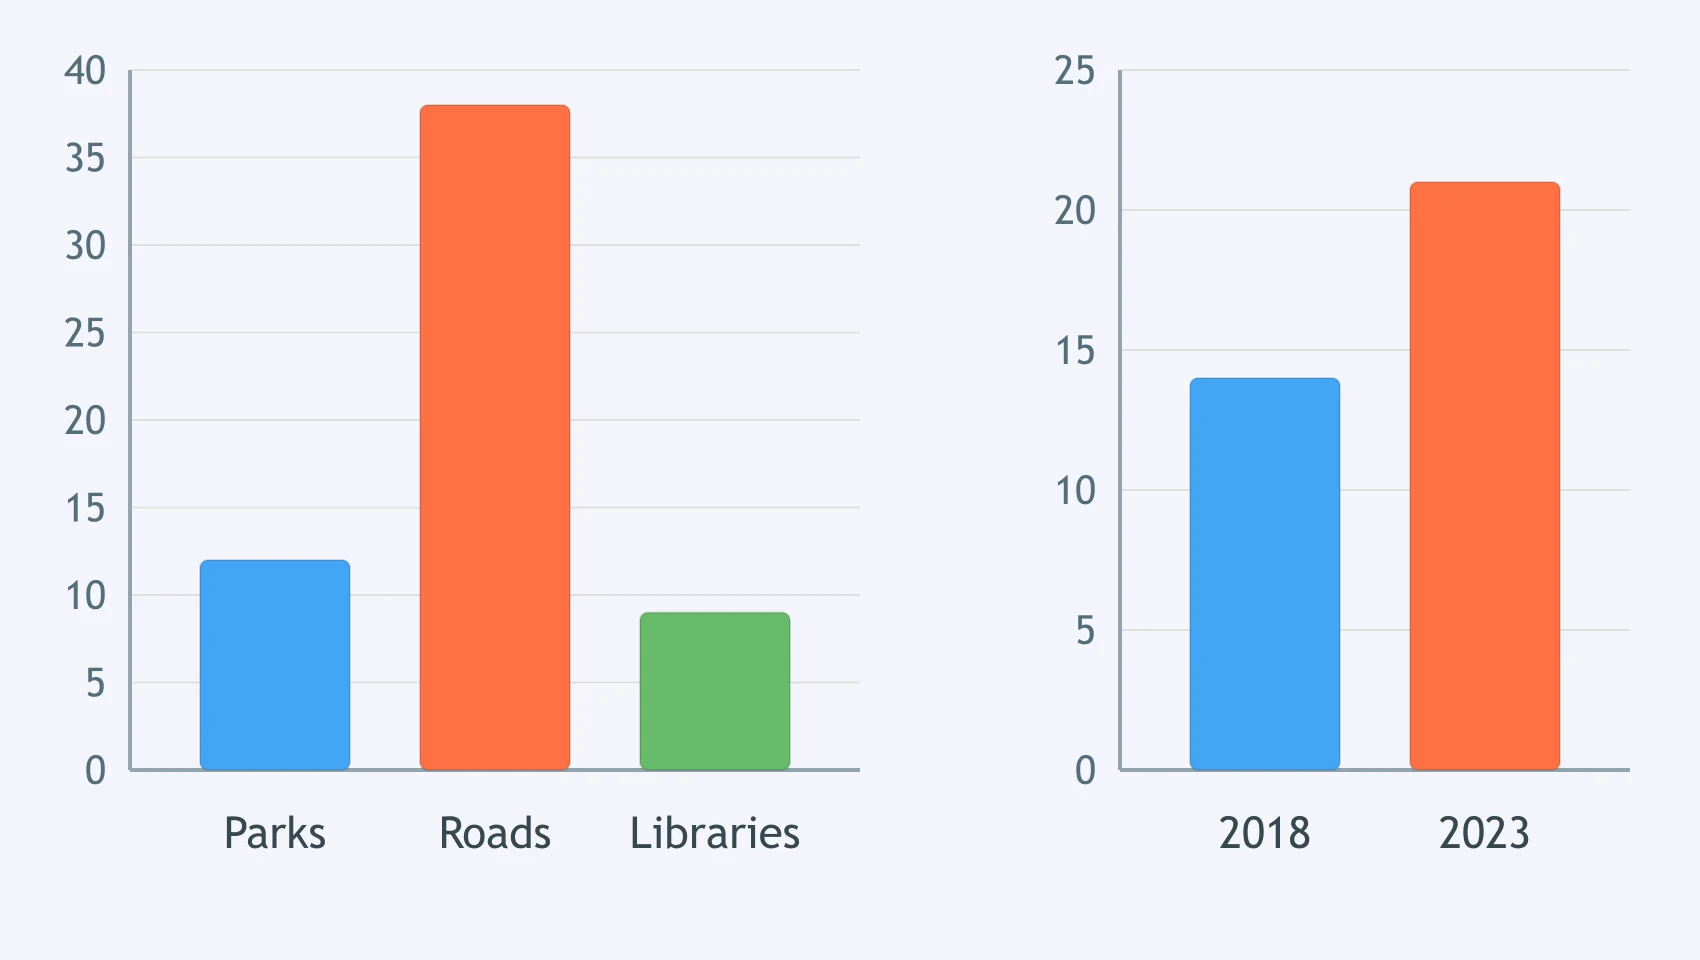
One figure shows university applications; the other shows acceptance rates. Applications rose from 14,000 to 22,000, ___ the acceptance rate fell from 64% to 51%.
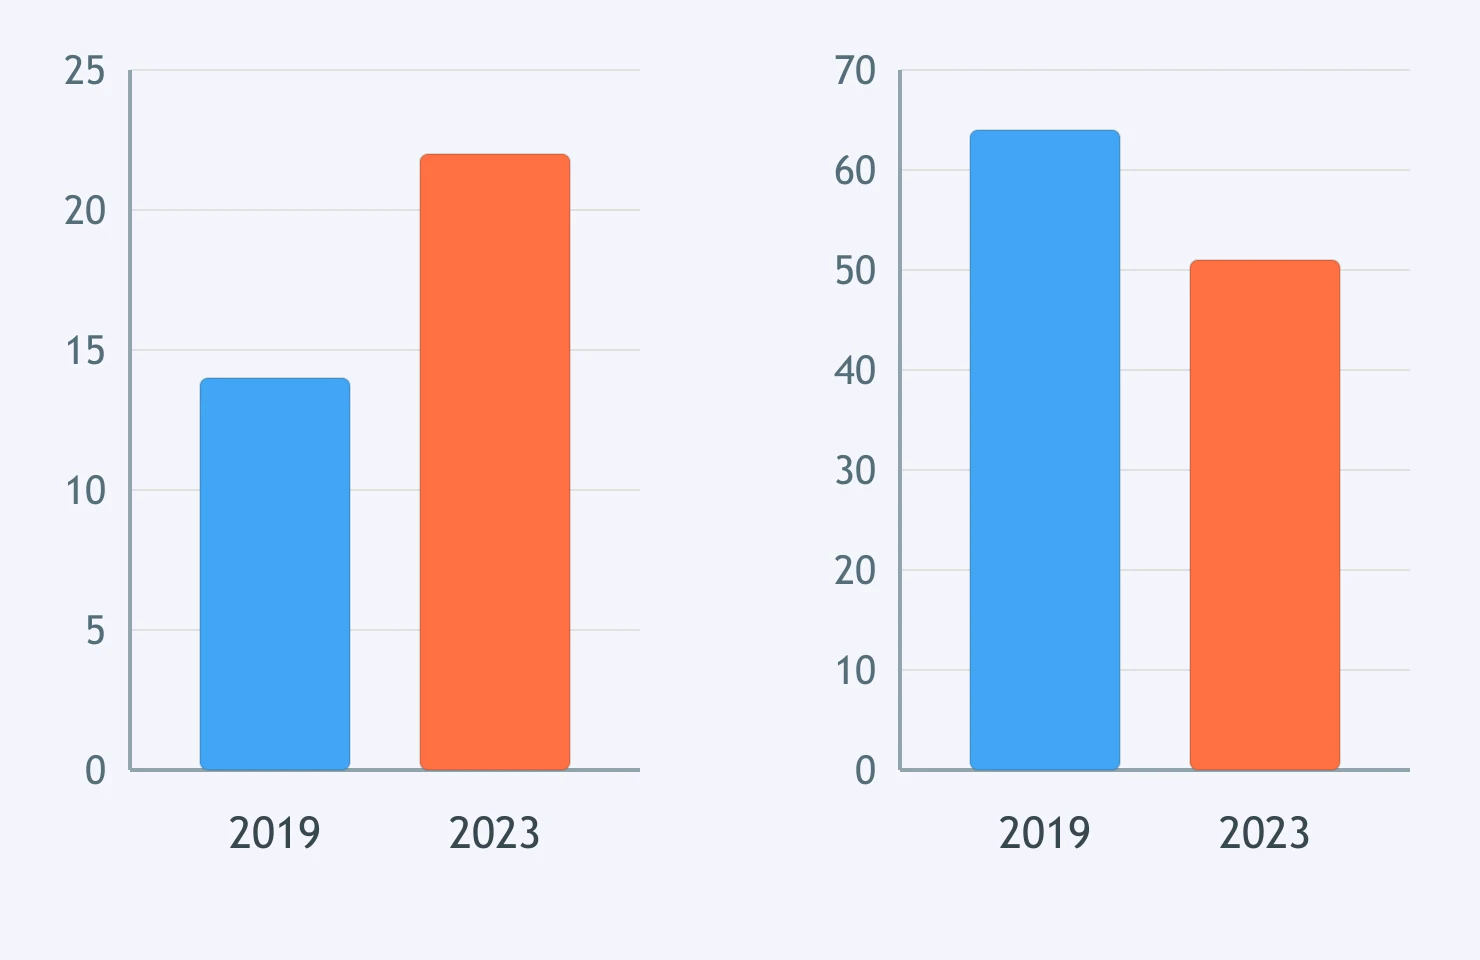
Figure 1 shows a council budget; Figure 2 shows satisfaction with the same services. Which sentence pairs the key feature of each figure?
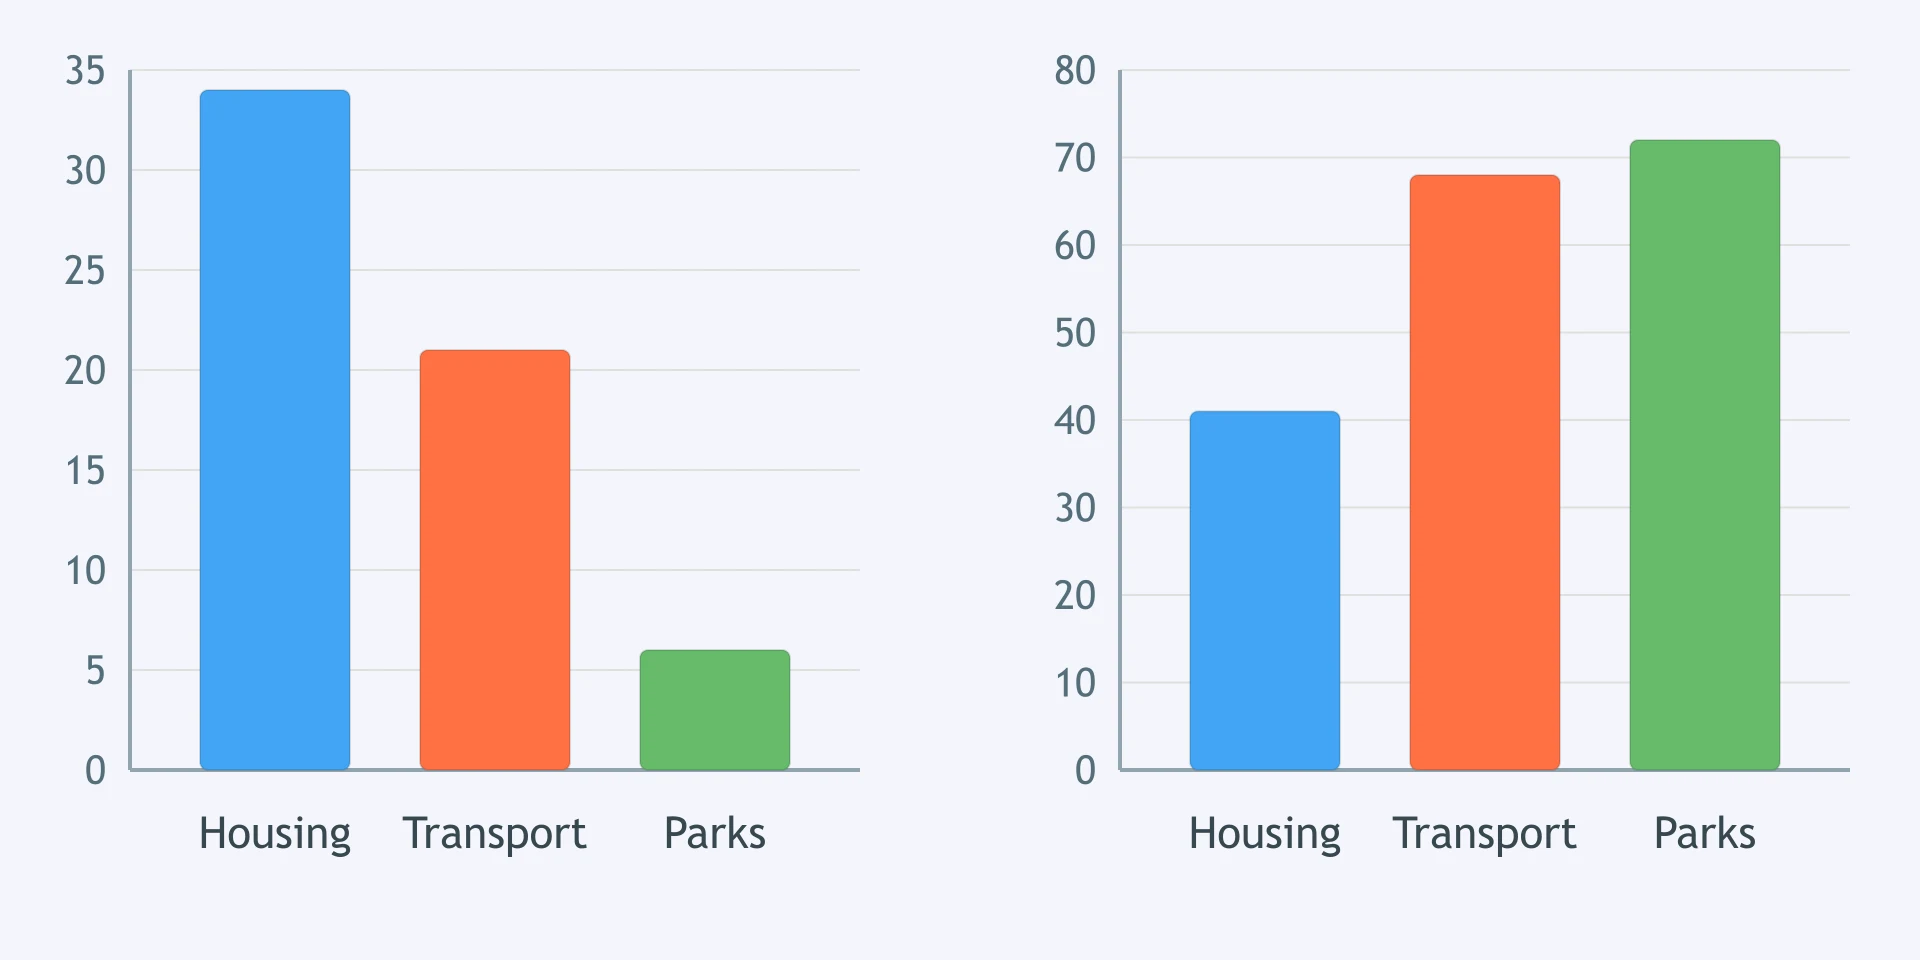
Figure 1 shows electricity generation by source; Figure 2 shows carbon intensity for each source. Which sentence pairs the main feature of each?
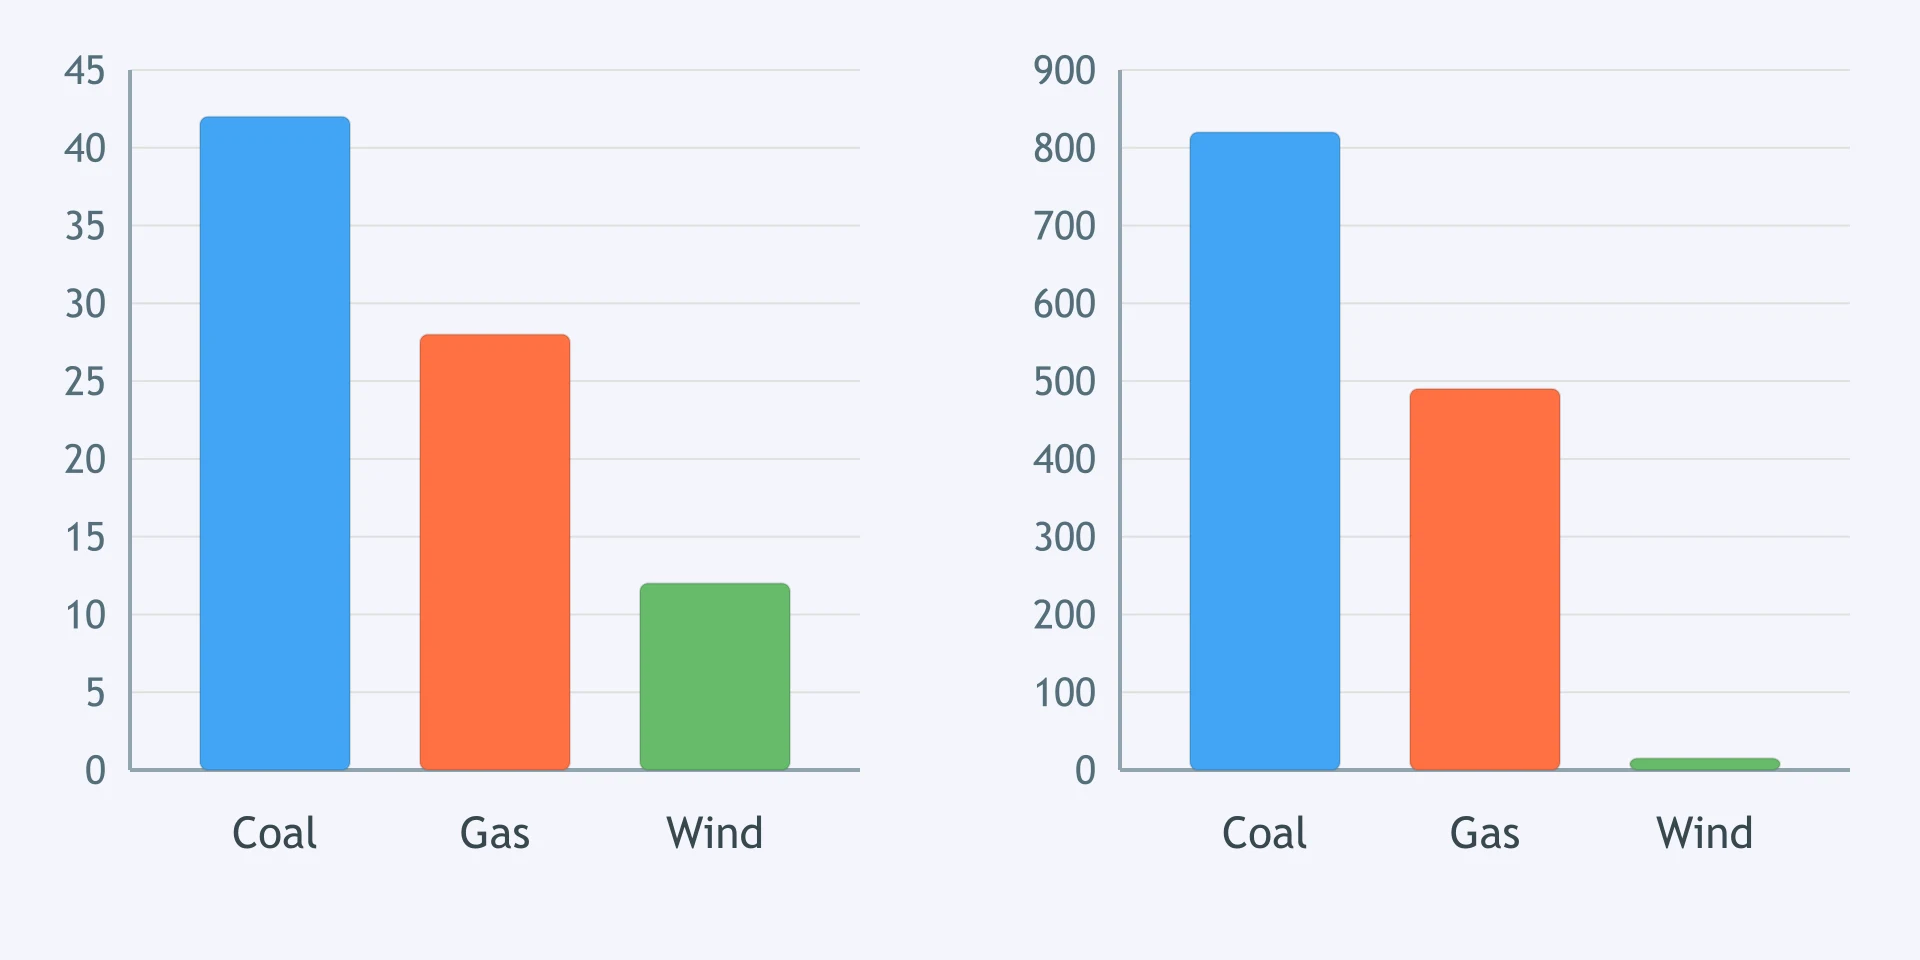
The first figure gives travel-mode shares; the second gives average delay by mode. Which sentence joins the key feature of each figure?
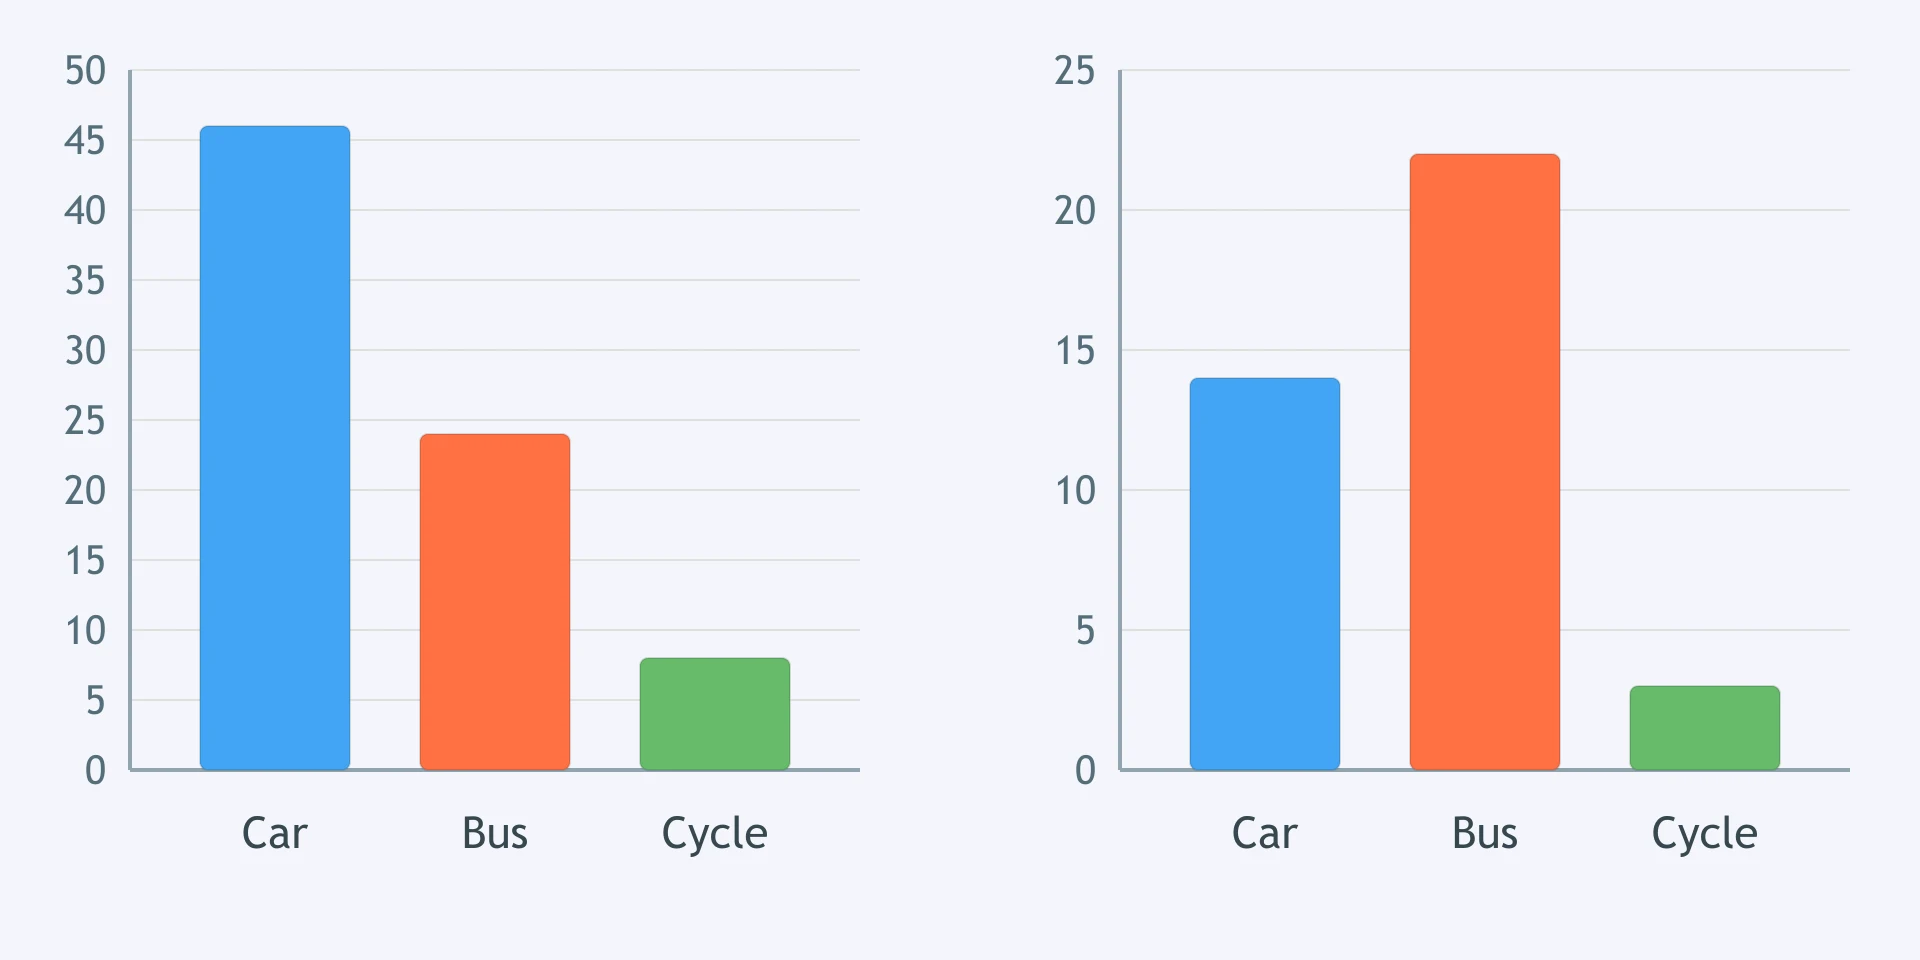
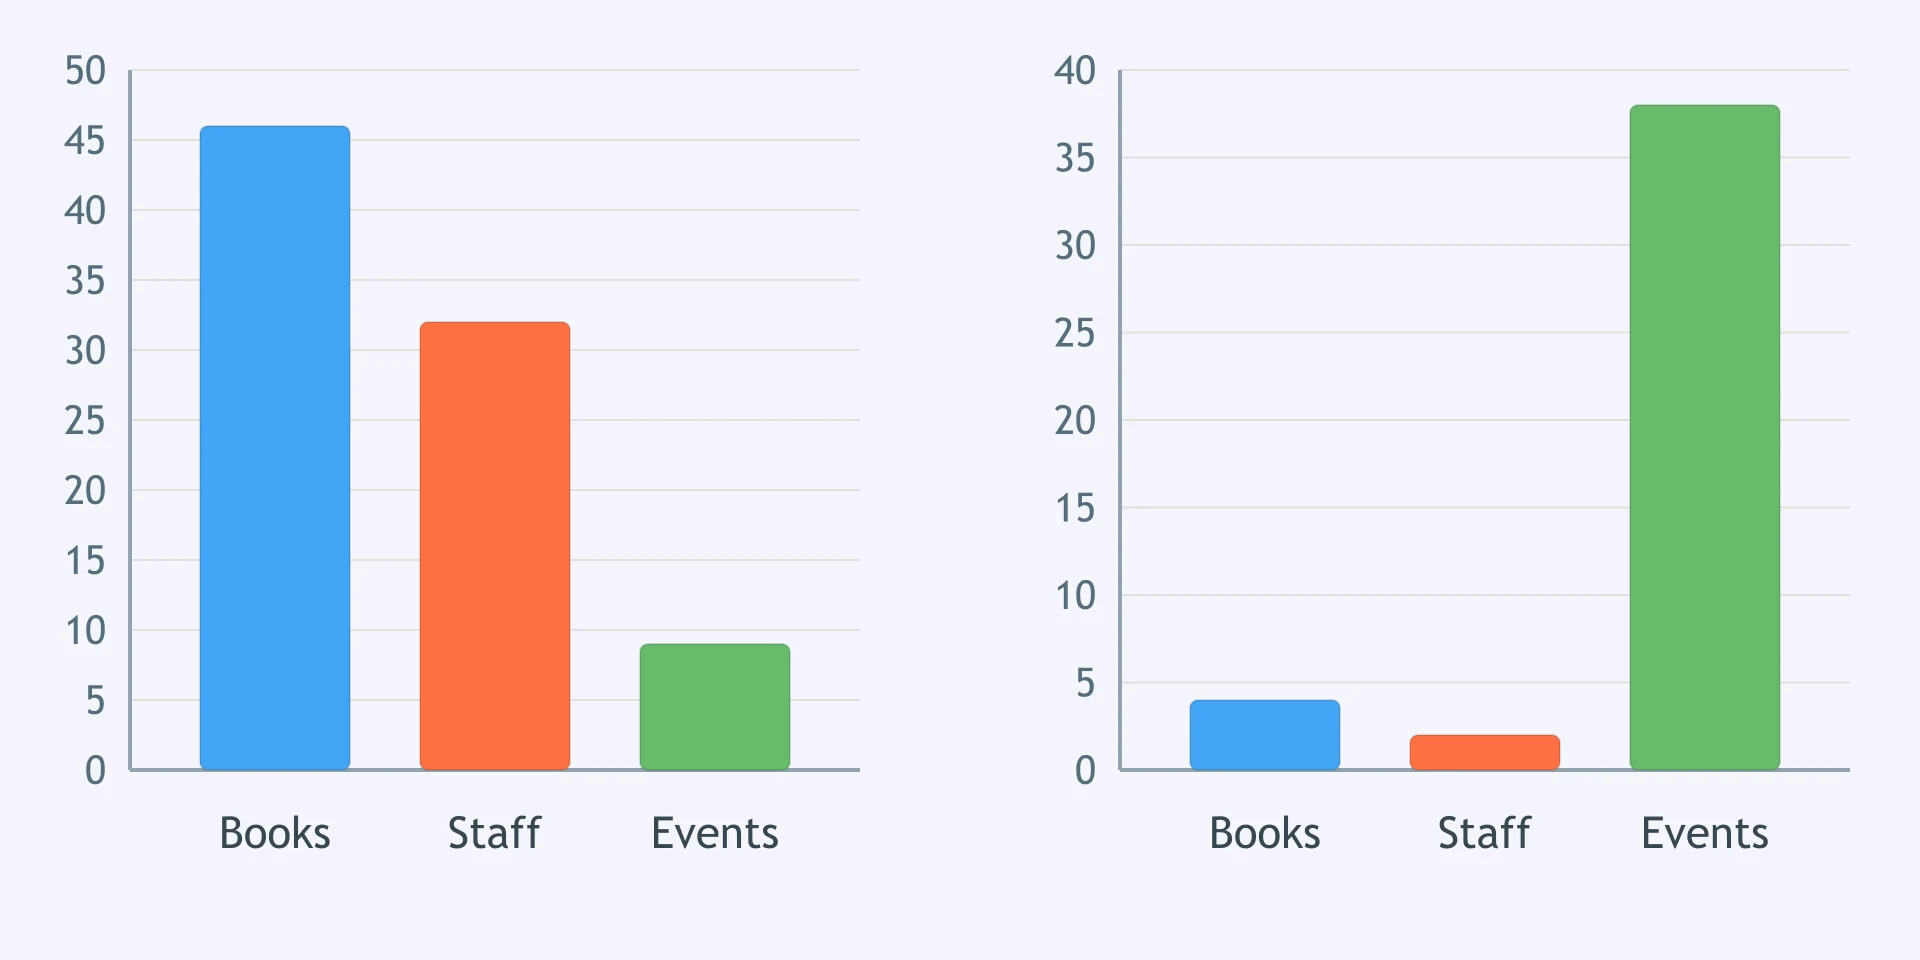
Figure 1 shows library spending; Figure 2 shows growth in use. Which sentence pairs the key feature of each figure?
Crack the passcode before the zombies get in.

Pick a tile, answer, hit bonuses and steals.
Discussion Essays: Both Views and Your Own - IELTS 6.0 W T2
25 questions