Loading
by BlastRoom
Selecting evidence for a claim already made. The stem gives a sentence a candidate has written about the figure, and the options are the values that would support it, sit beside it, or contradict it.
#writing_task_1#ielts_6_0

30 questions
One question set, multiple game modes. Tap any game to see it in action. Not sure which to pick?
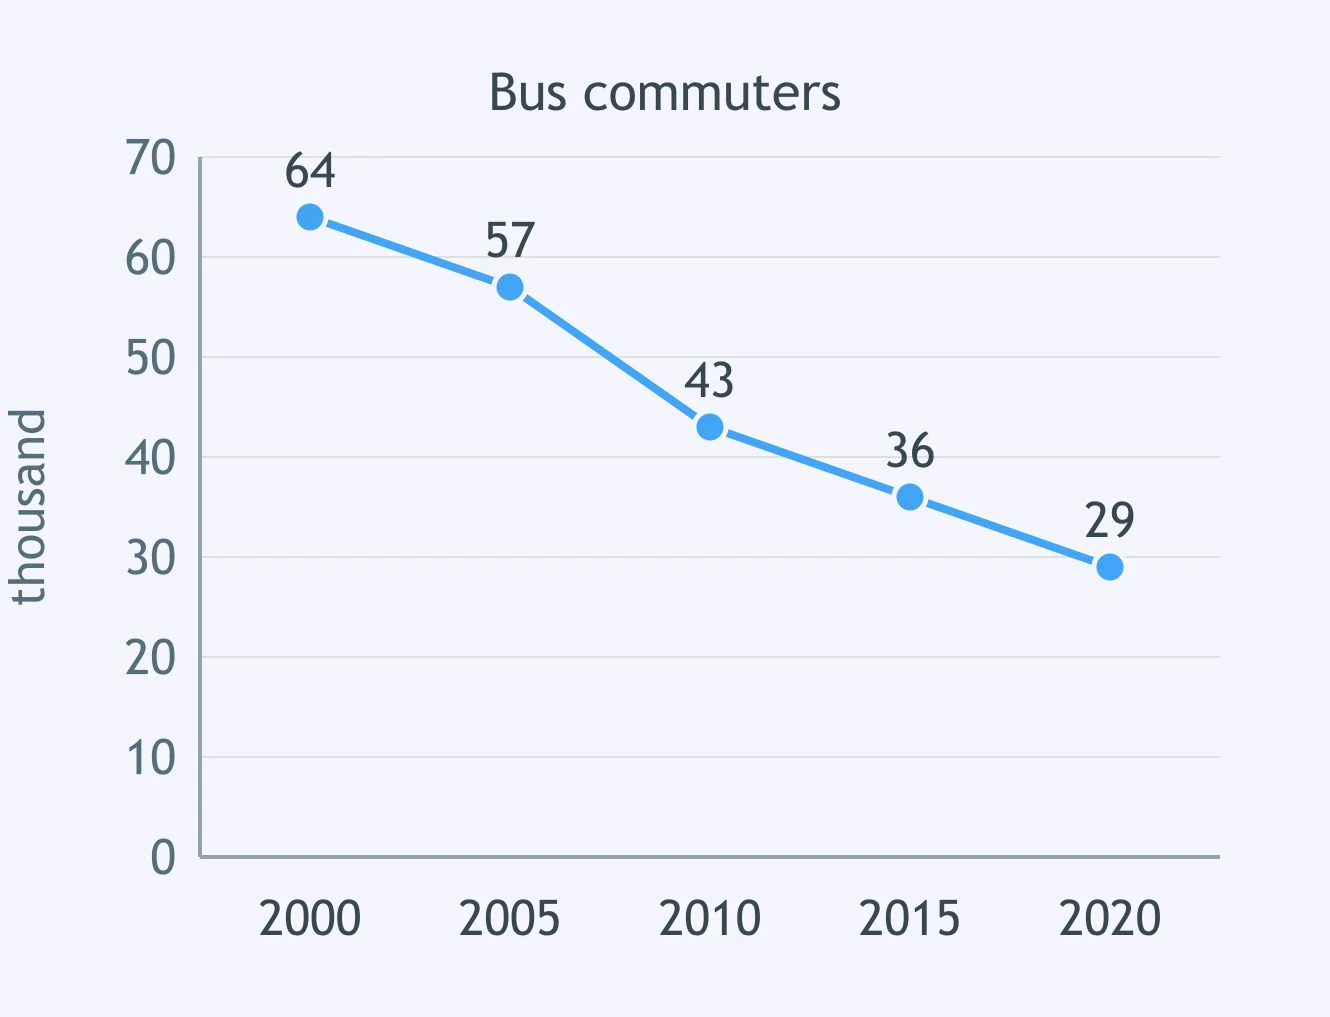
The line graph shows recycled waste in a town from 2012 to 2020. A candidate wrote: 'The proportion more than doubled over the period.' Which figures support this?
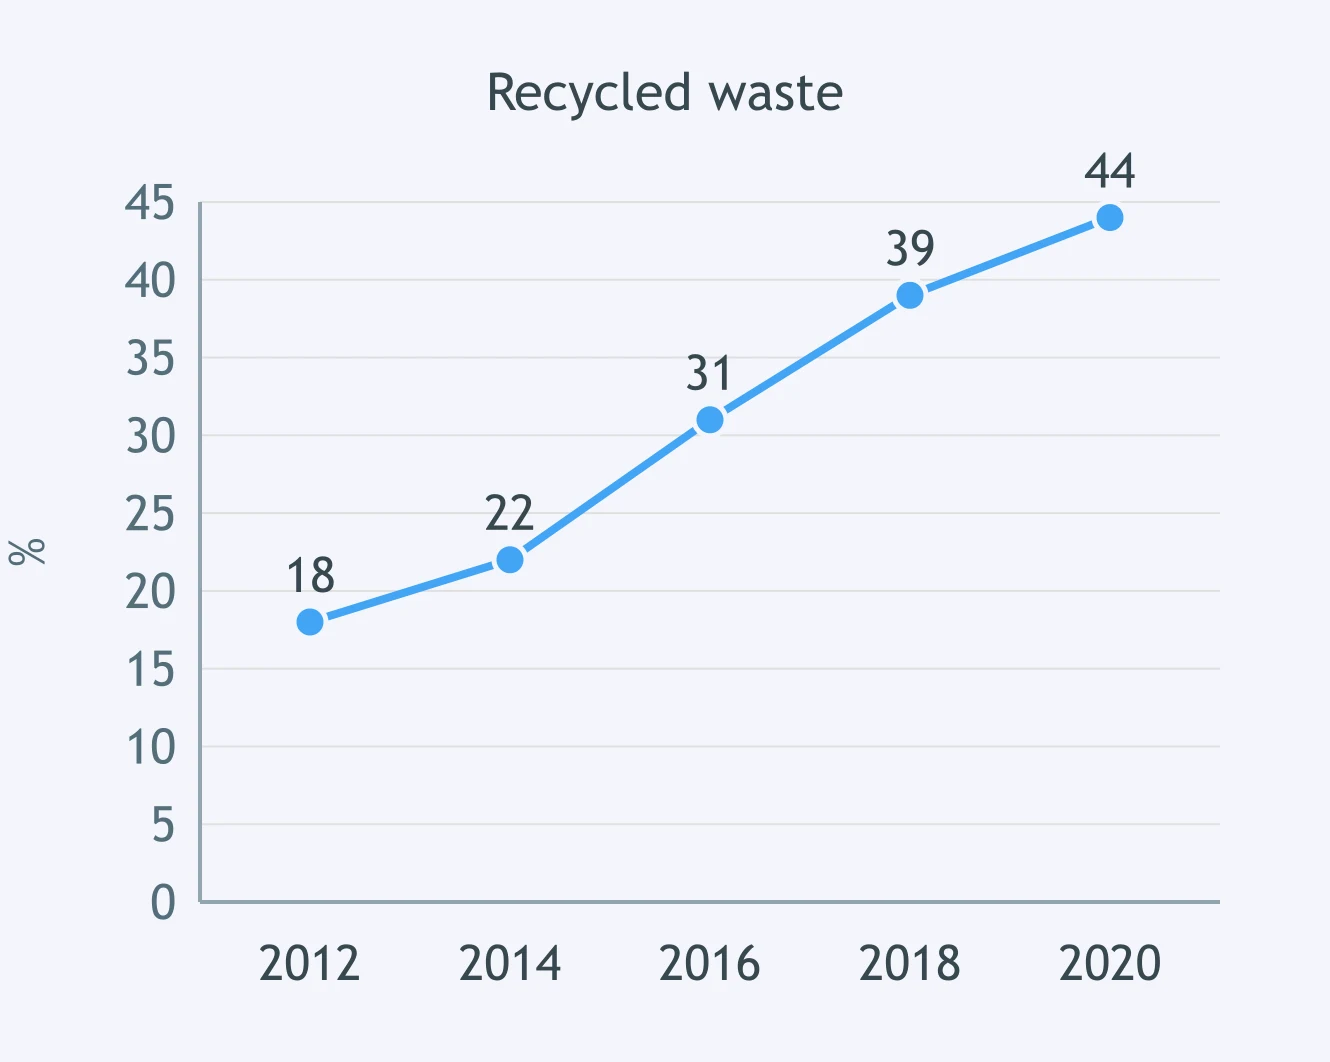
The line graph shows daily bus commuters from 2000 to 2020. A candidate wrote: 'The number fell by more than half over the period.' Which figures would prove it?
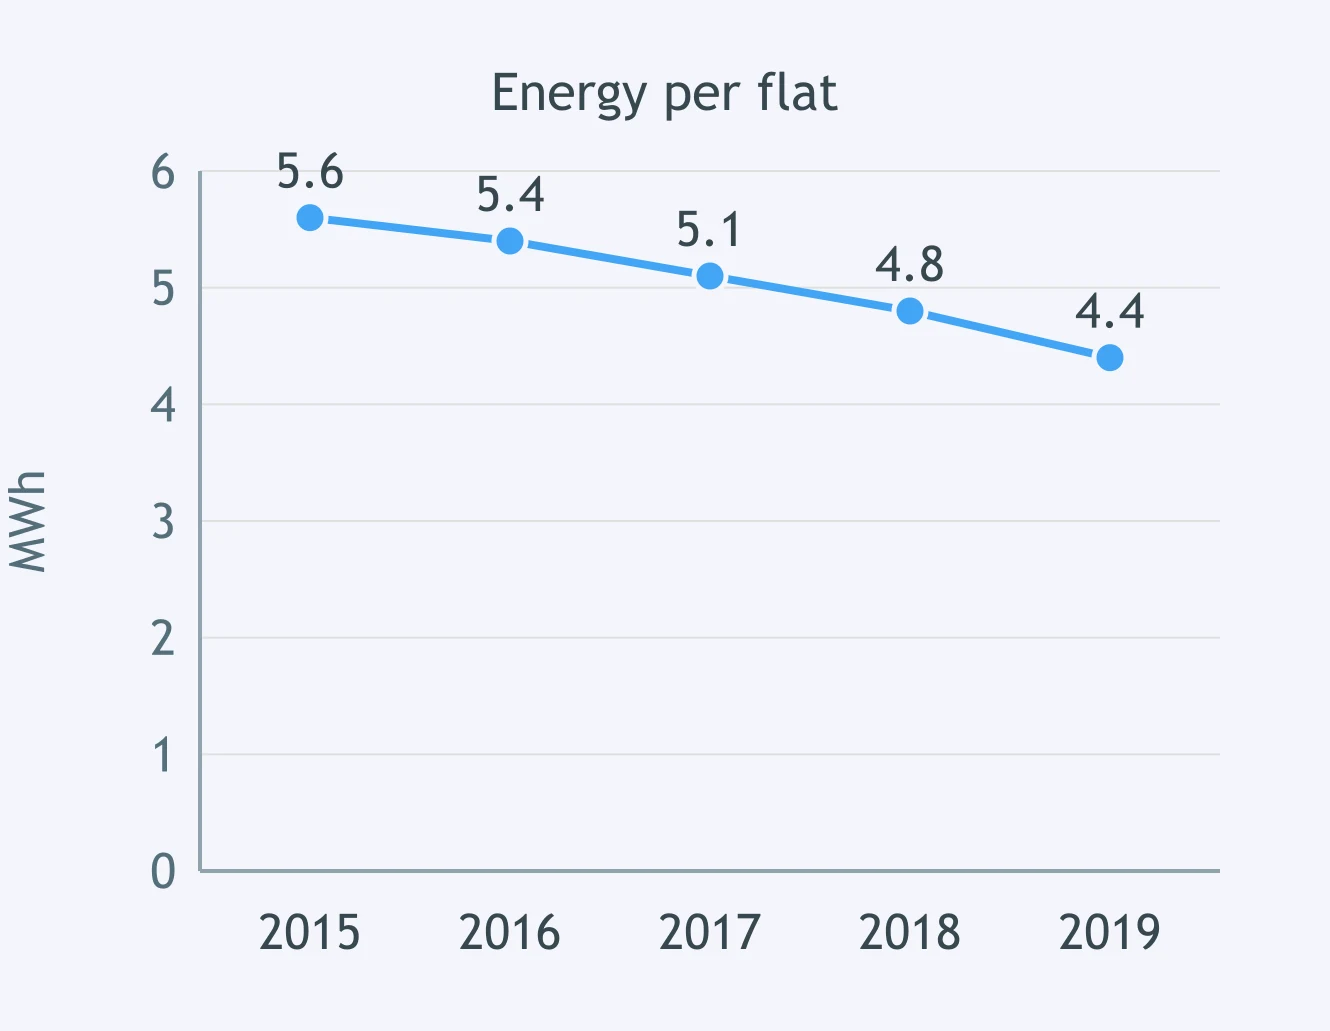
The line graph shows energy use per flat from 2015 to 2019. A candidate wrote: 'Average use declined overall by just over one MWh.' Which figures back this?
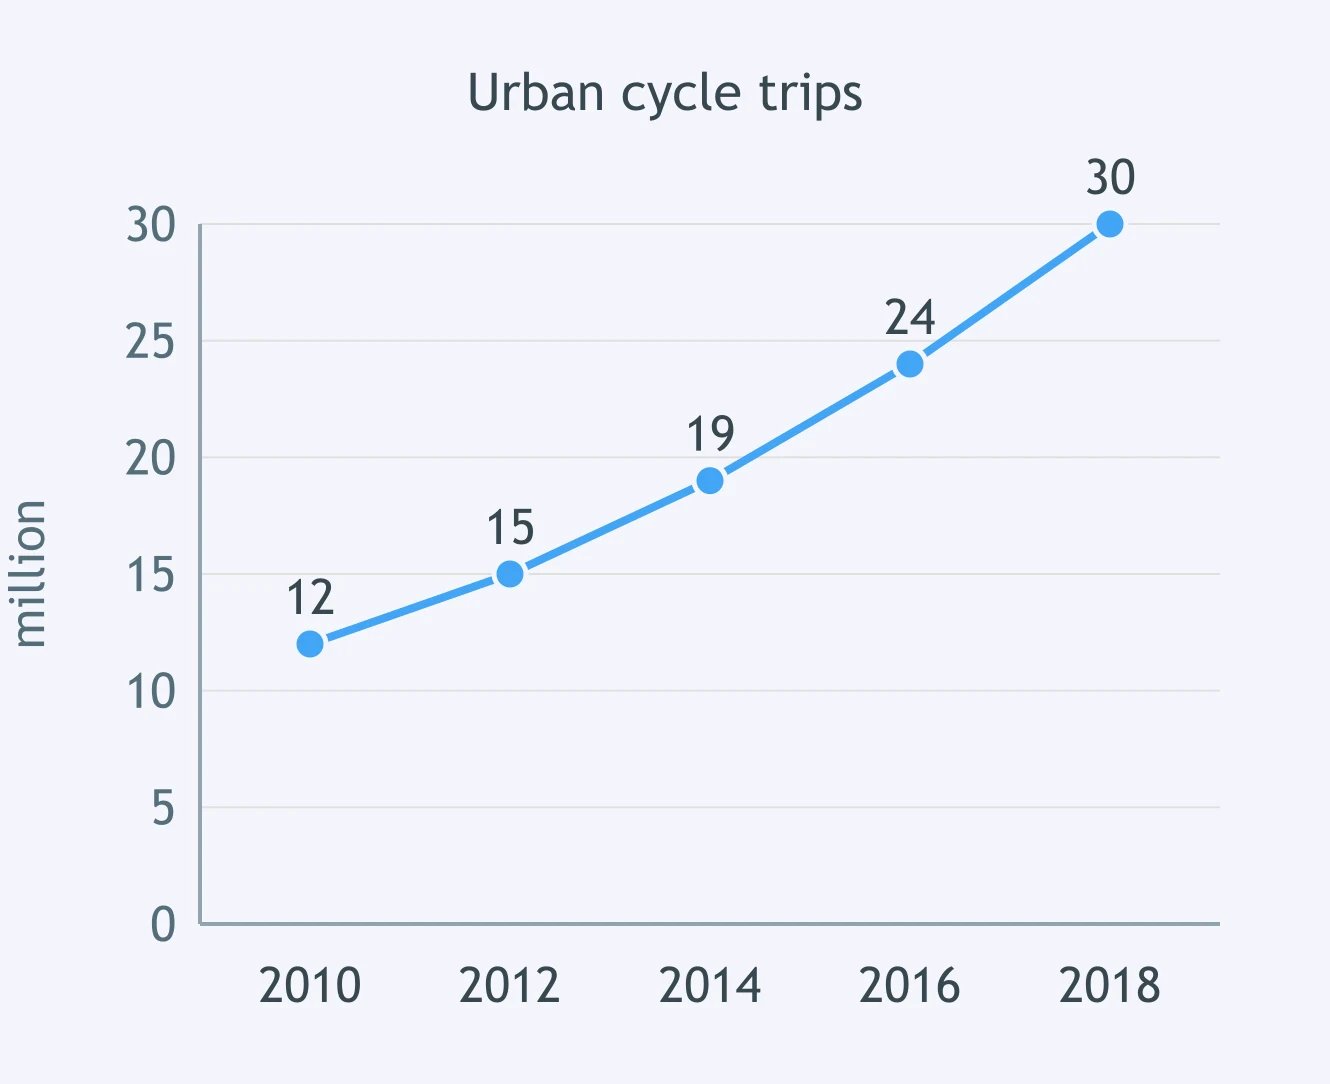
The line graph shows urban cycle trips from 2010 to 2018. A candidate wrote: 'Trips increased by 18 million over the period.' Which figures support the sentence?
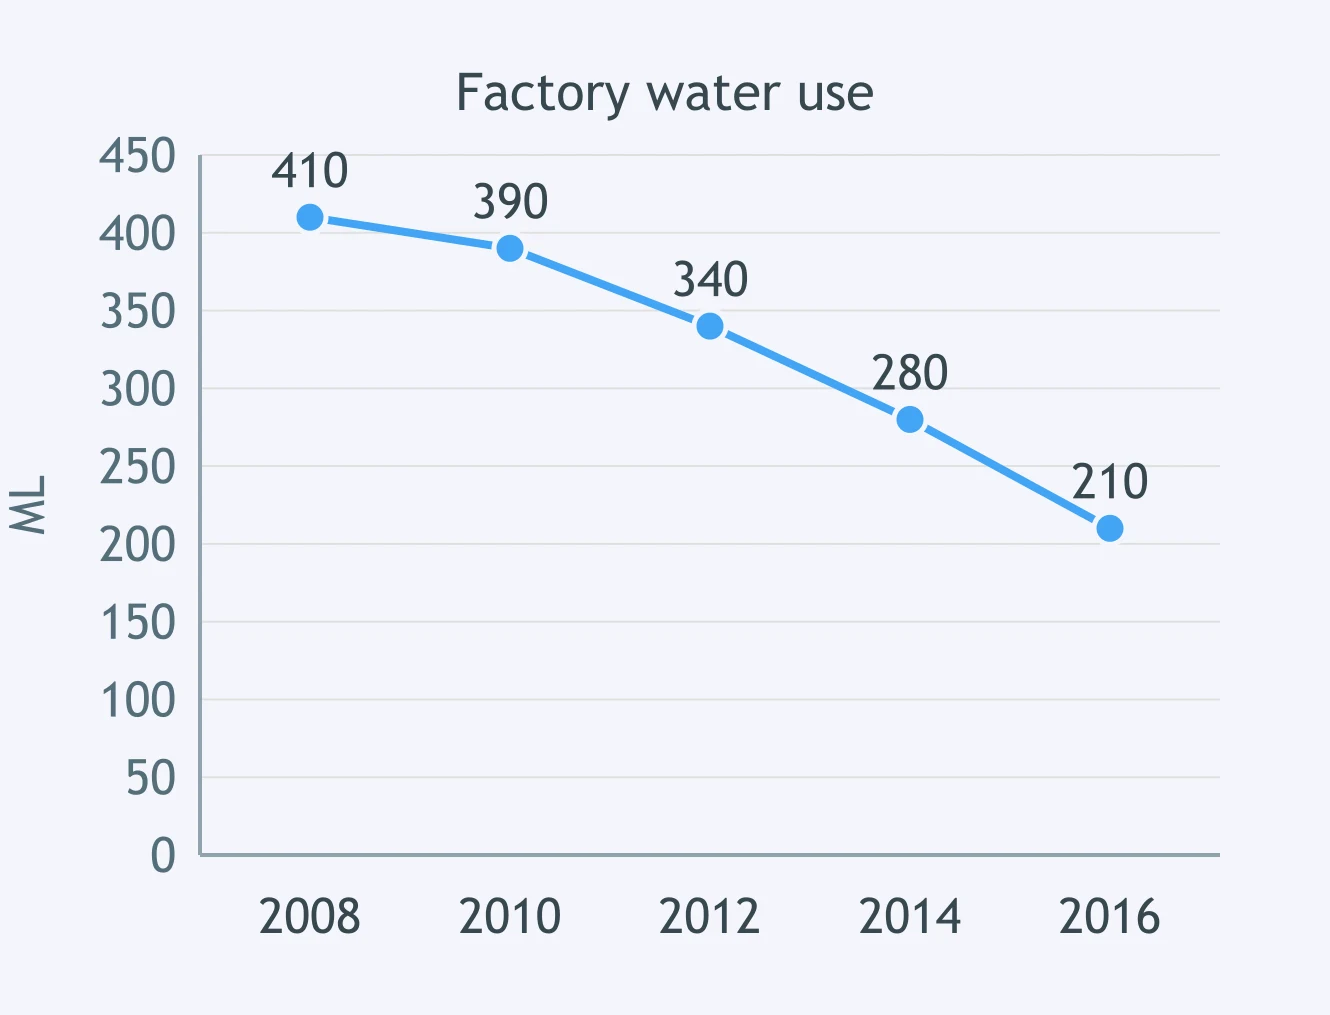
The line graph shows factory water use from 2008 to 2016. A candidate wrote: 'Use almost halved, but did not quite fall to half.' Which figures support this?
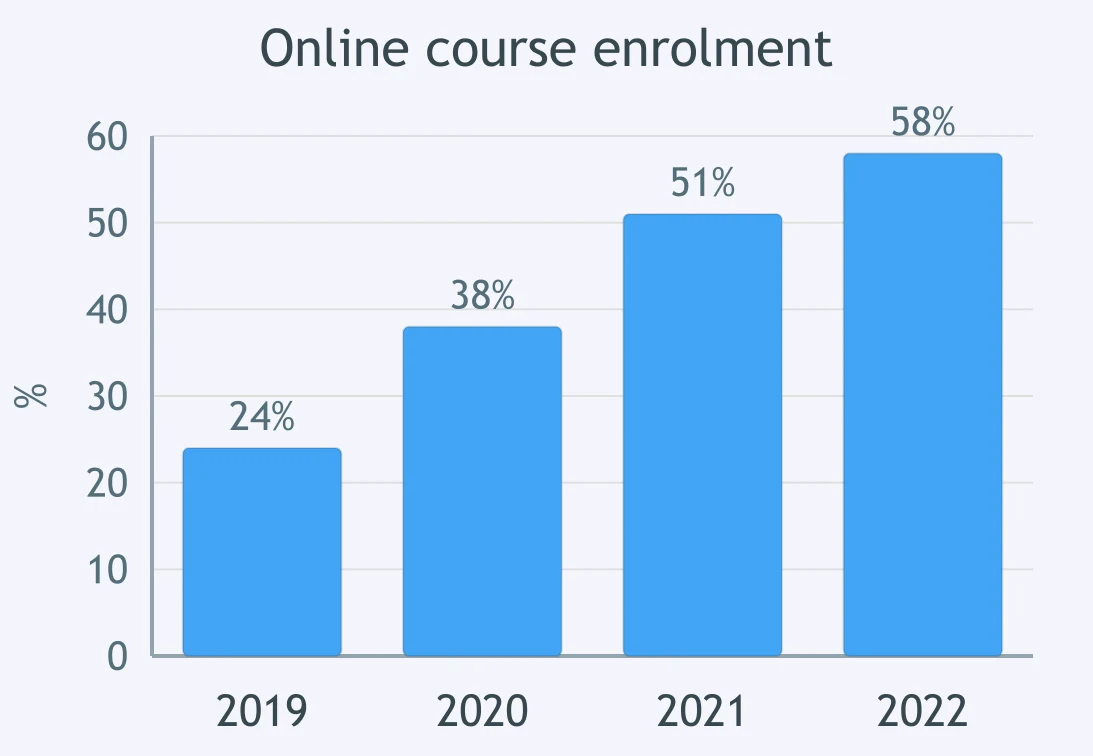
The bar chart shows online course enrolment from 2019 to 2022. A candidate wrote: 'The share rose by 34 percentage points over the period.' Which figures support it?
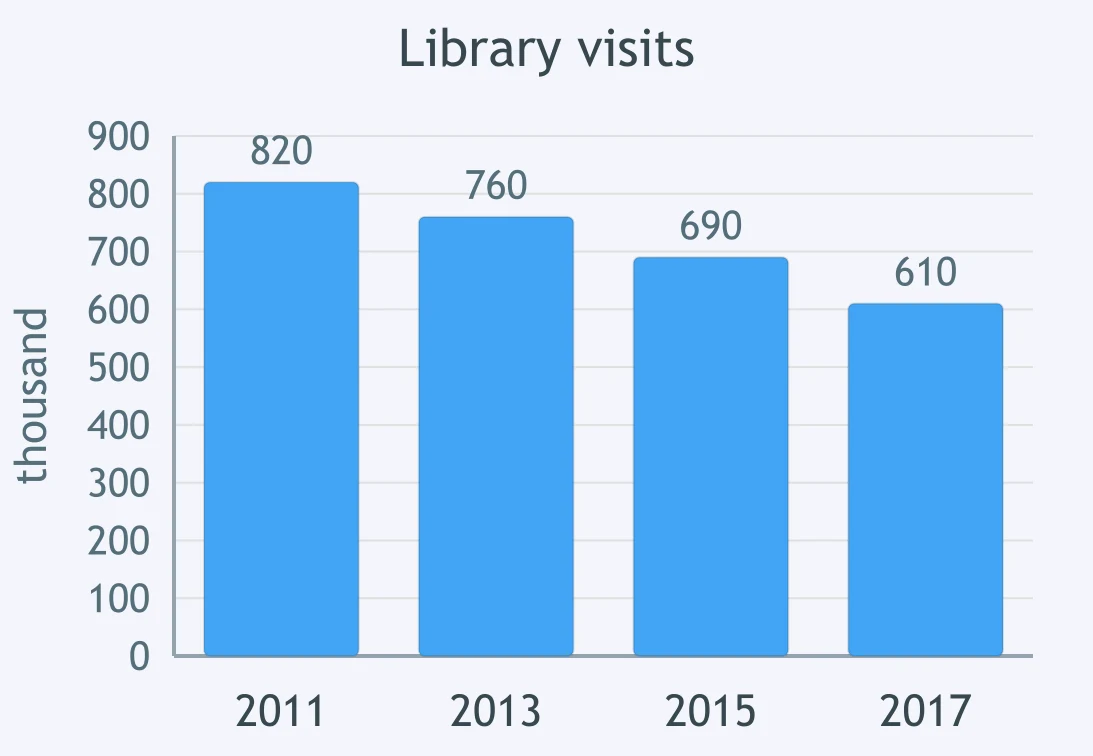
The bar chart shows public library visits from 2011 to 2017. A candidate wrote: 'Visits dropped by just over a quarter.' Which figures best support this?
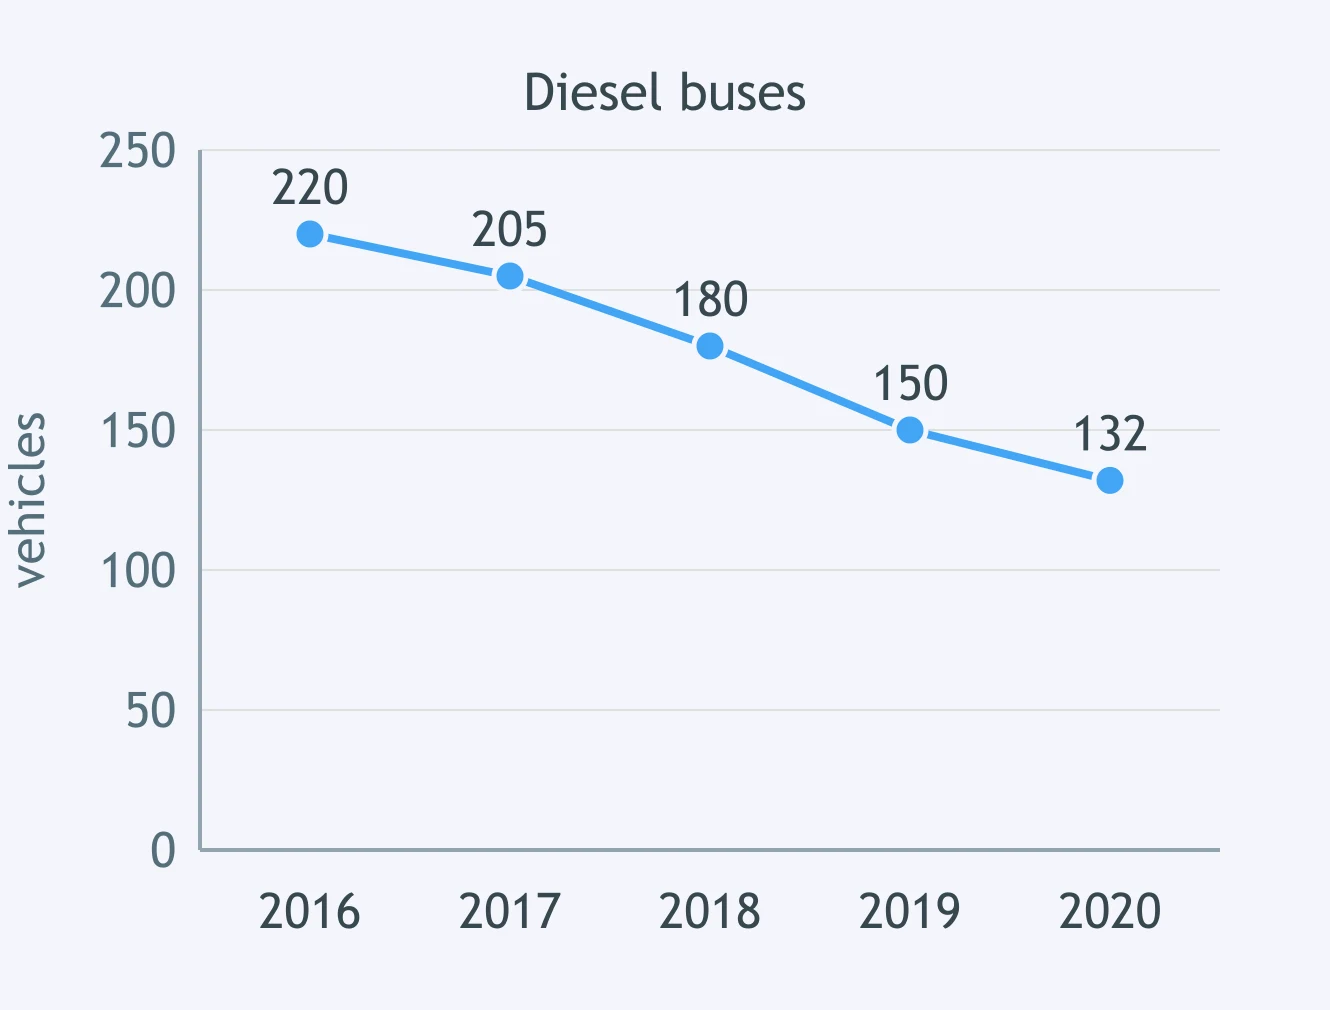
The line graph shows diesel buses in a city fleet from 2016 to 2020. A candidate wrote: 'The number decreased by exactly 40%.' Which figures support this?
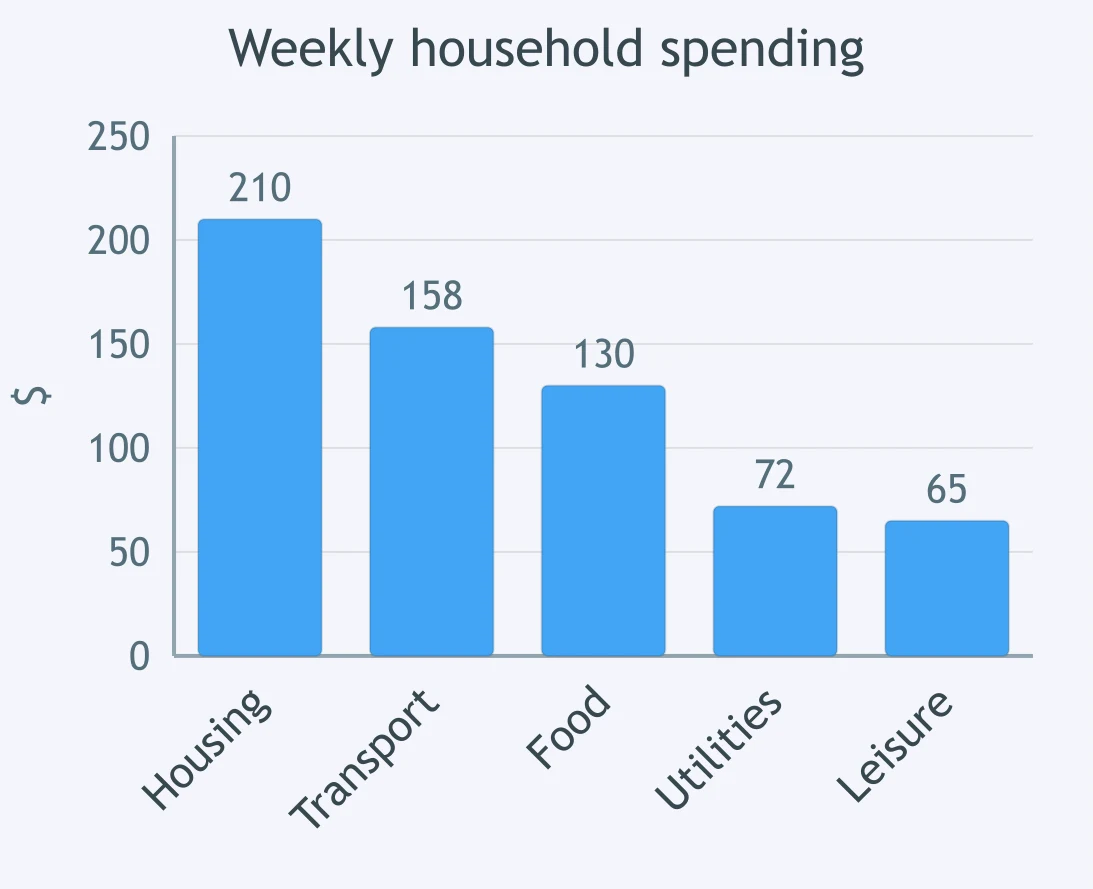
The bar chart shows average weekly household spending. A candidate wrote: 'Transport was the largest item apart from housing.' Which figures support the point?
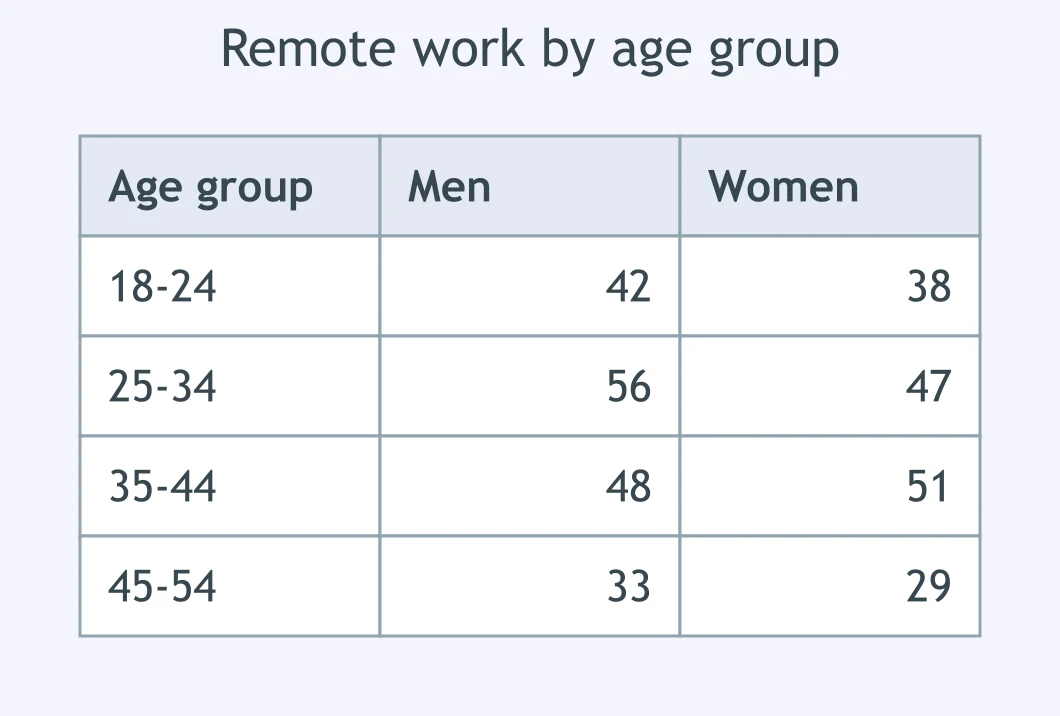
The table shows remote work by age group and sex. A candidate wrote: 'The gender gap was widest among 25-34-year-olds, with men higher.' Which figures support this?
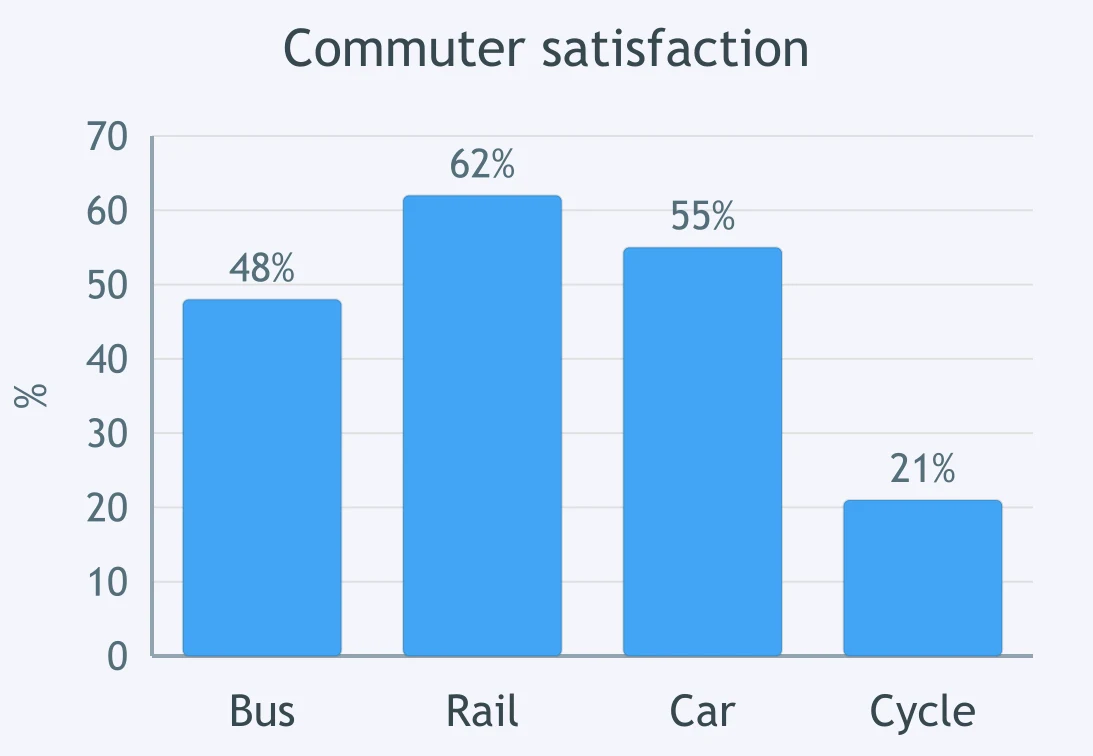
The bar chart shows commuter satisfaction by transport mode. A candidate wrote: 'Rail had the highest satisfaction rate, slightly above car travel.' Which figures support this?
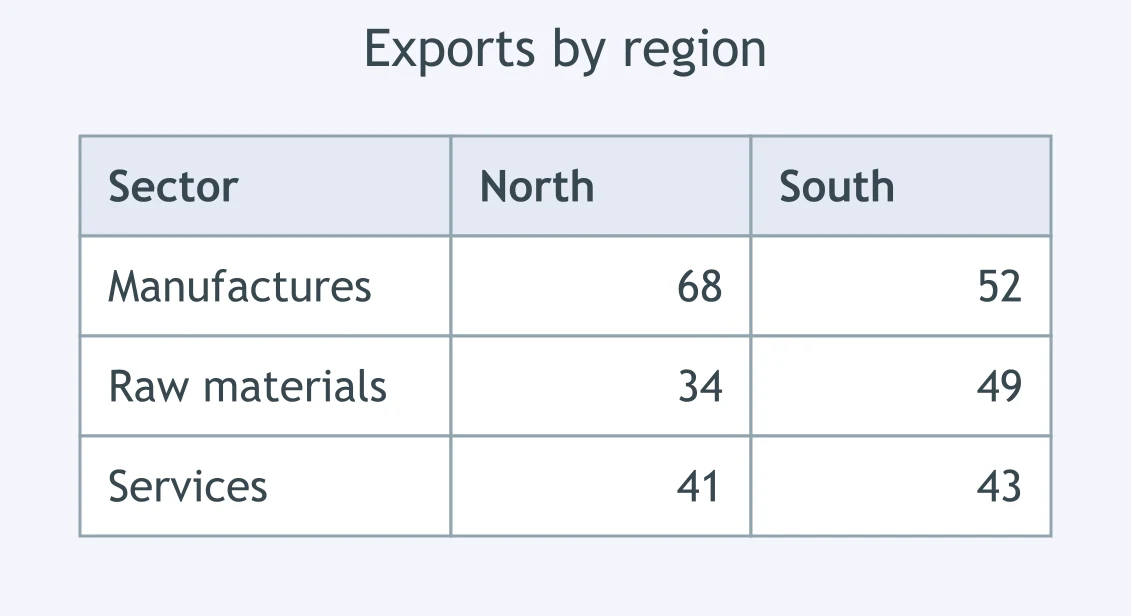
The table shows exports in two regions. A candidate wrote: 'The North led in manufactured goods, while the South led in raw materials.' Which figures support this?
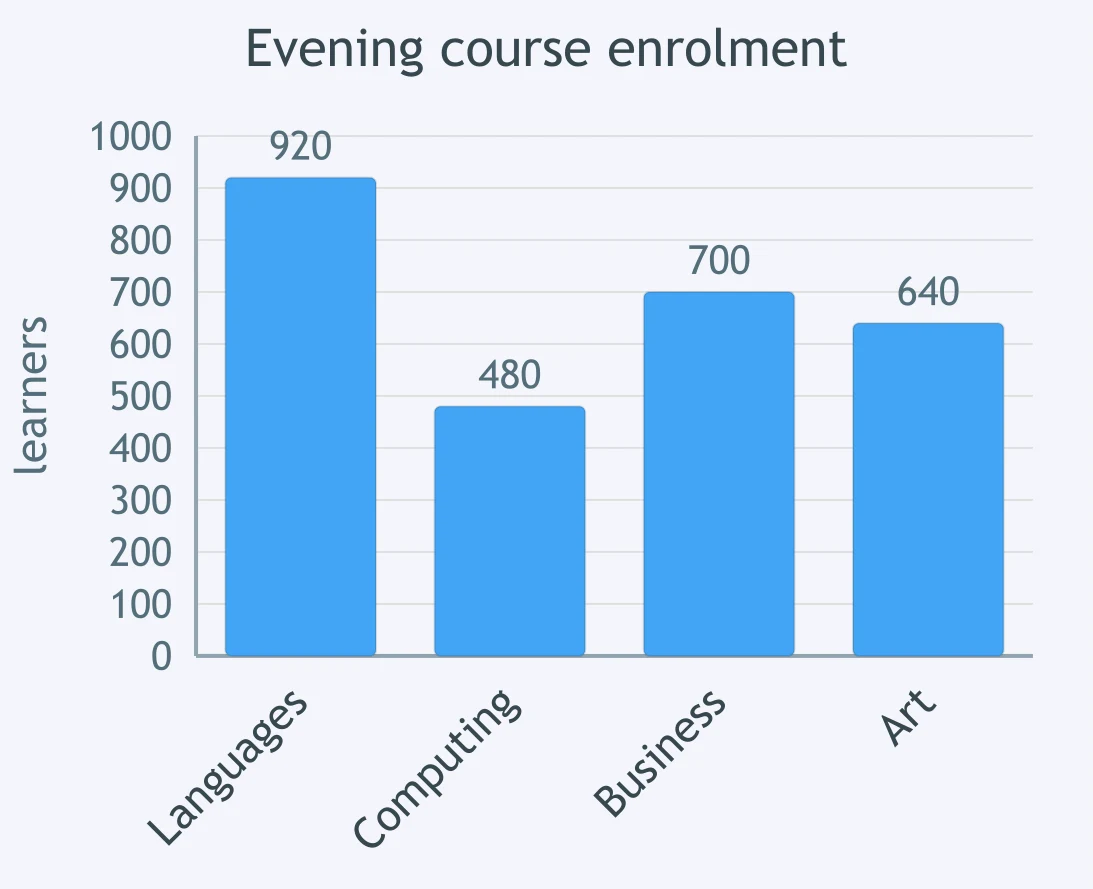
The bar chart shows evening course enrolment by subject. A candidate wrote: 'Languages attracted nearly twice as many learners as computing.' Which figures support it?
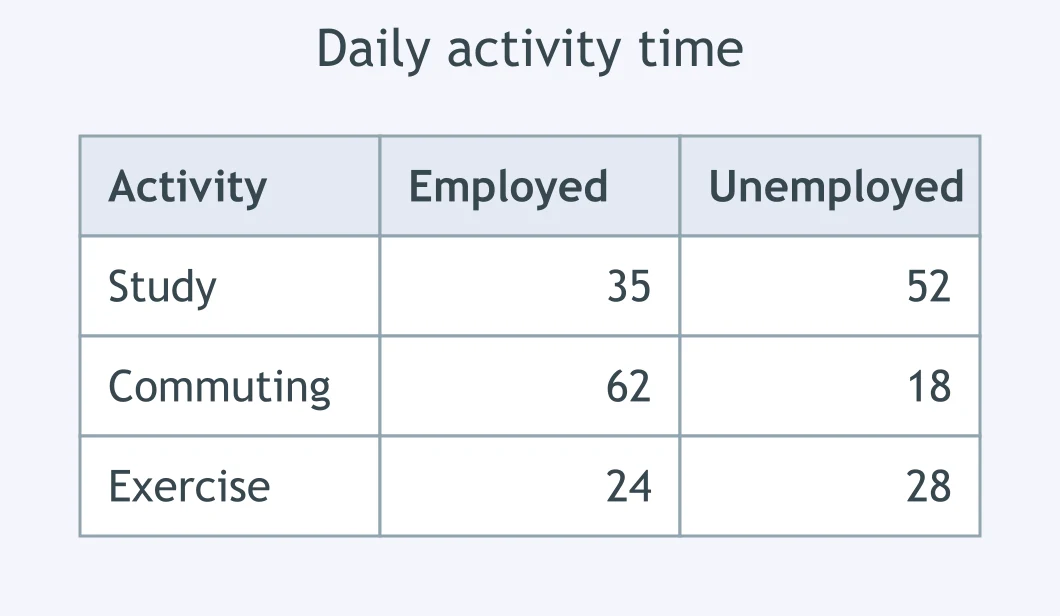
The table shows minutes per day spent on activities. A candidate wrote: 'Unemployed adults spent more time studying, but less time commuting.' Which figures support this?
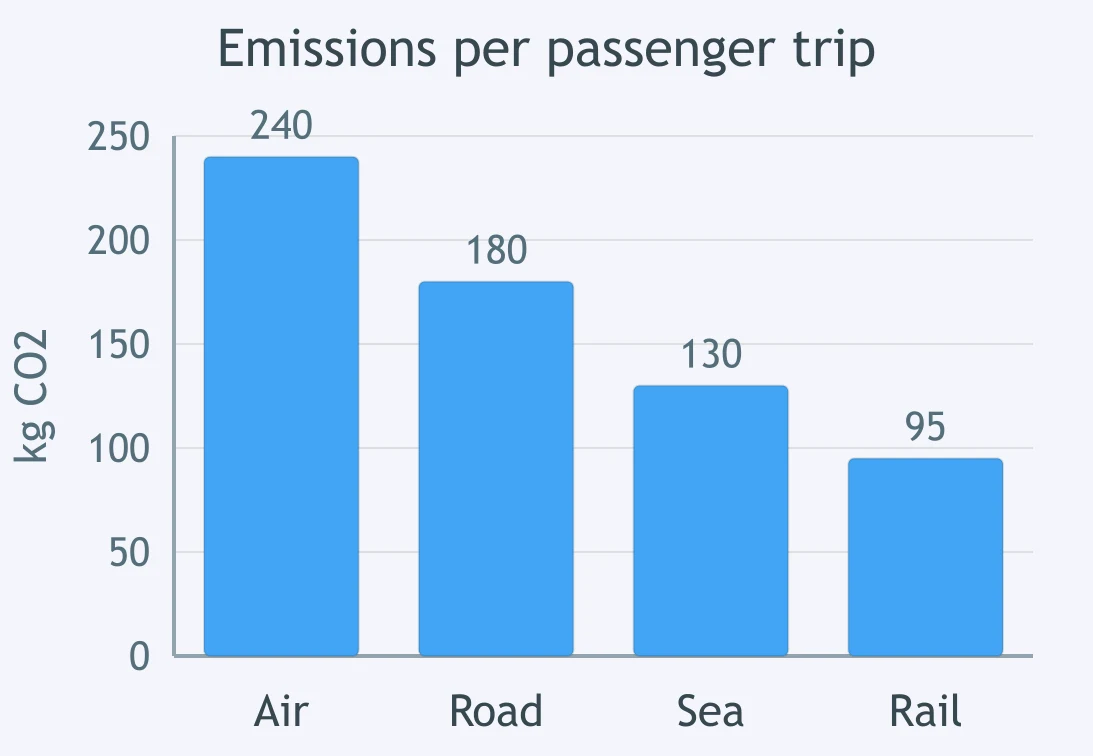
The bar chart shows emissions per passenger trip. A candidate wrote: 'Air travel produced the highest emissions, more than double rail.' Which figures support this?
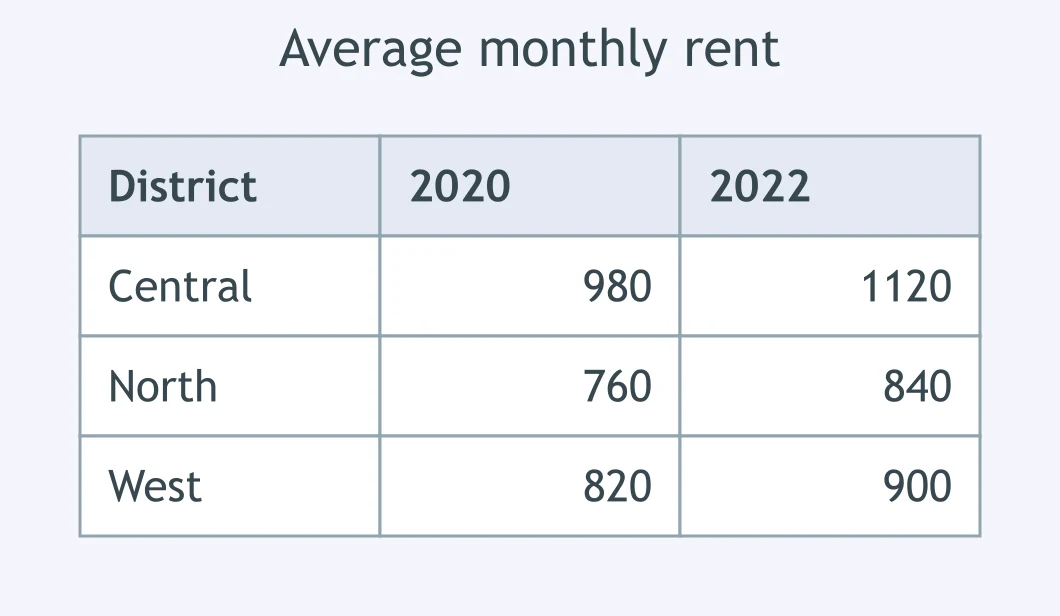
The table shows average rent in three districts. A candidate wrote: 'The central district was the most expensive in both years.' Which figures support this?
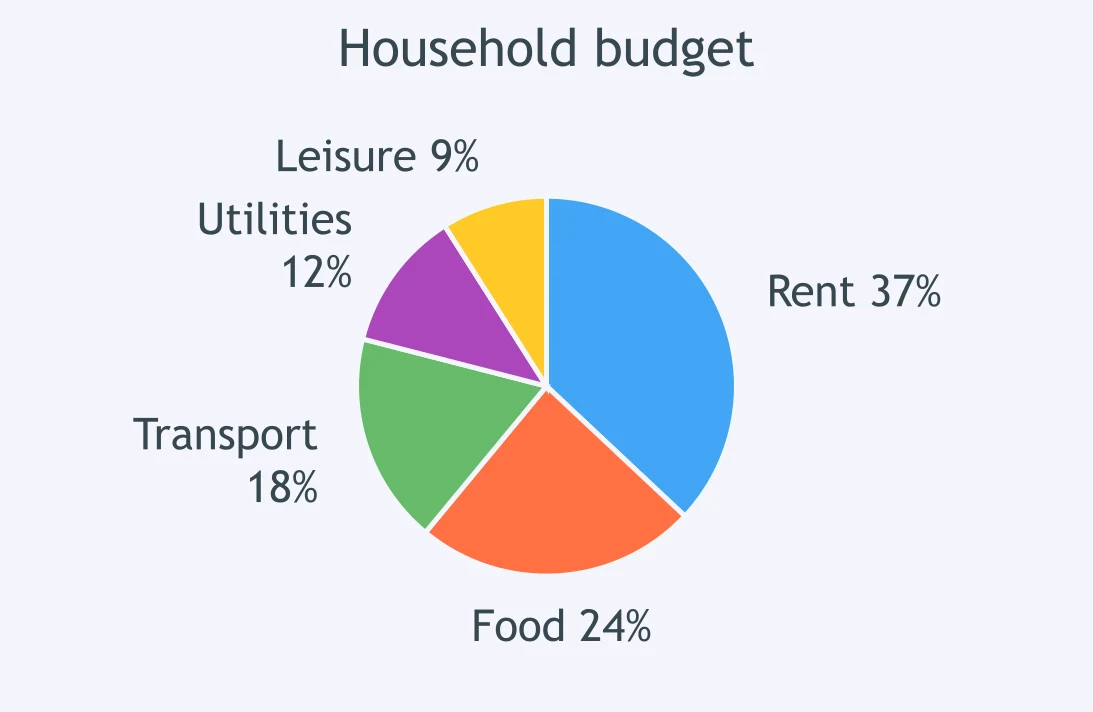
The pie chart shows a household budget. A candidate wrote: 'Rent took over a third of spending and was the largest category.' Which figures support this?
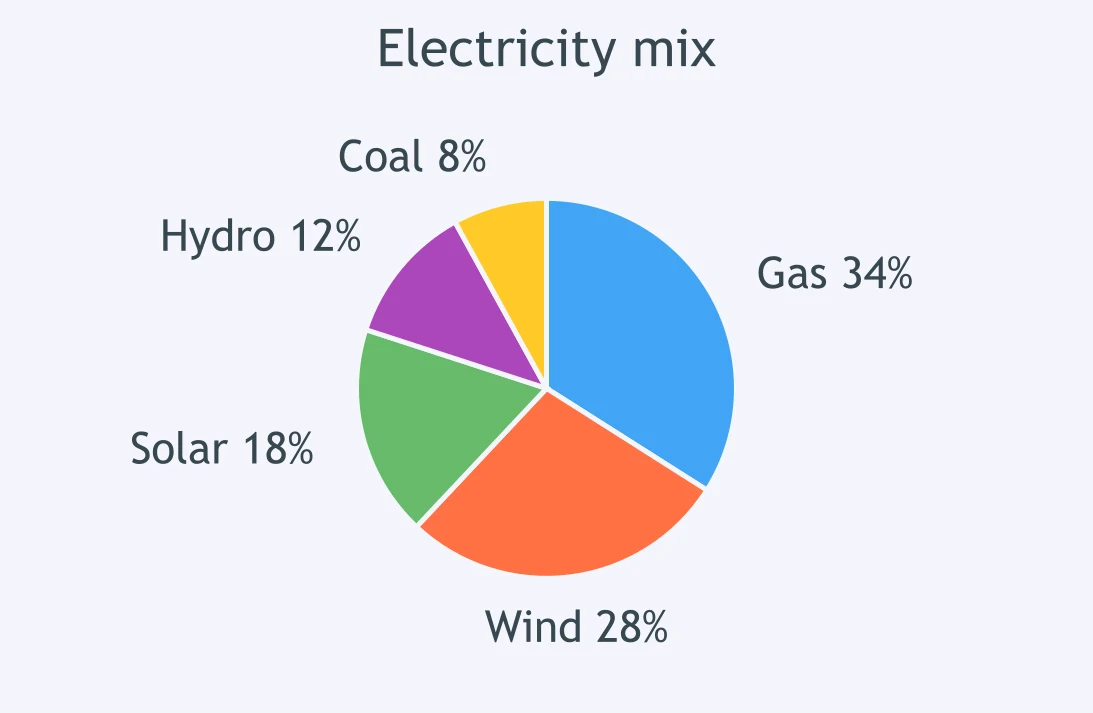
The pie chart shows electricity sources. A candidate wrote: 'Renewables together made up a majority of supply.' Which figures support the claim?
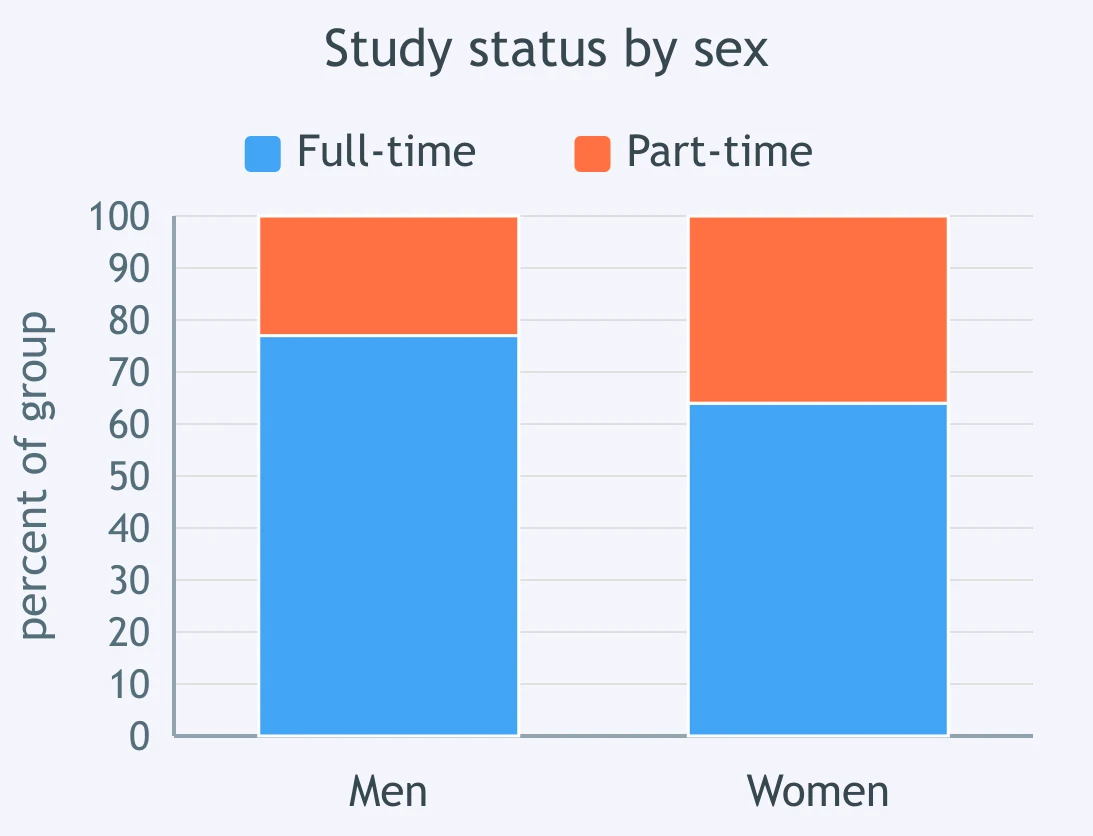
The segmented bar chart shows study status by sex. A candidate wrote: 'Part-time study was just under a quarter for men, but over a third for women.' Which figures support this?
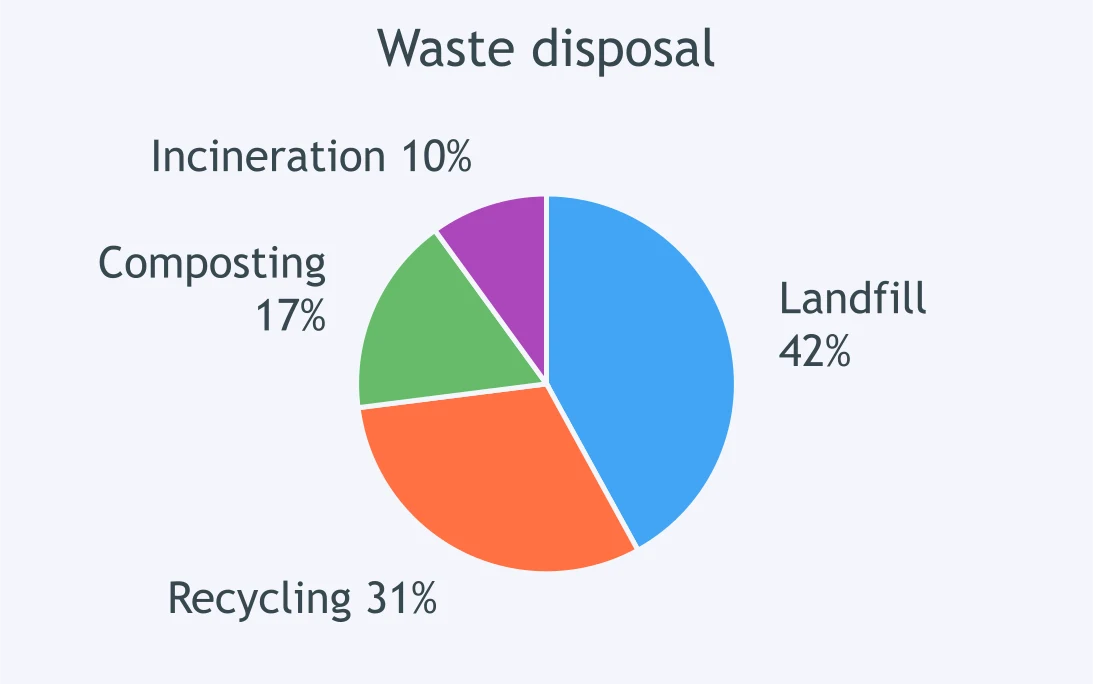
The pie chart shows waste disposal methods. A candidate wrote: 'Recycling and composting together were still below half.' Which figures support this?
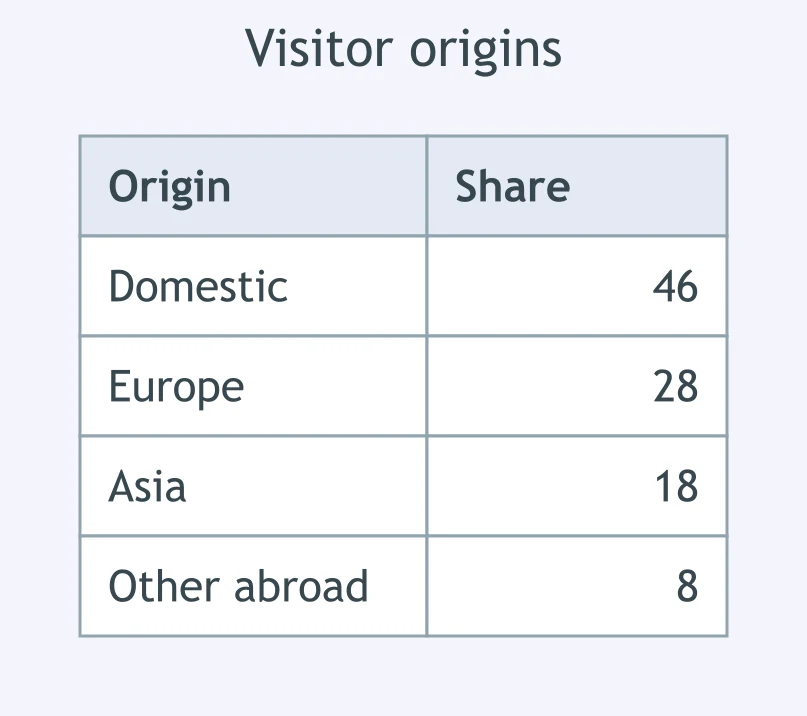
The table shows visitor origins. A candidate wrote: 'Visitors from abroad collectively outnumbered domestic visitors.' Which figures support it?
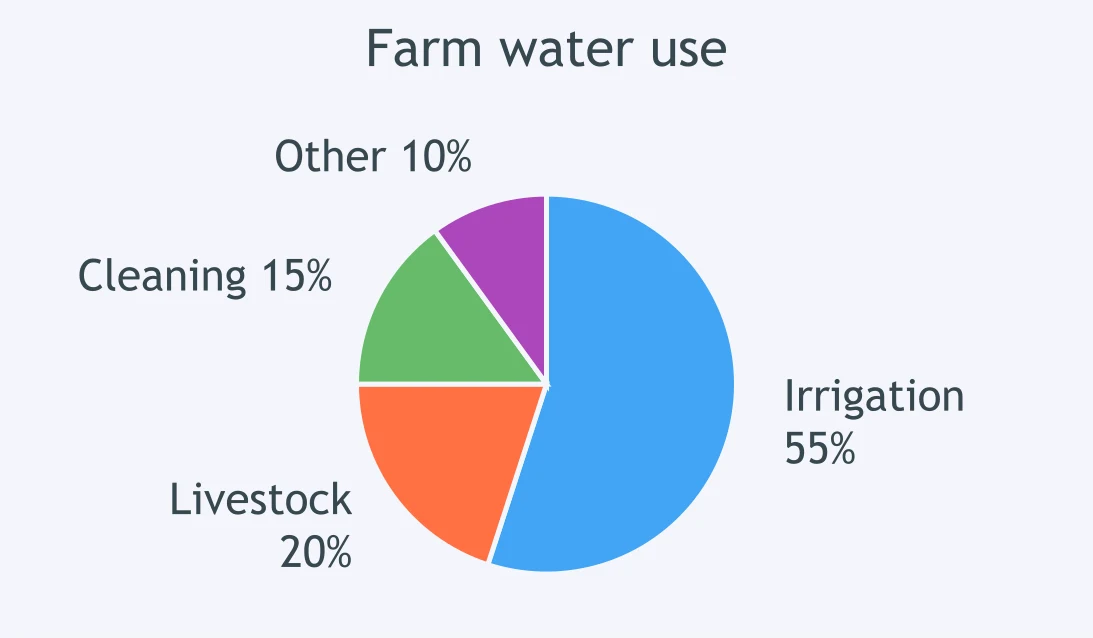
The pie chart shows water use on farms. A candidate wrote: 'Irrigation alone accounted for more than all other uses combined.' Which figures support this?
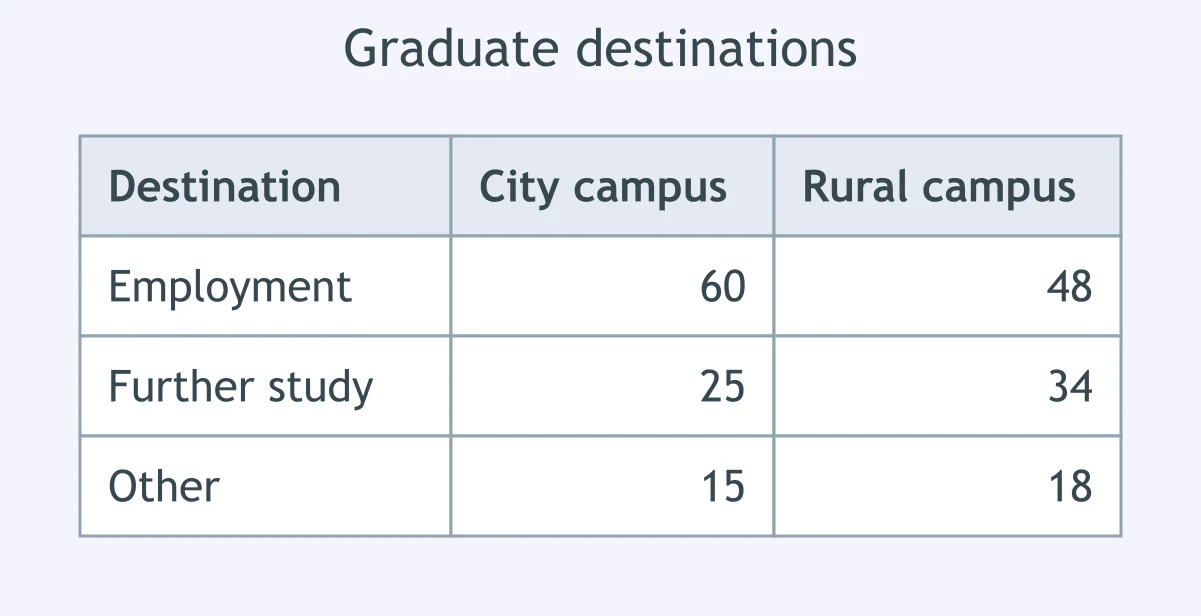
The table shows graduate destinations by campus. A candidate wrote: 'At the city campus, employment accounted for three fifths of outcomes.' Which figures support it?
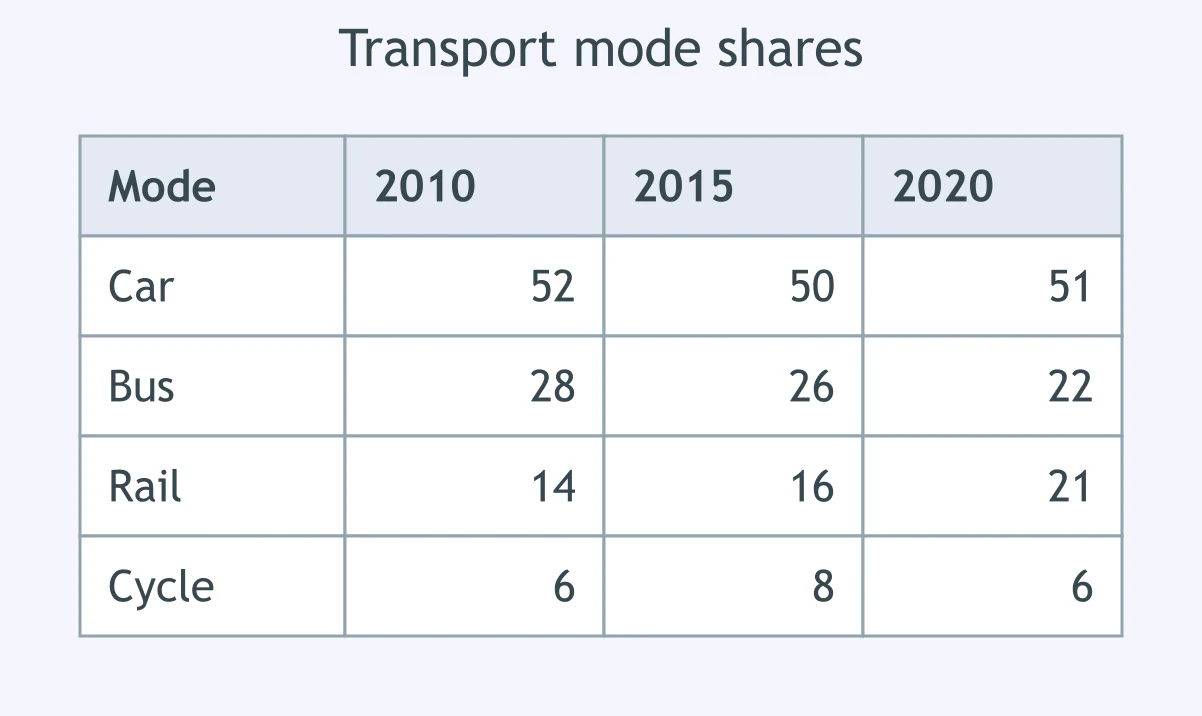
The table shows transport mode shares from 2010 to 2020. A candidate wrote: 'Rail was the only mode to rise at every point shown.' Which evidence supports this?
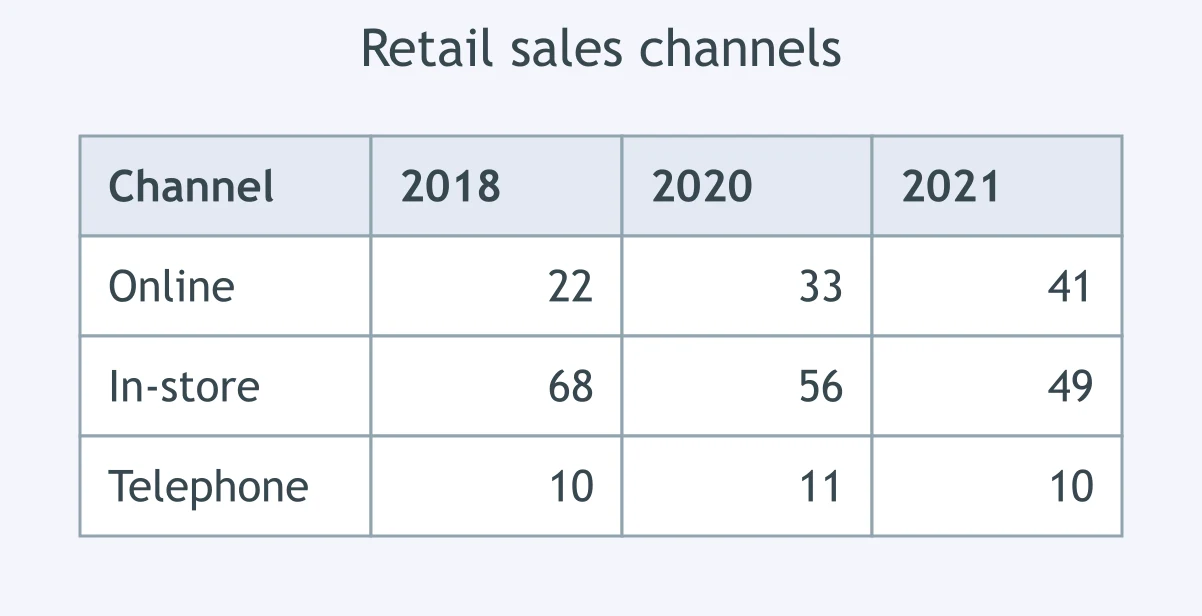
The table shows retail sales channels from 2018 to 2021. A candidate wrote: 'Only online sales increased every year.' Which evidence supports the claim?
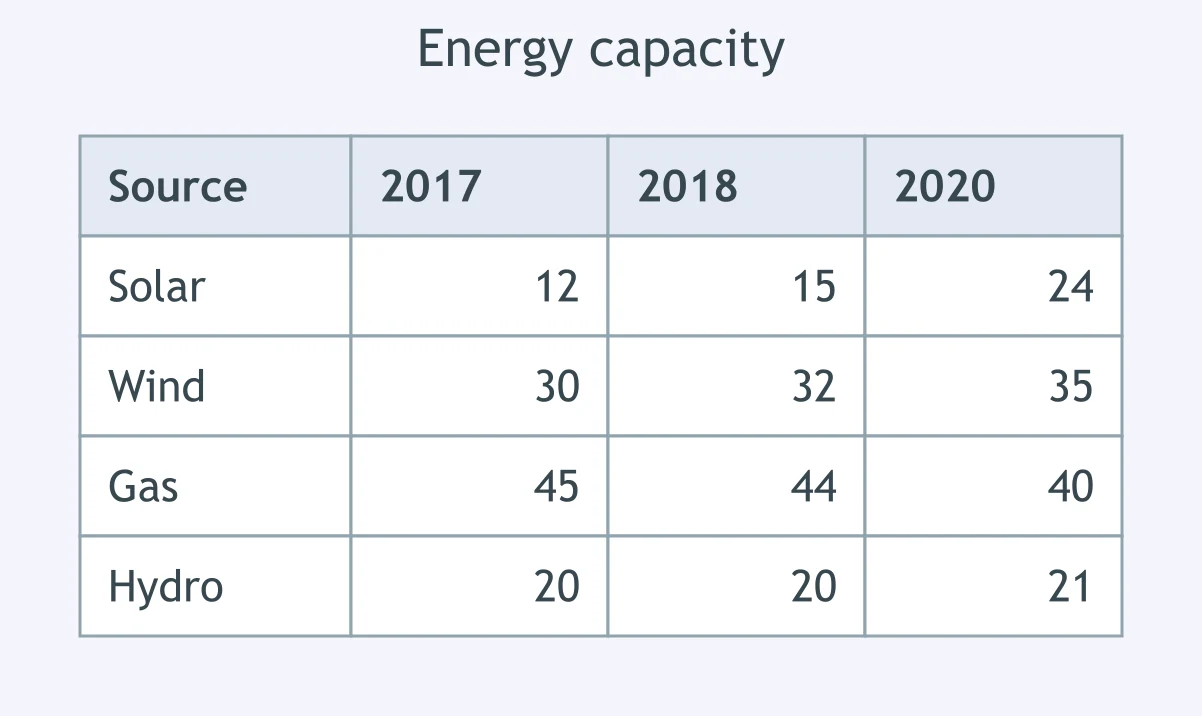
The table shows energy capacity by source from 2017 to 2020. A candidate wrote: 'Gas was the only source to decline throughout.' Which figures support it?
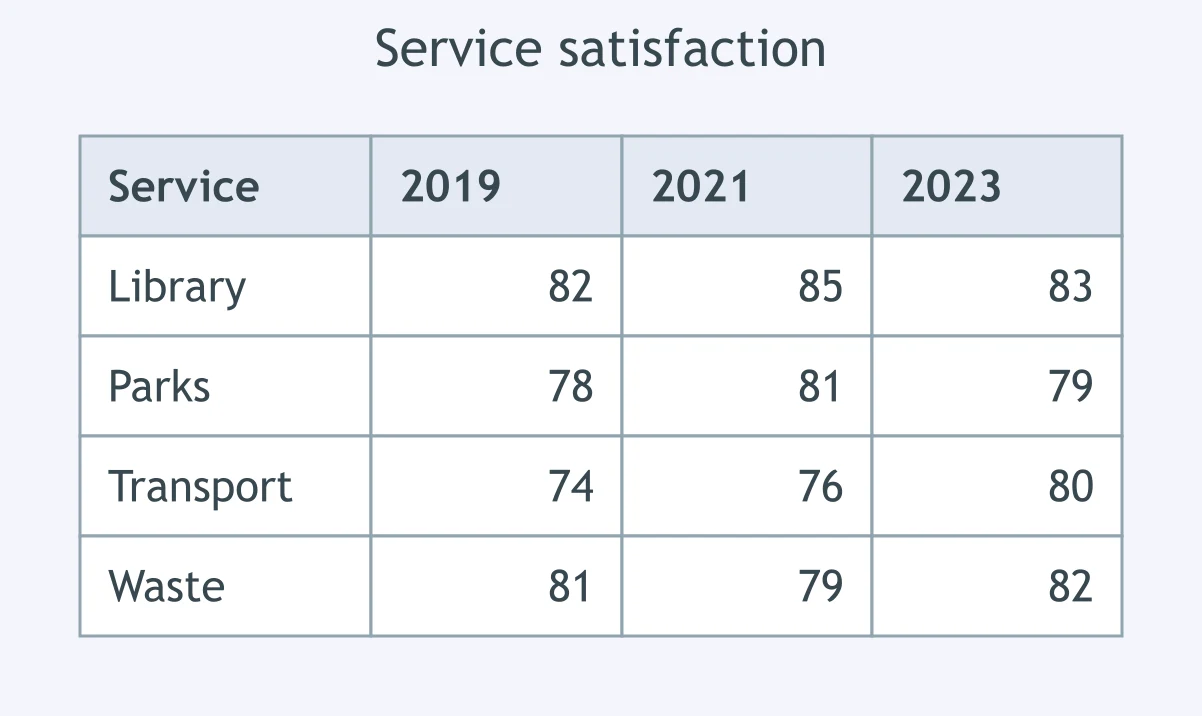
The table shows satisfaction with services. A candidate wrote: 'The library was the only service above 80% in every year shown.' Which evidence supports this?
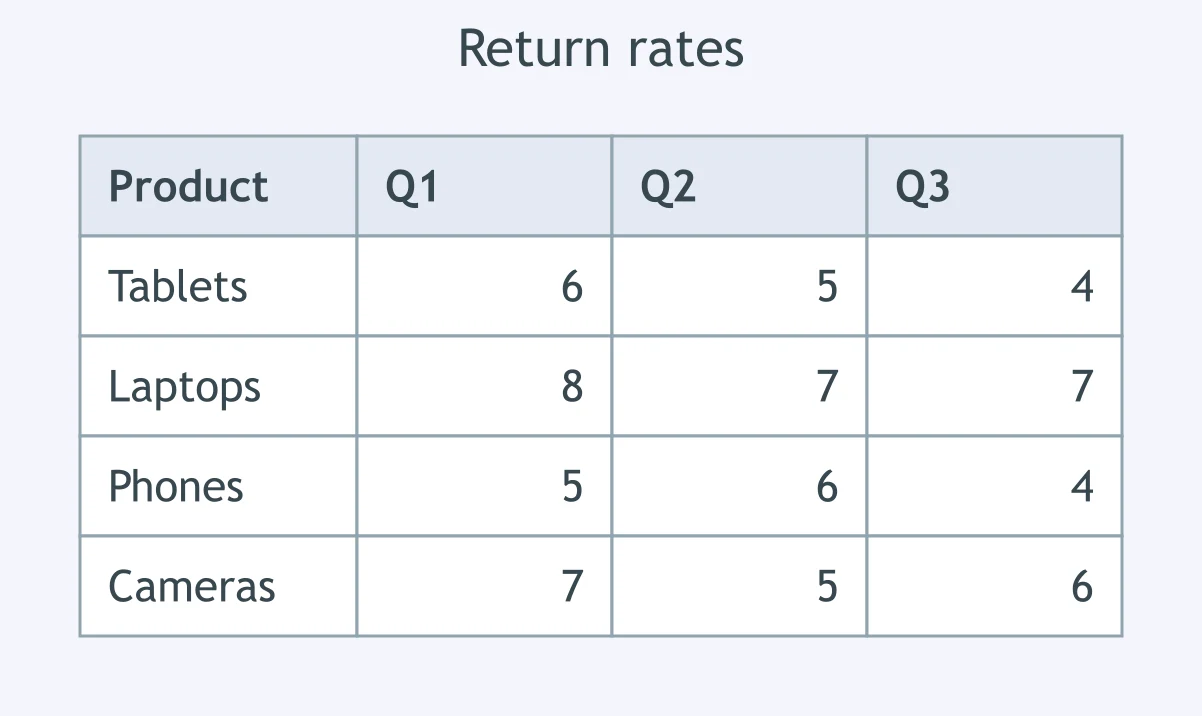
The table shows product return rates by quarter. A candidate wrote: 'Tablets were the only product with a lower return rate each quarter.' Which figures support this?
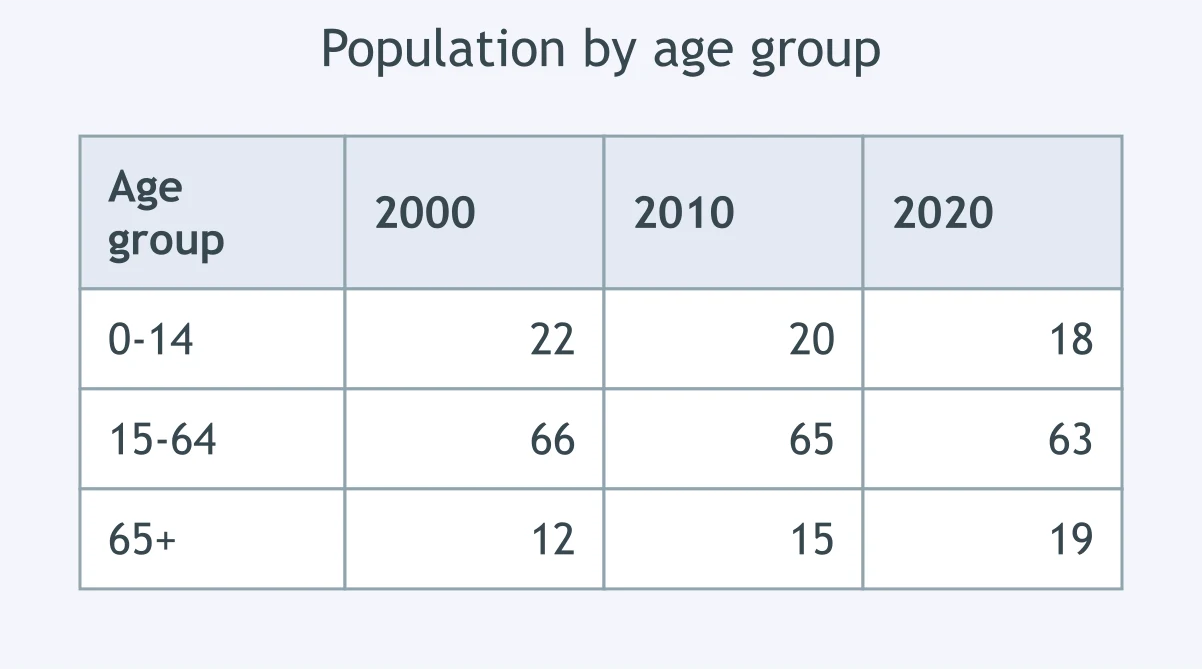
The table shows population shares by age group. A candidate wrote: 'The 65+ group was the only group whose share rose in every census year.' Which evidence supports this?
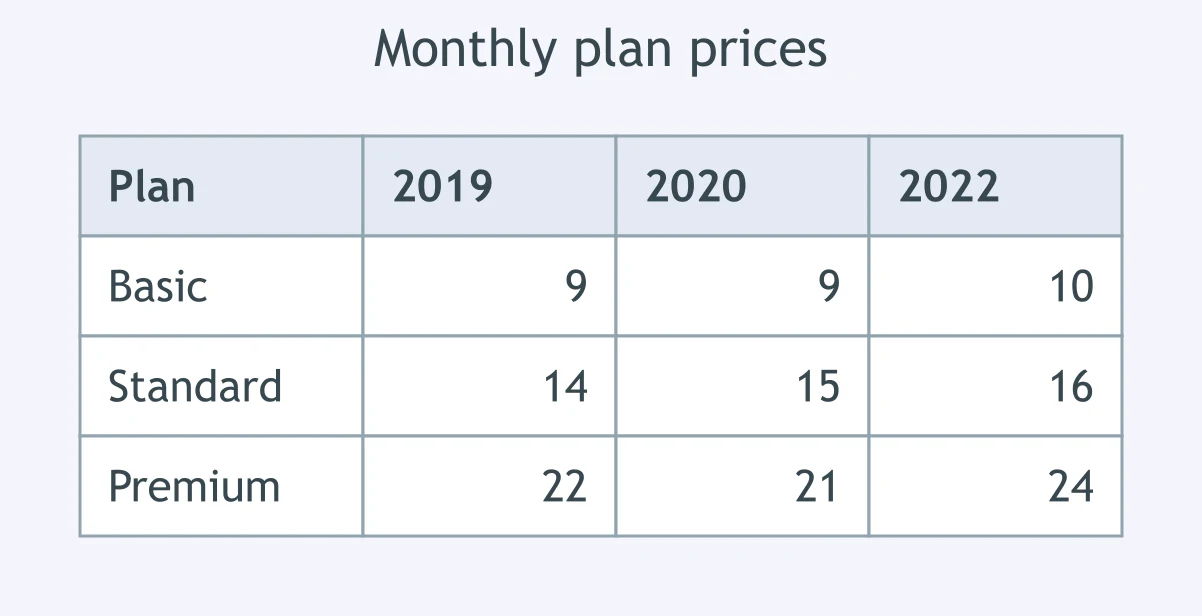
The table shows monthly prices for three plans. A candidate wrote: 'Throughout the period, the basic plan remained the cheapest option.' Which figures support this?
Crack the passcode before the zombies get in.

Pick a tile, answer, hit bonuses and steals.

Opinion Essays: Agree or Disagree - IELTS 6.0 W T2
25 questions