Loading
by BlastRoom
Complete a description of a trend shown on a projected line graph using rise, fall and stay-the-same language.
#graphs

20 questions
One question set, multiple game modes. Tap any game to see it in action. Not sure which to pick?
Answer to place stones and capture territory.
Outrun the snow together.
Earn blasts, then hunt the other team.
Answer to earn energy, then climb.

The class blasts through walls together.
Bid on mystery lots. Most money wins.
Sell tours. Nice, standard, or a total scam.

Answer, restock, and serve the rush.
More correct answers pulls the rope your way.
Answer, then shoot down the alien wave.
Answer, then tap to leap the frozen ridge.
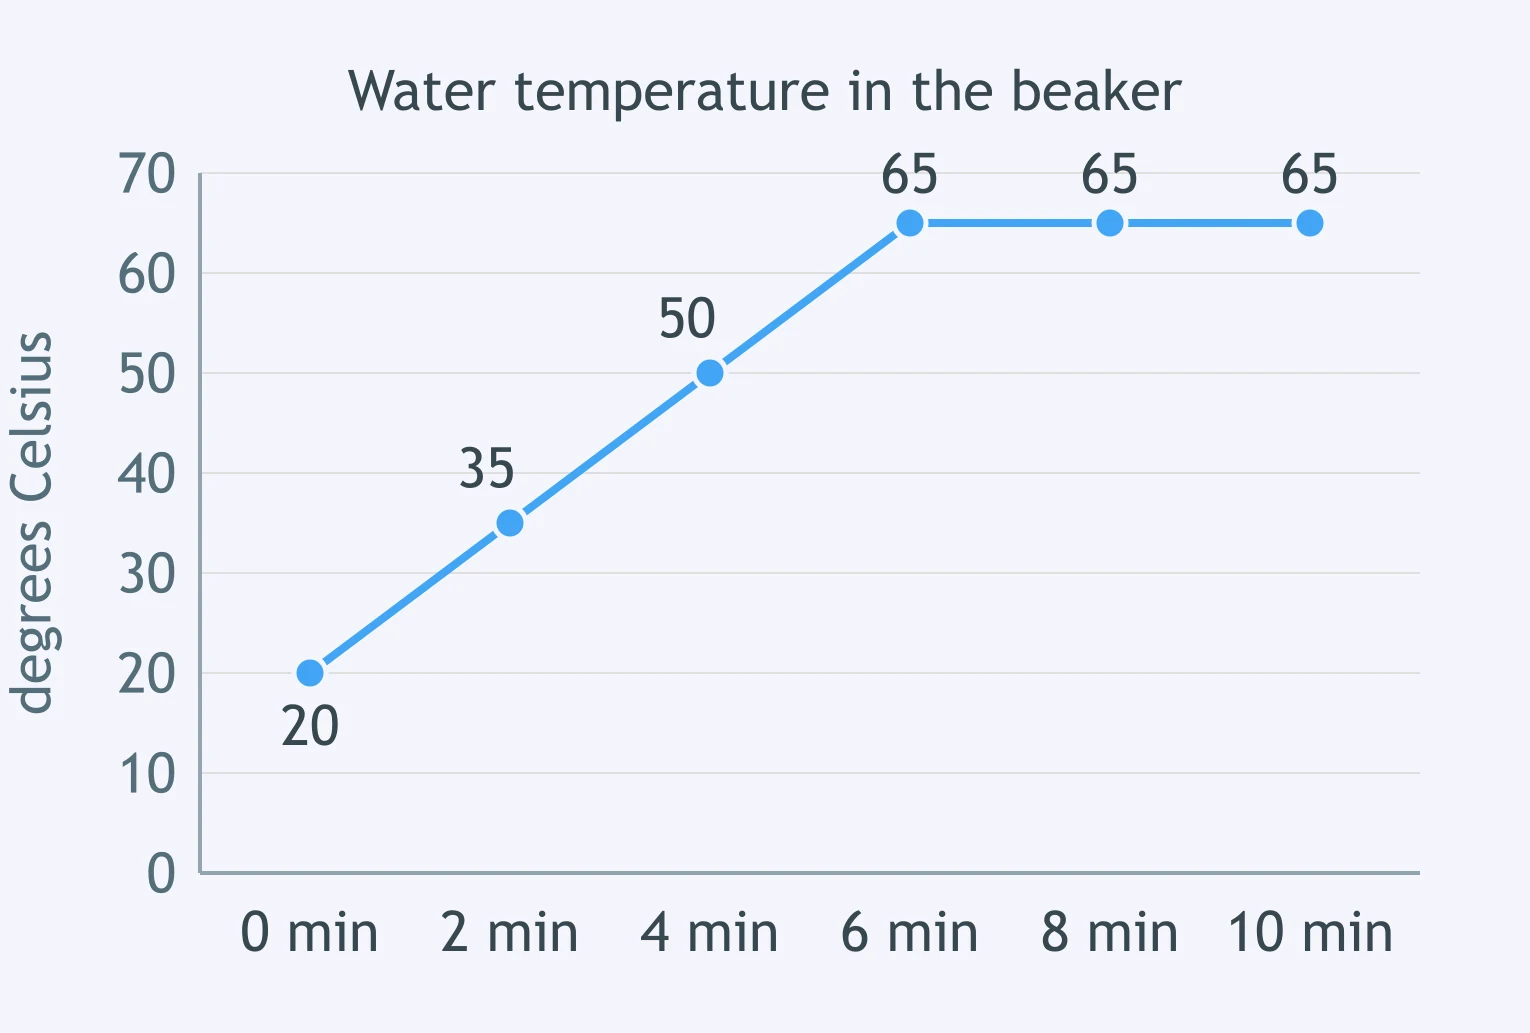
Look at the graph. Between minute 0 and minute 6, the temperature of the water ___.
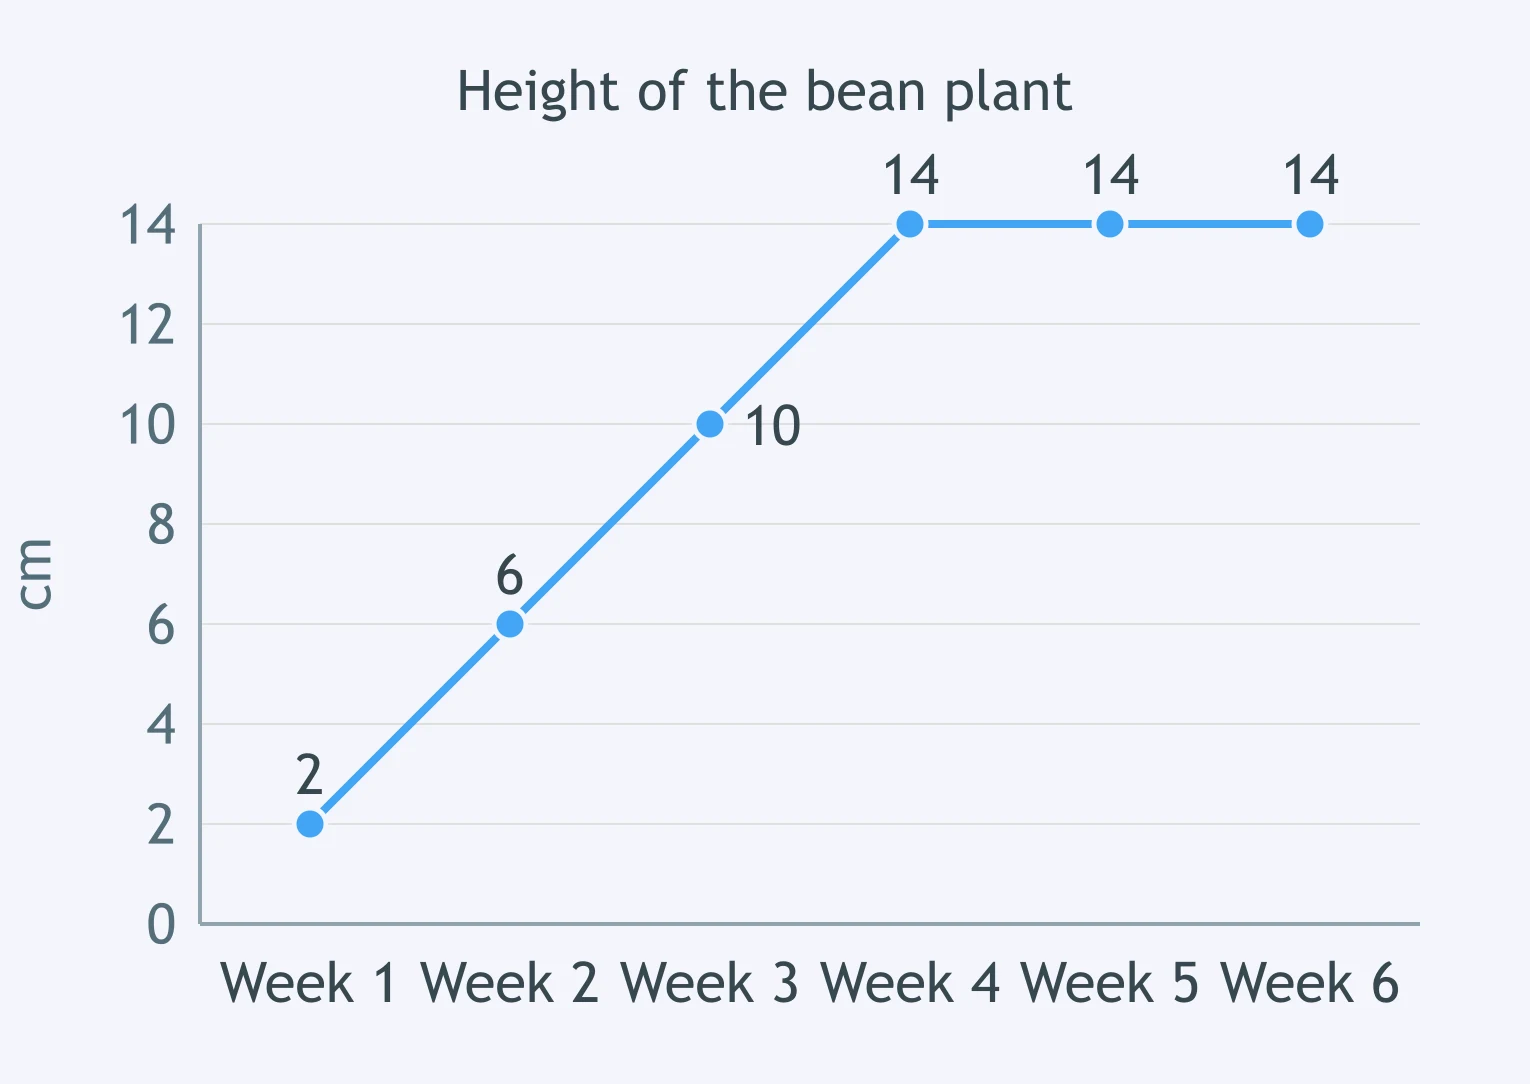
Look at the graph. Between week 4 and week 6, the height of the bean plant ___.
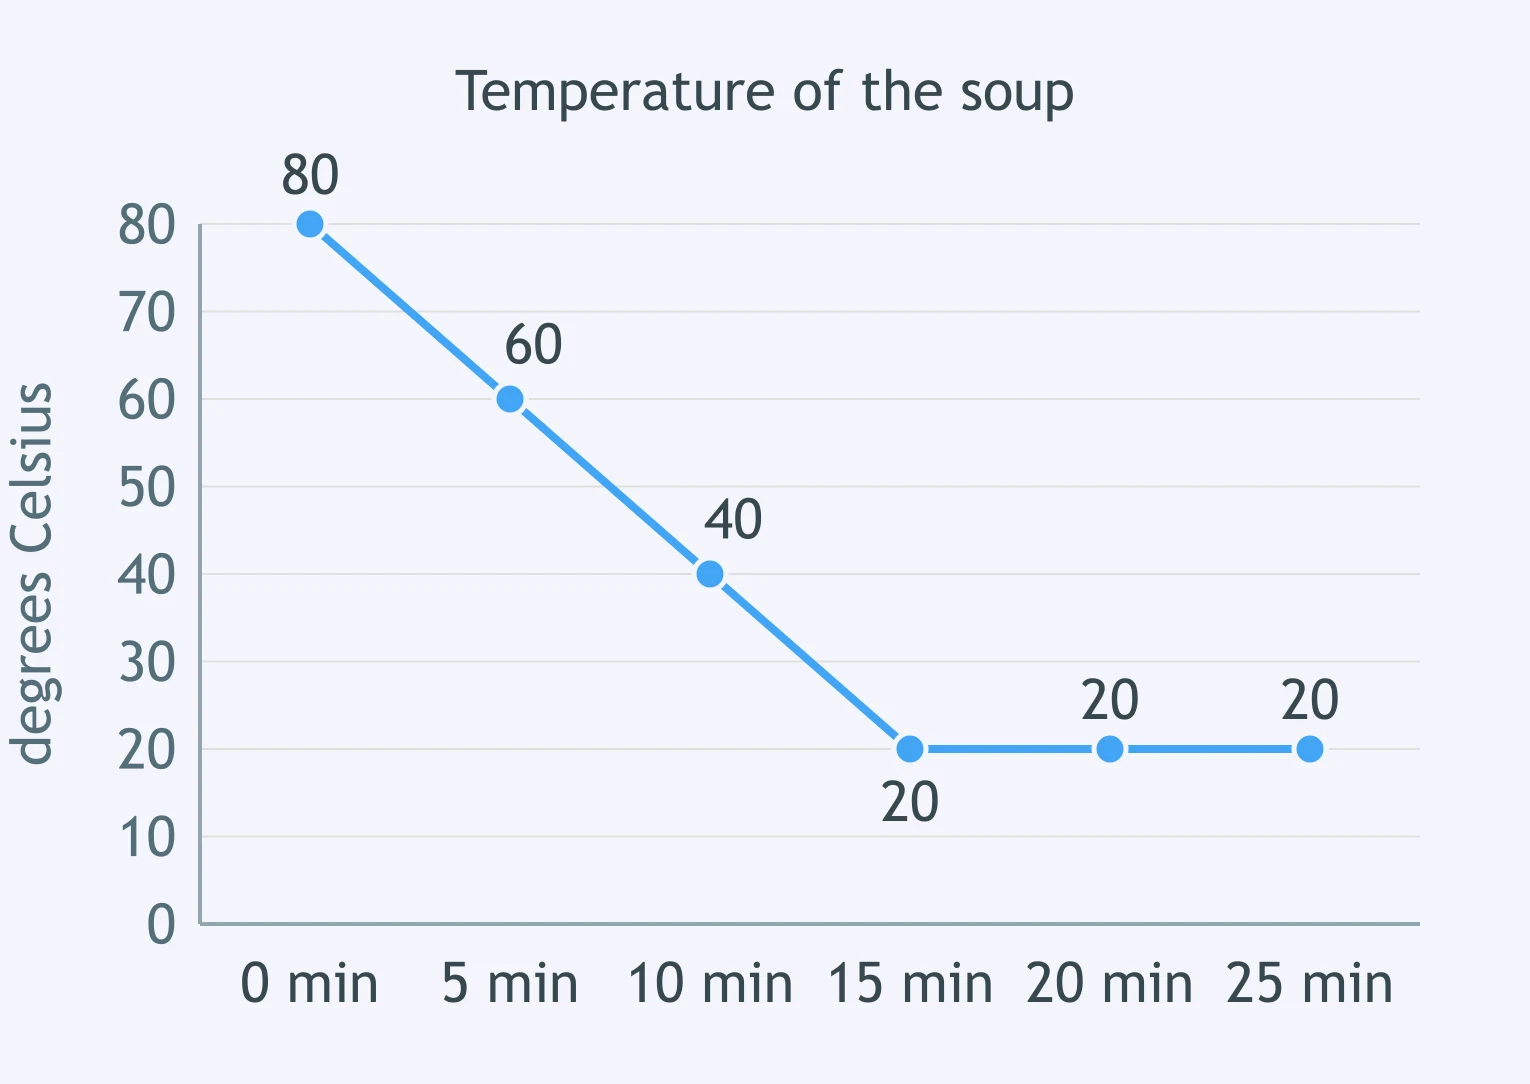
Look at the graph. Between minute 0 and minute 15, the temperature of the soup ___.
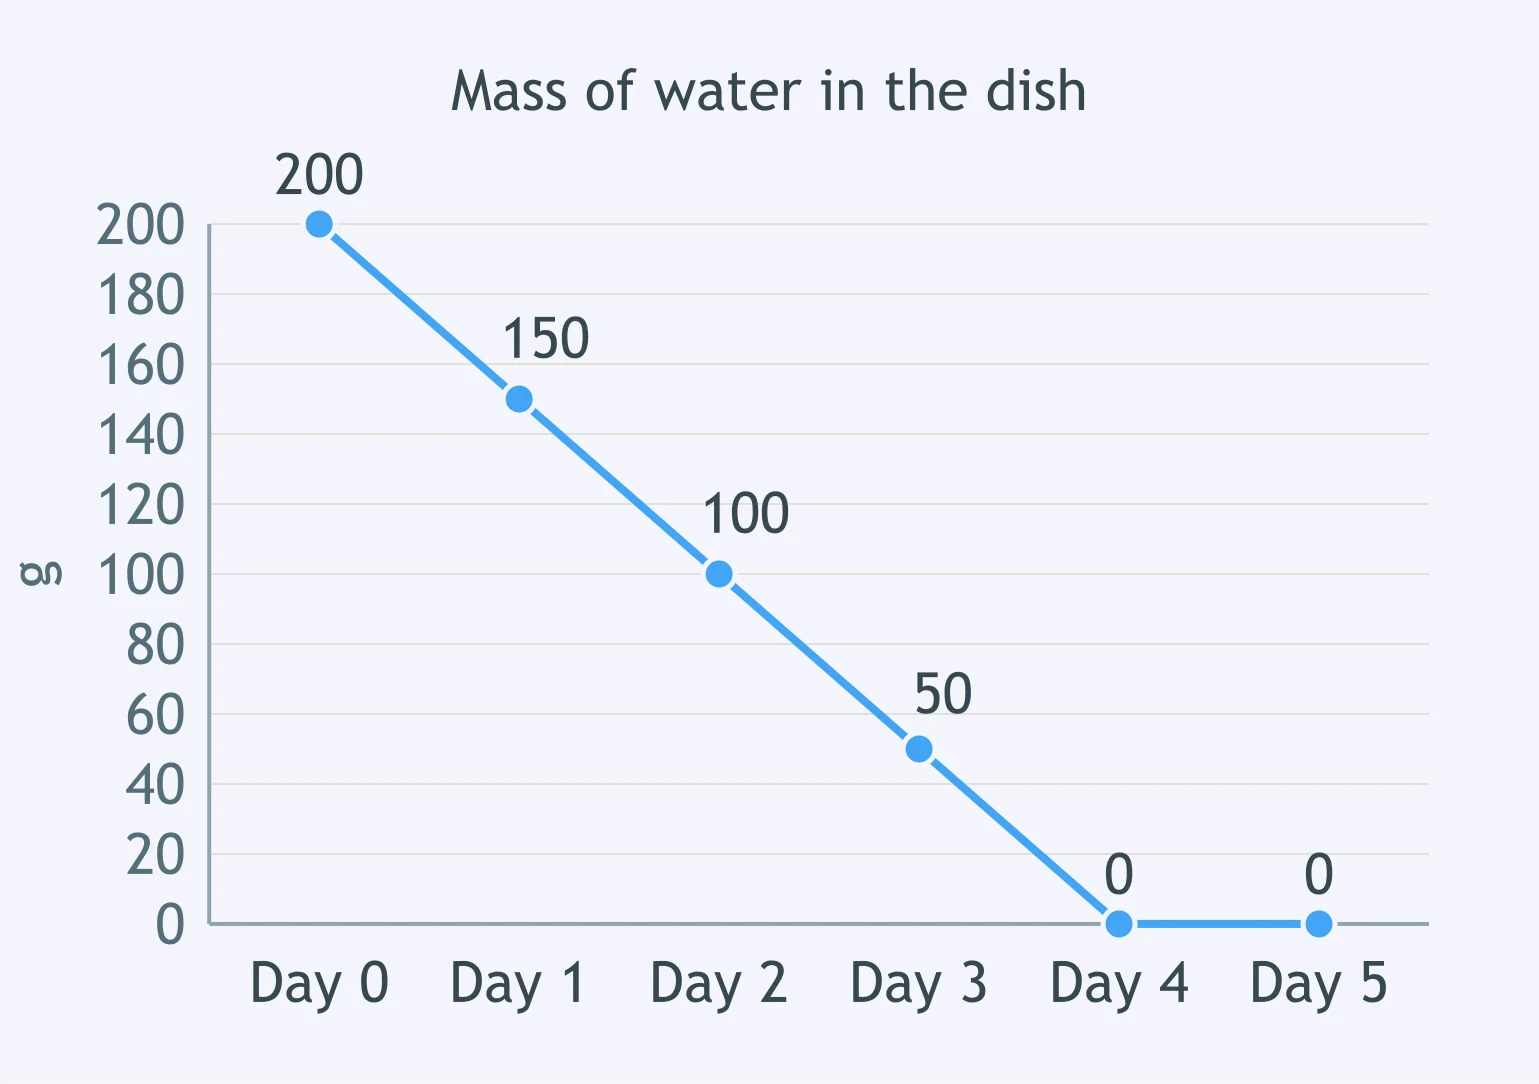
Look at the graph. Between day 0 and day 4, the mass of the water in the dish ___.
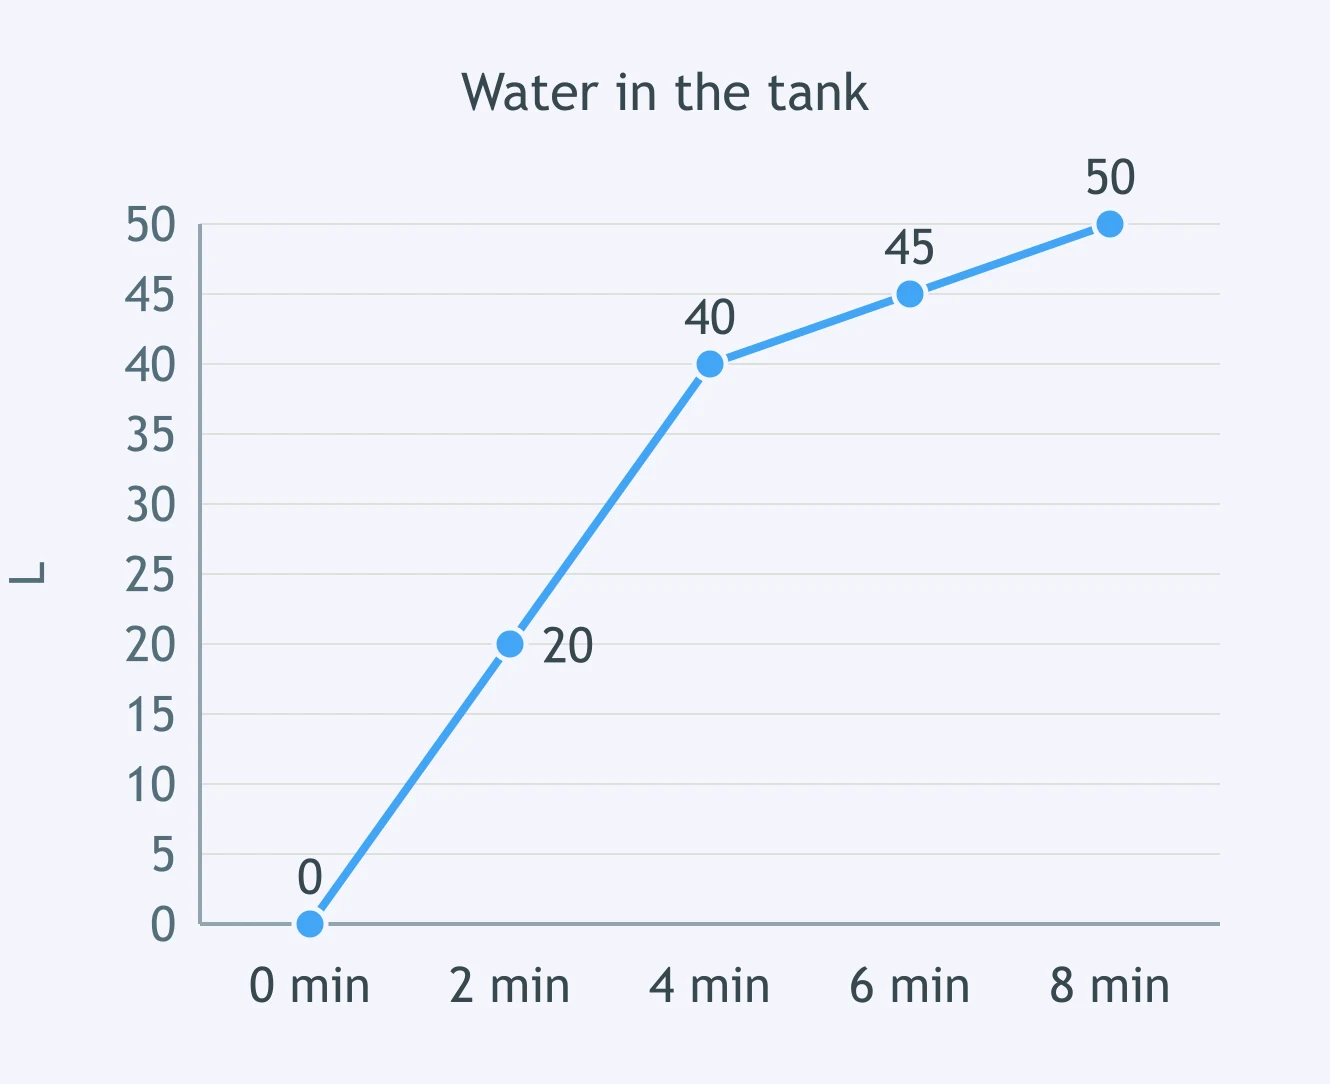
Look at the graph. Between minute 4 and minute 8, the amount of water in the tank ___.
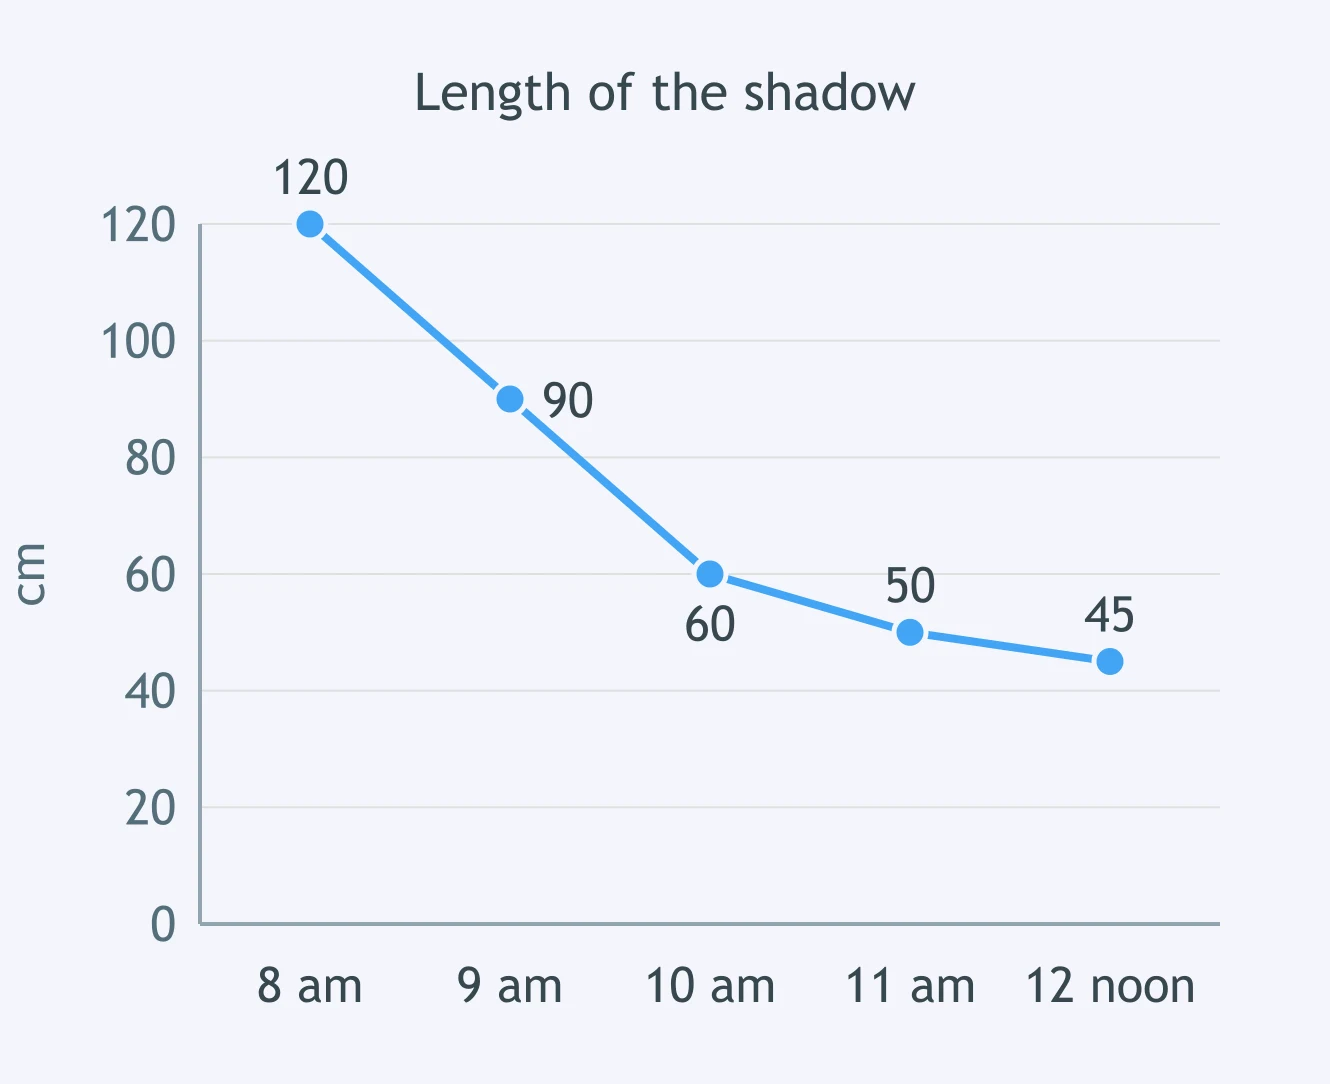
Look at the graph. Between 8 am and 10 am, the length of the shadow ___.
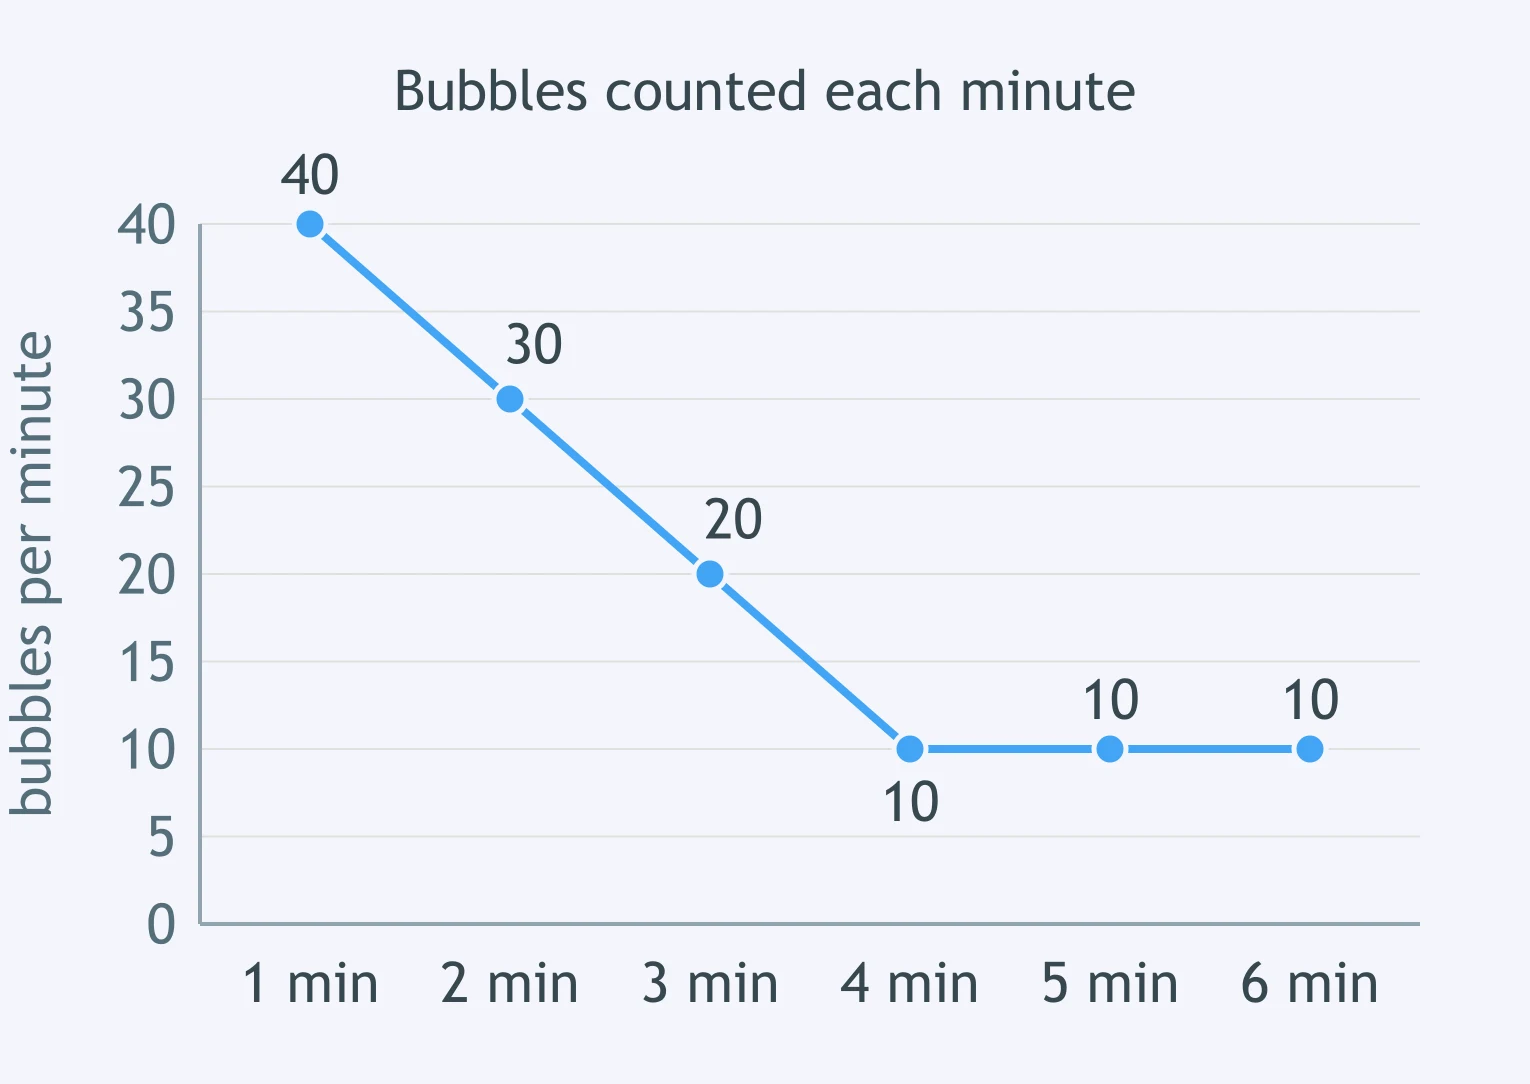
Look at the graph. Between minute 1 and minute 4, the number of bubbles counted each minute ___.
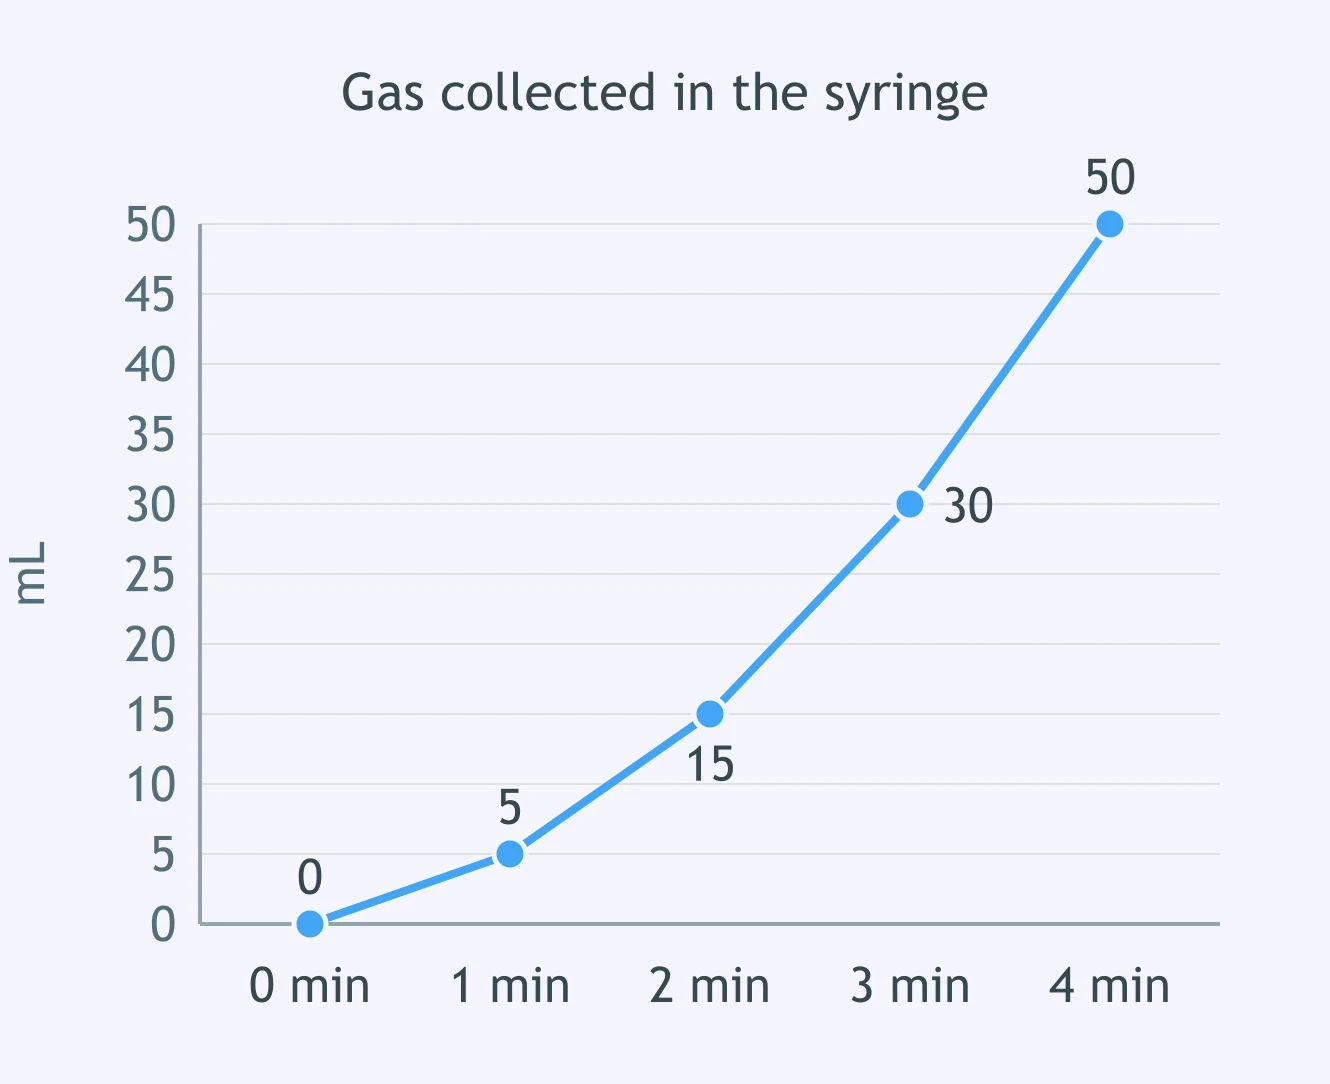
Look at the graph. Between minute 2 and minute 4, the volume of gas in the syringe ___.
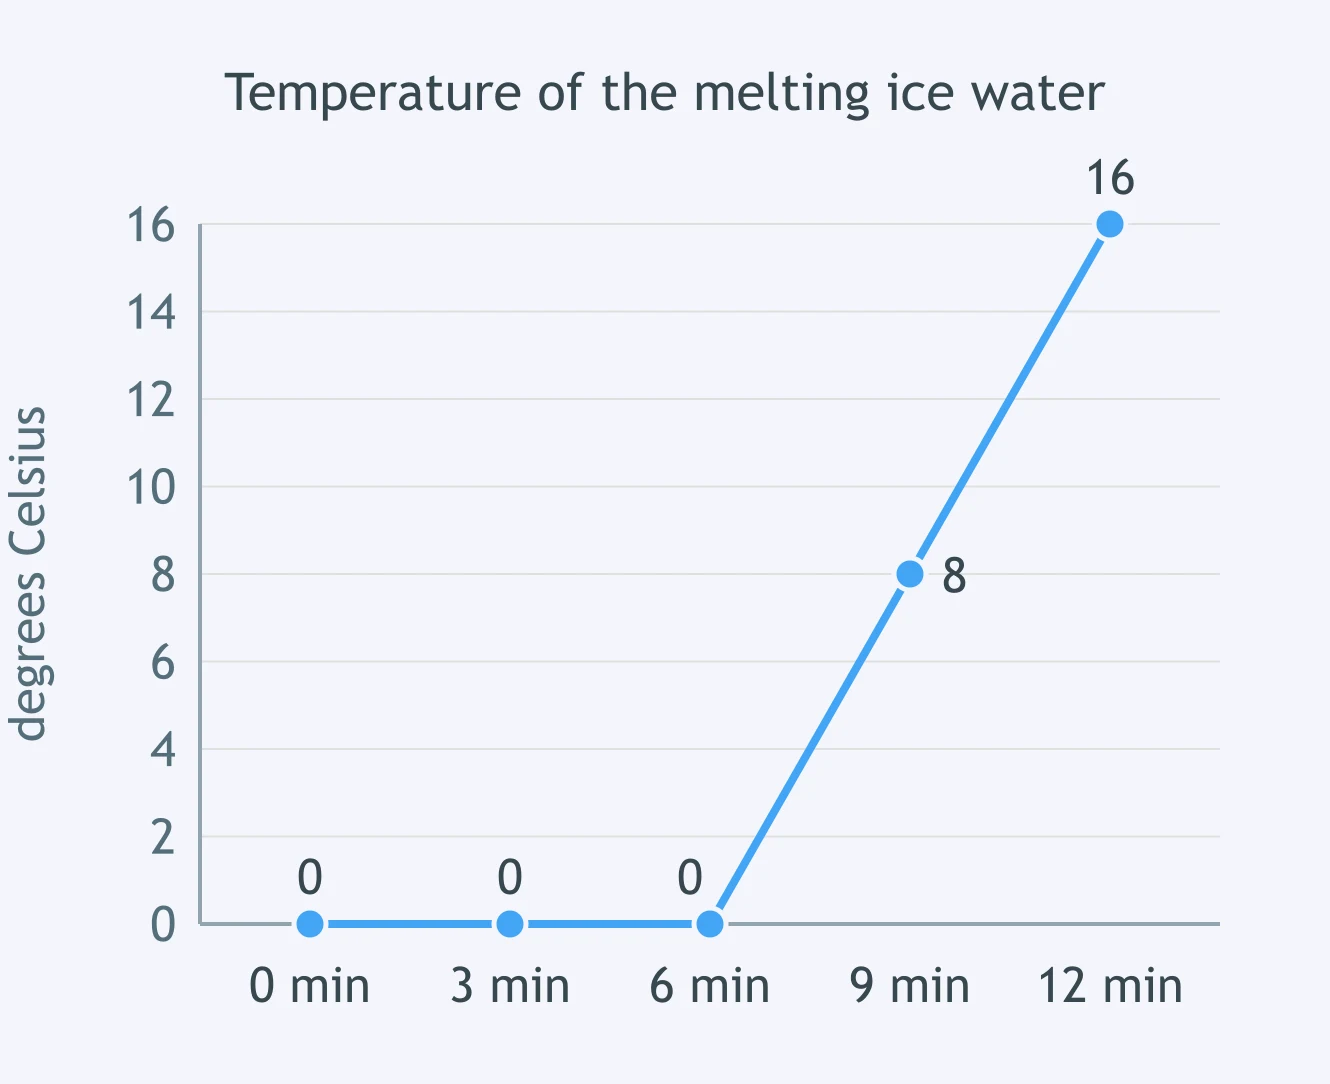
Look at the graph. Between minute 0 and minute 6, the temperature of the melting ice water ___.
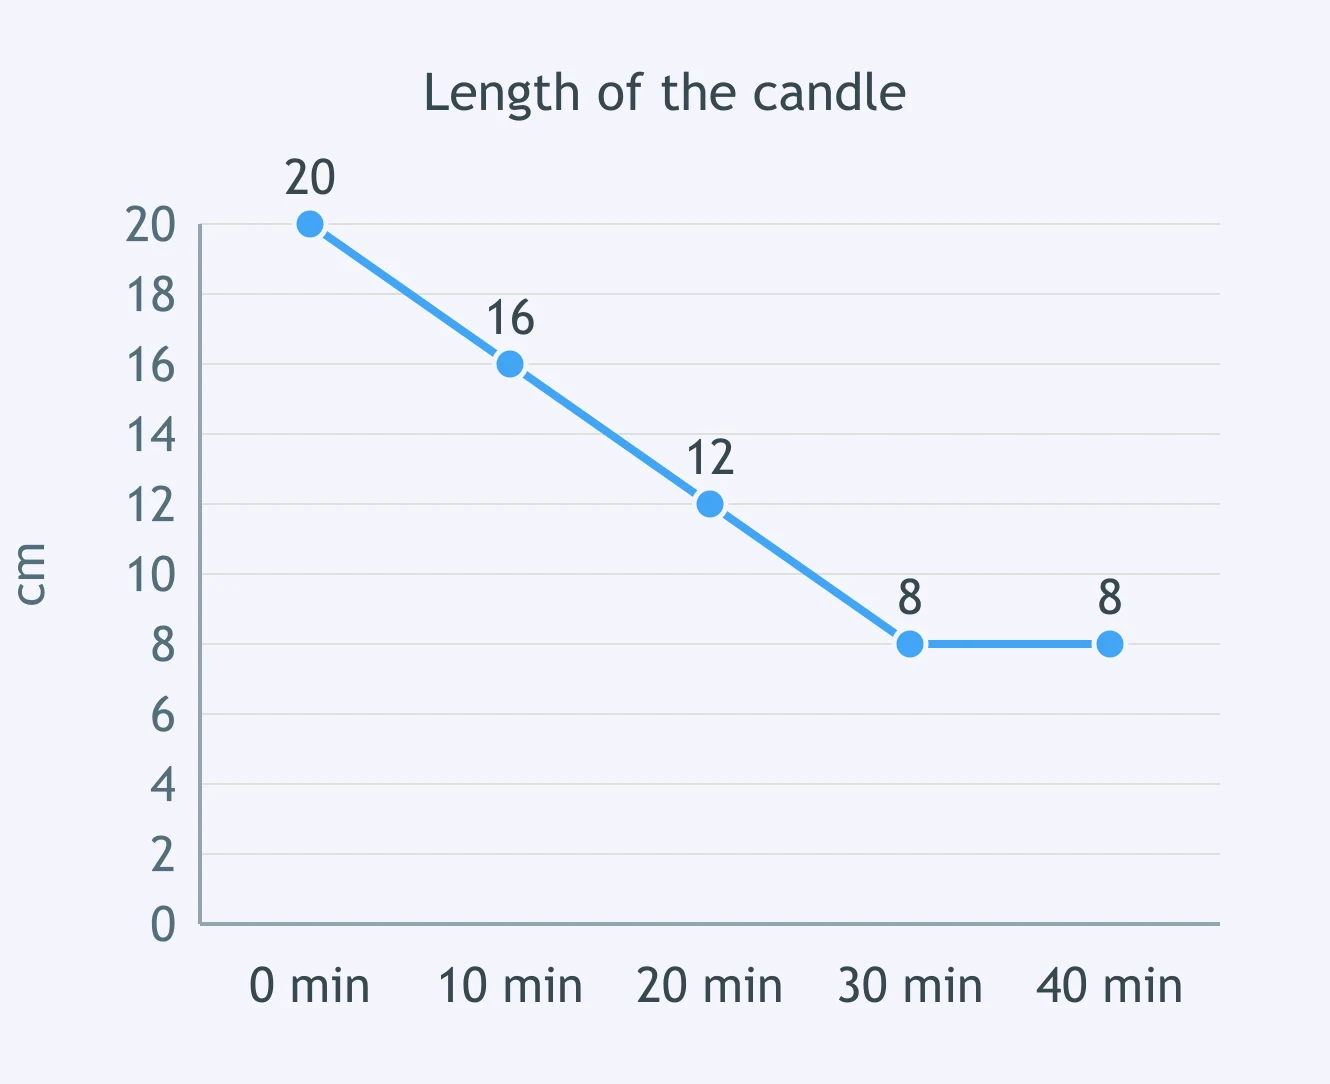
Look at the graph. Between minute 0 and minute 30, the length of the candle ___.
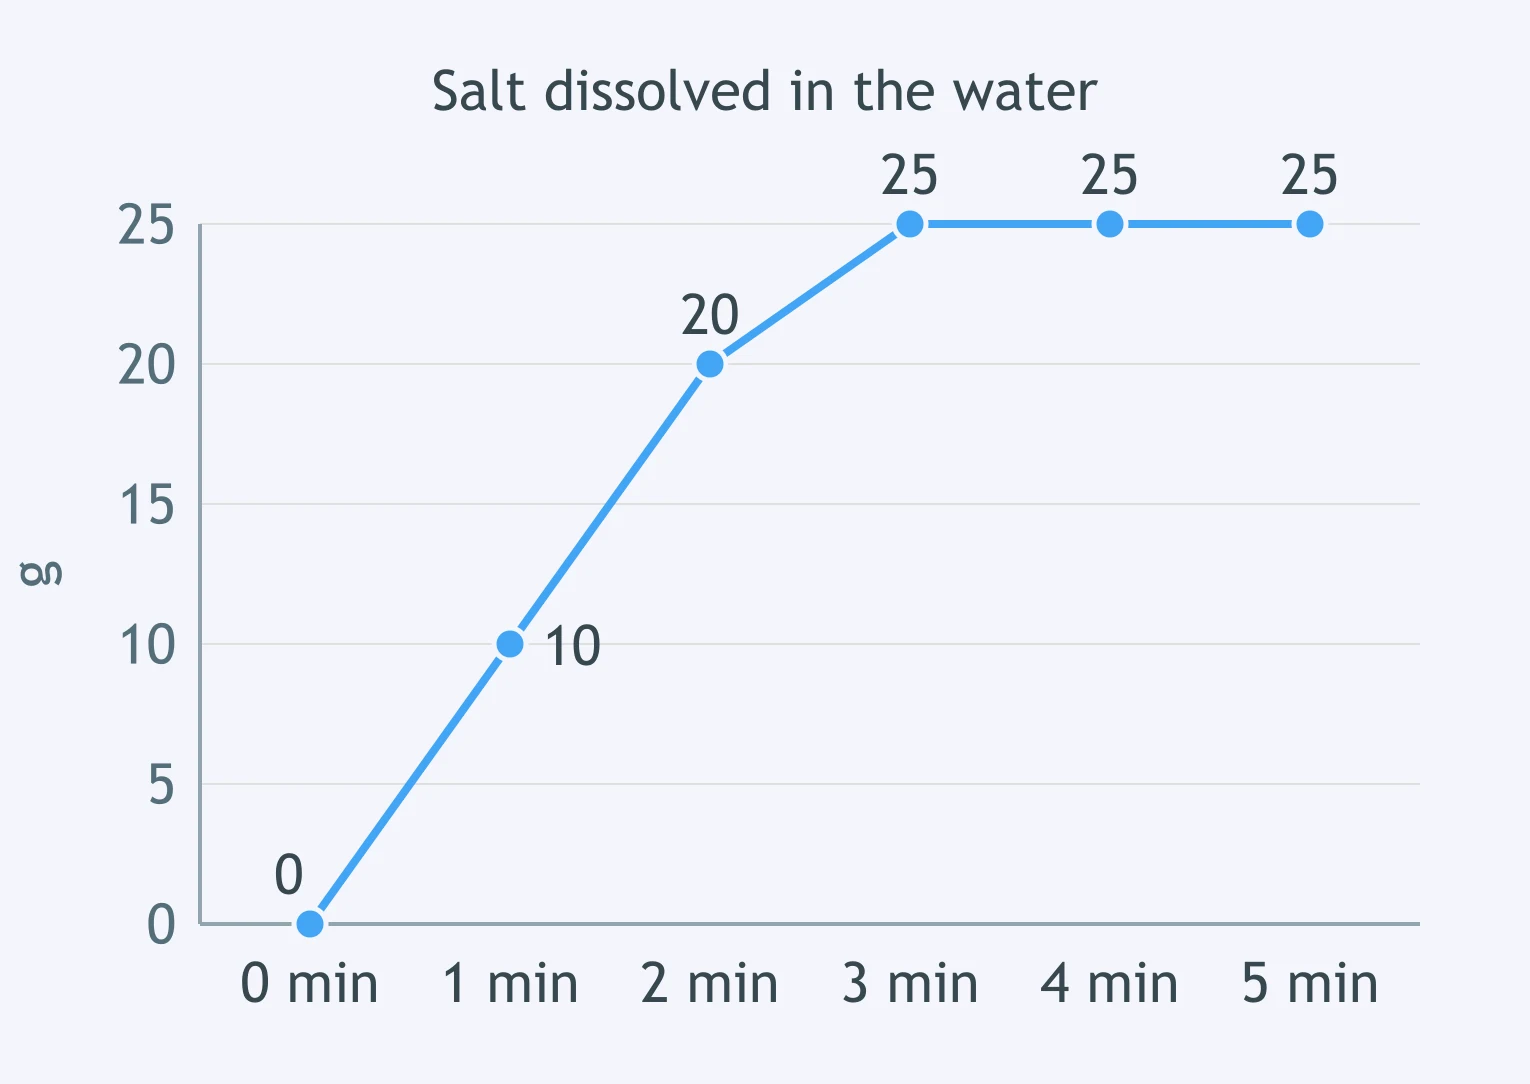
Look at the graph. Between minute 0 and minute 5, the amount of salt dissolved in the water ___.
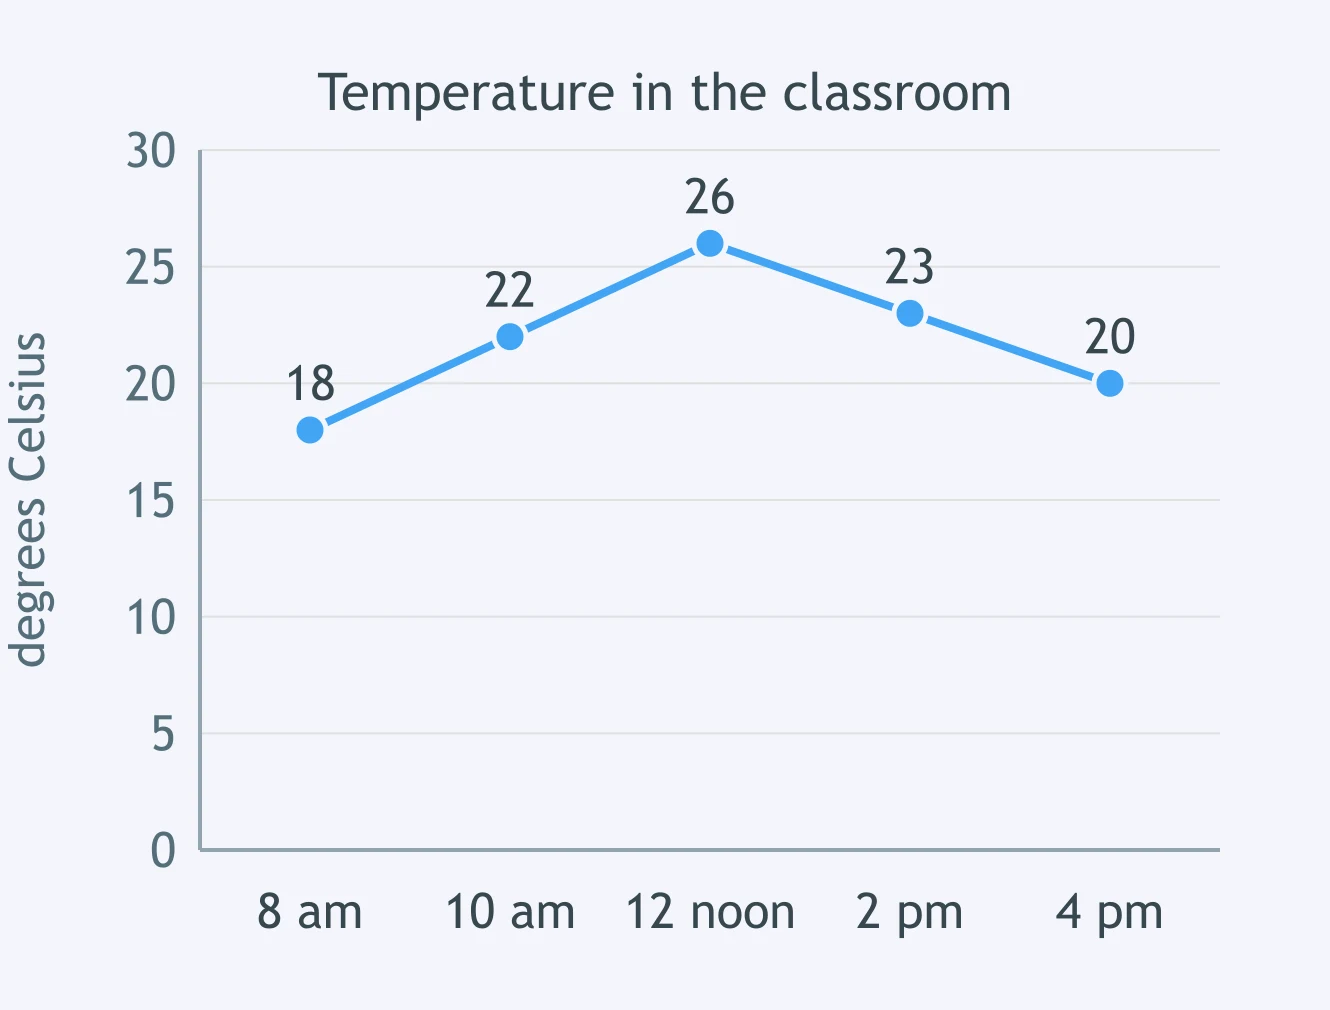
Look at the graph. Between 12 noon and 4 pm, the temperature in the classroom ___.
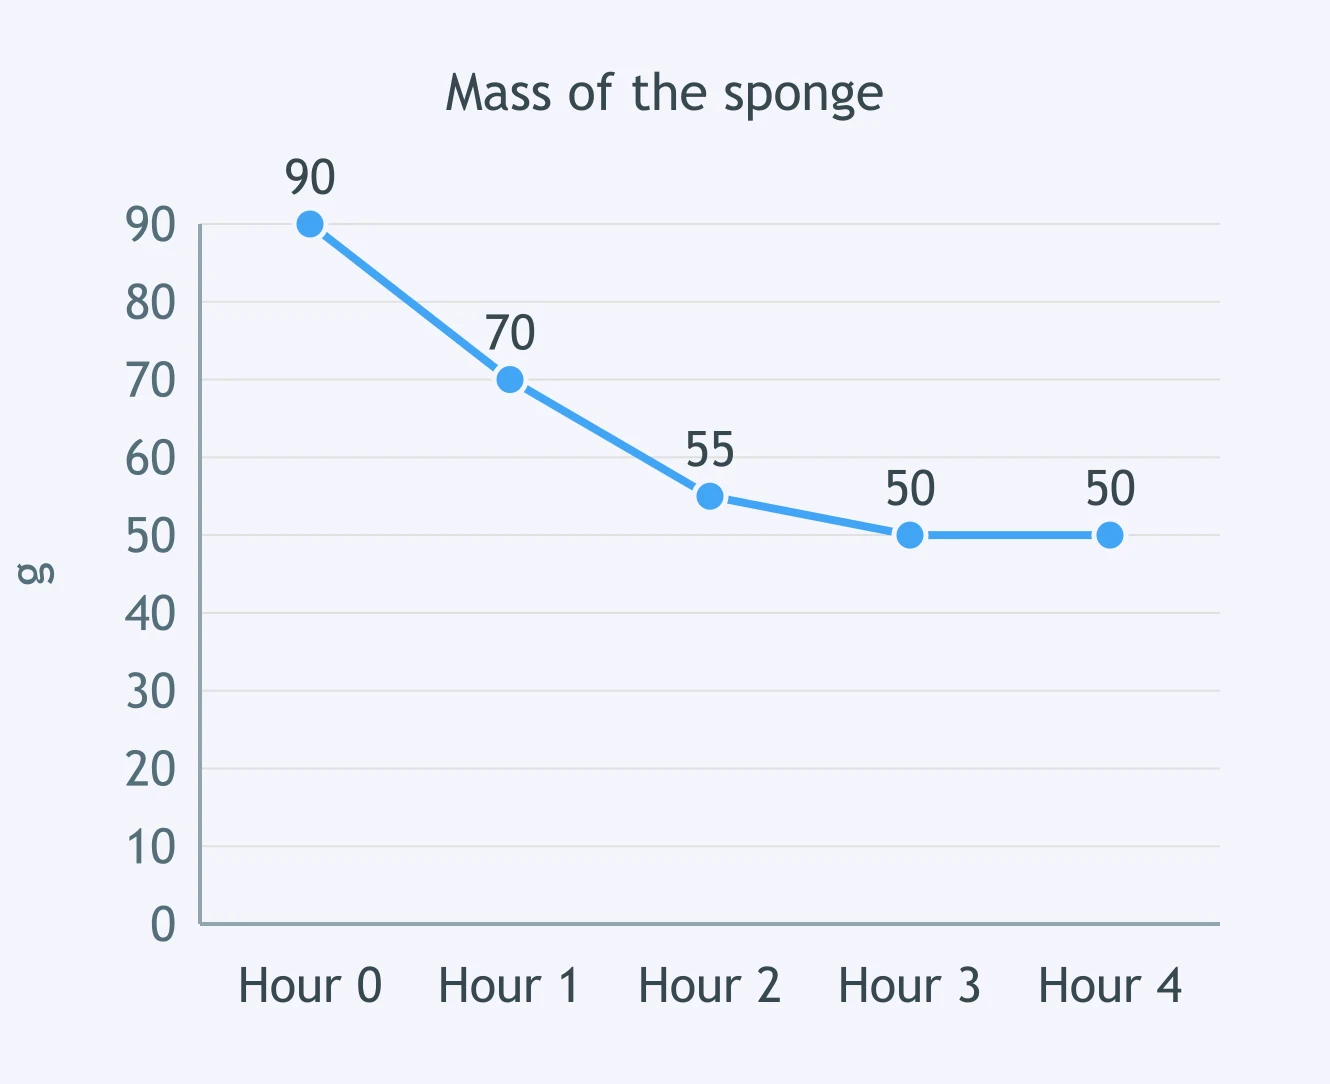
Look at the graph. Between hour 2 and hour 4, the mass of the wet sponge ___.
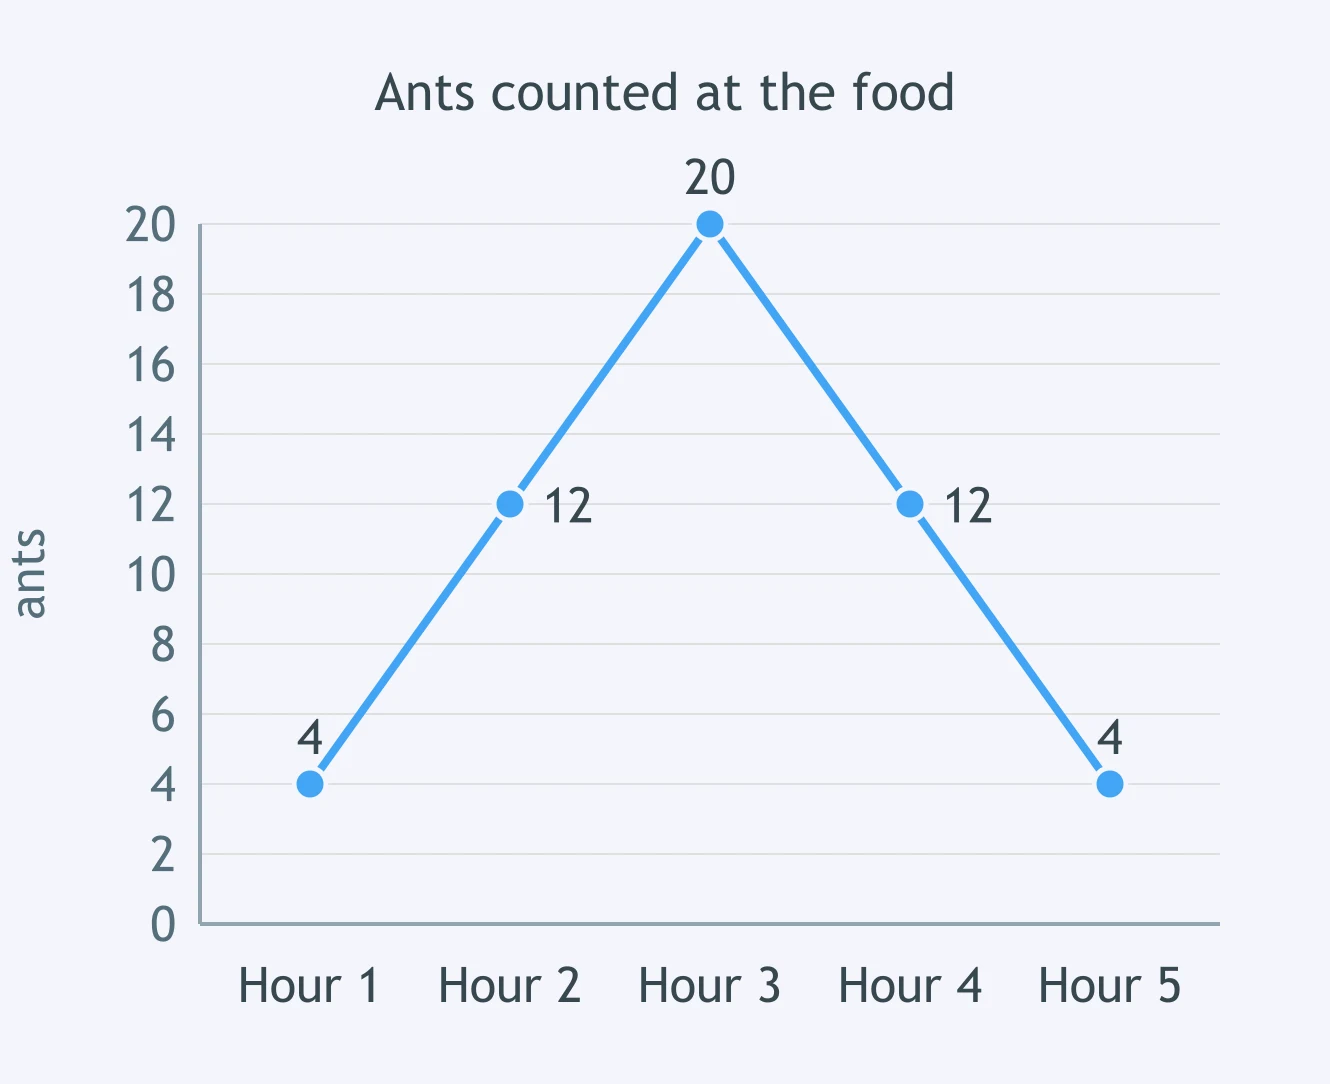
Look at the graph. Between hour 1 and hour 3, the number of ants at the food ___.
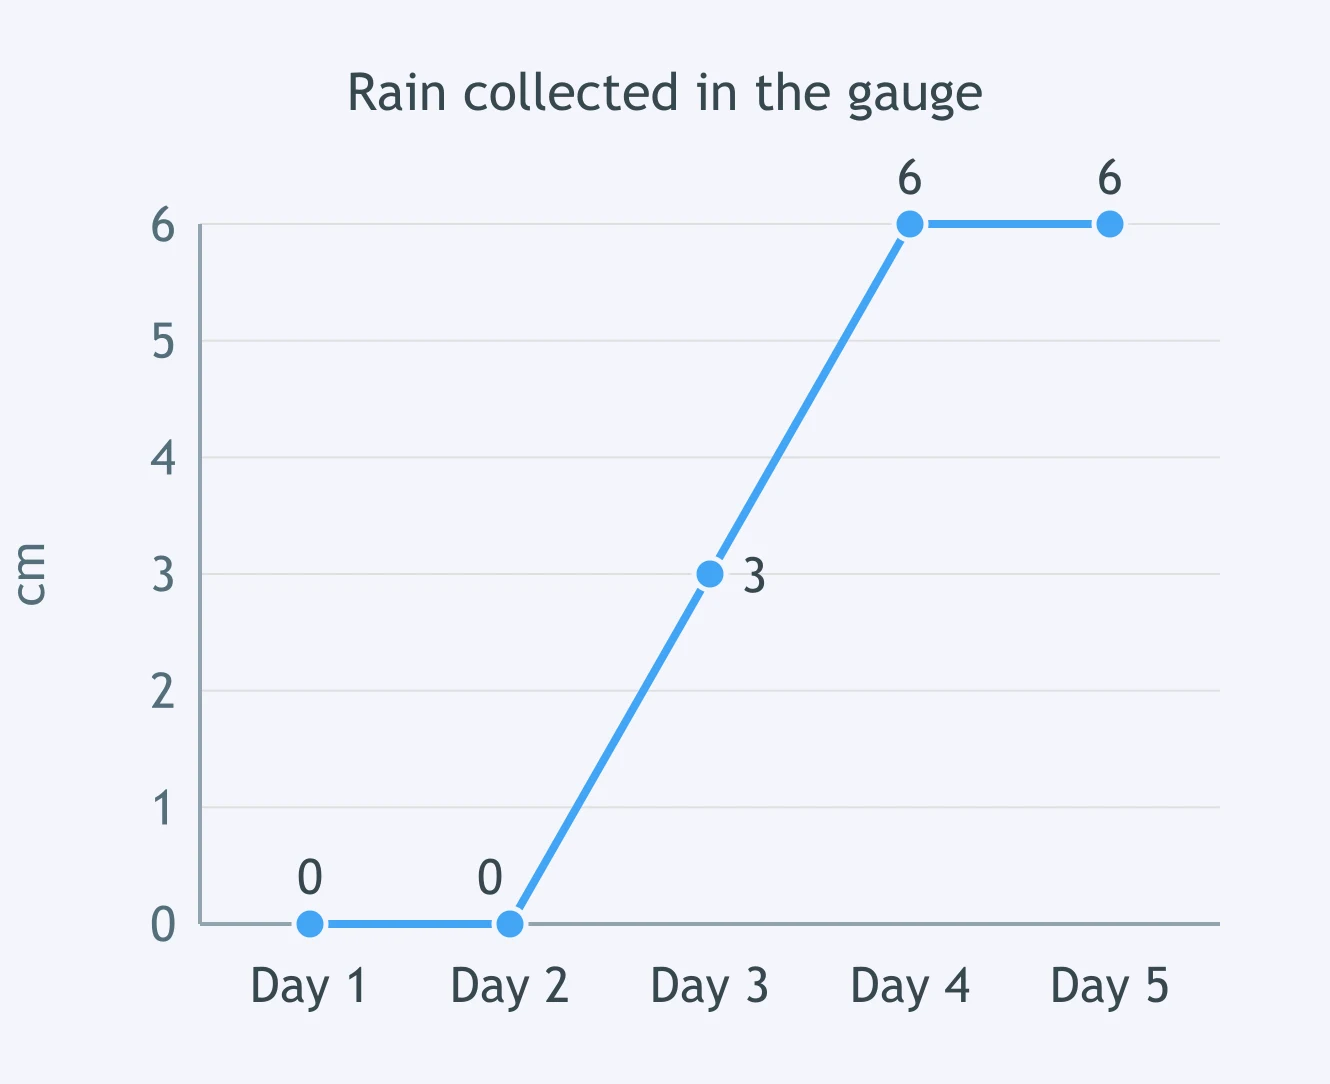
Look at the graph. Between day 1 and day 3, the amount of rain in the gauge ___.
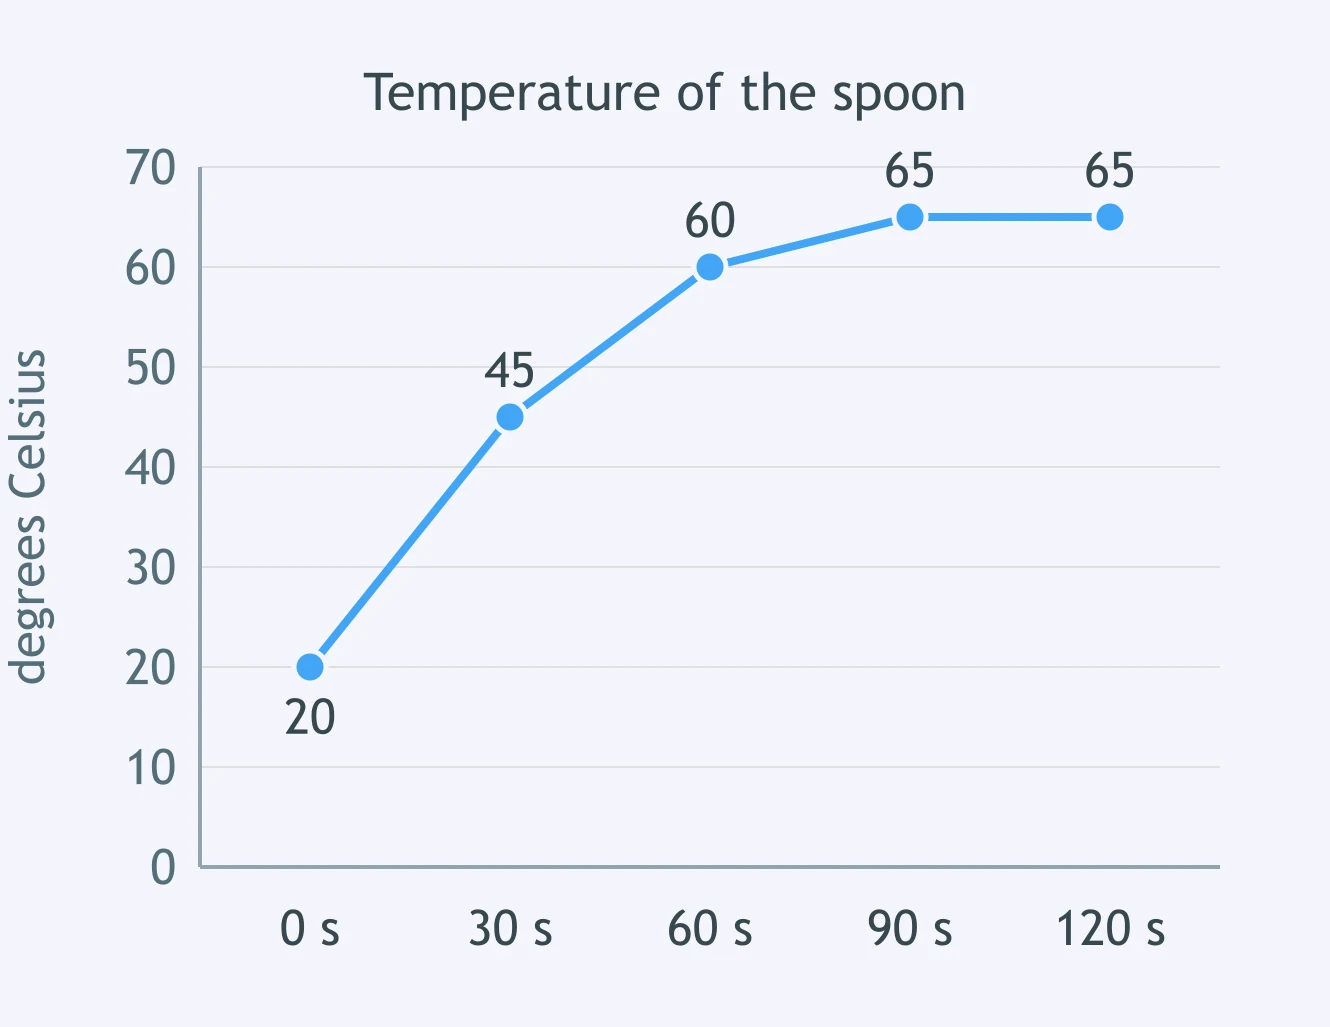
Look at the graph. Between 0 seconds and 60 seconds, the temperature of the metal spoon ___.
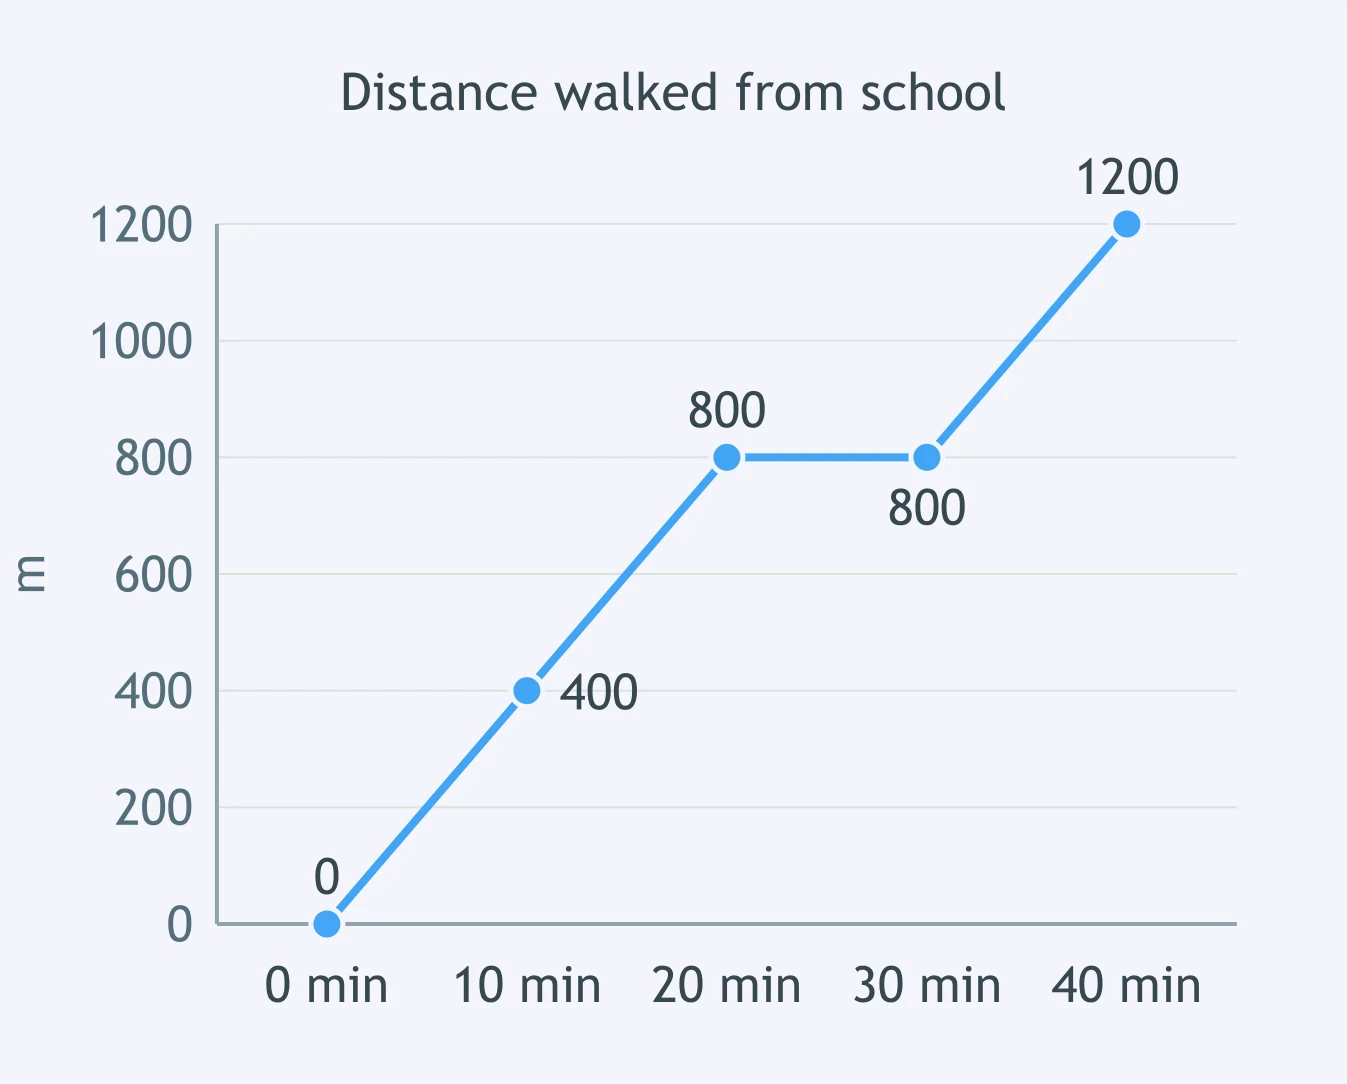
Look at the graph. Between minute 20 and minute 30, the distance of the class from the school ___.
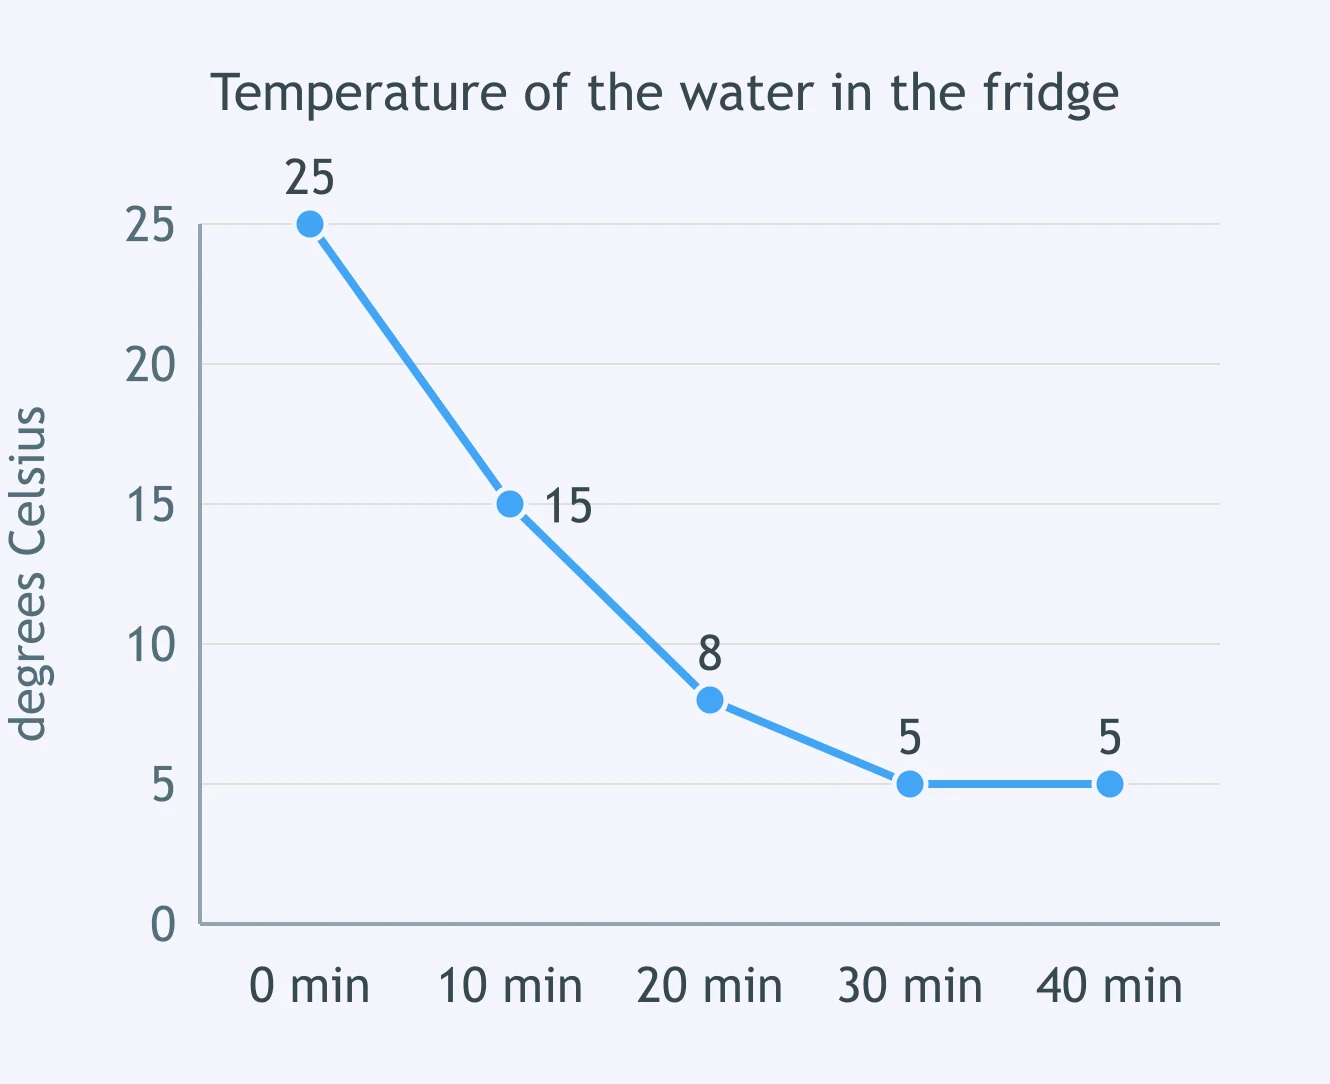
Look at the graph. Between minute 0 and minute 20, the temperature of the water in the fridge ___.
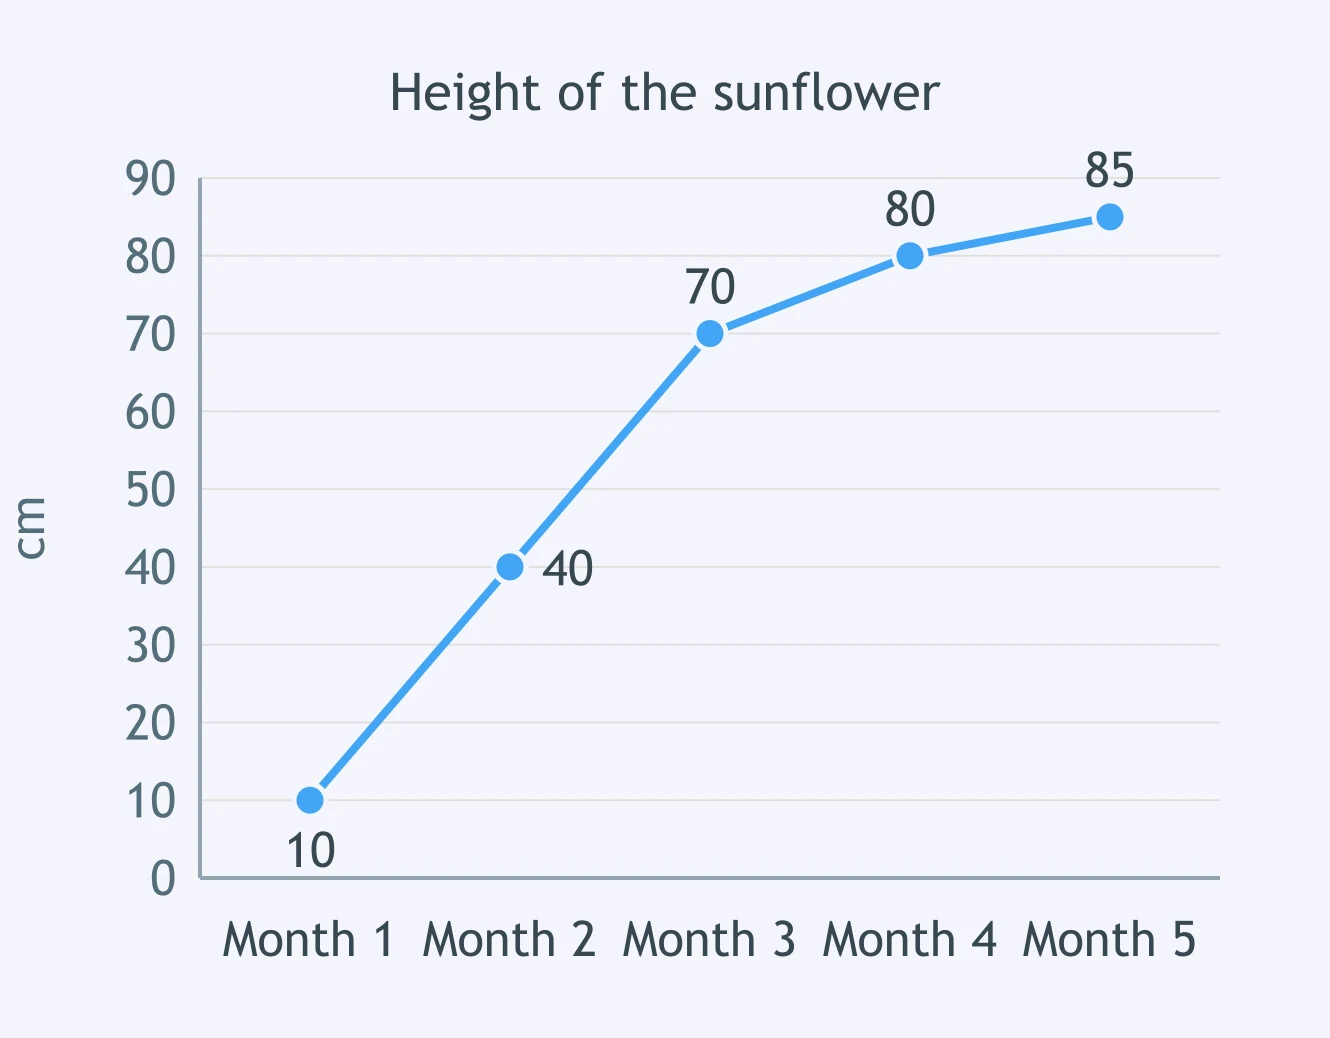
Look at the graph. Between month 3 and month 5, the height of the sunflower ___.
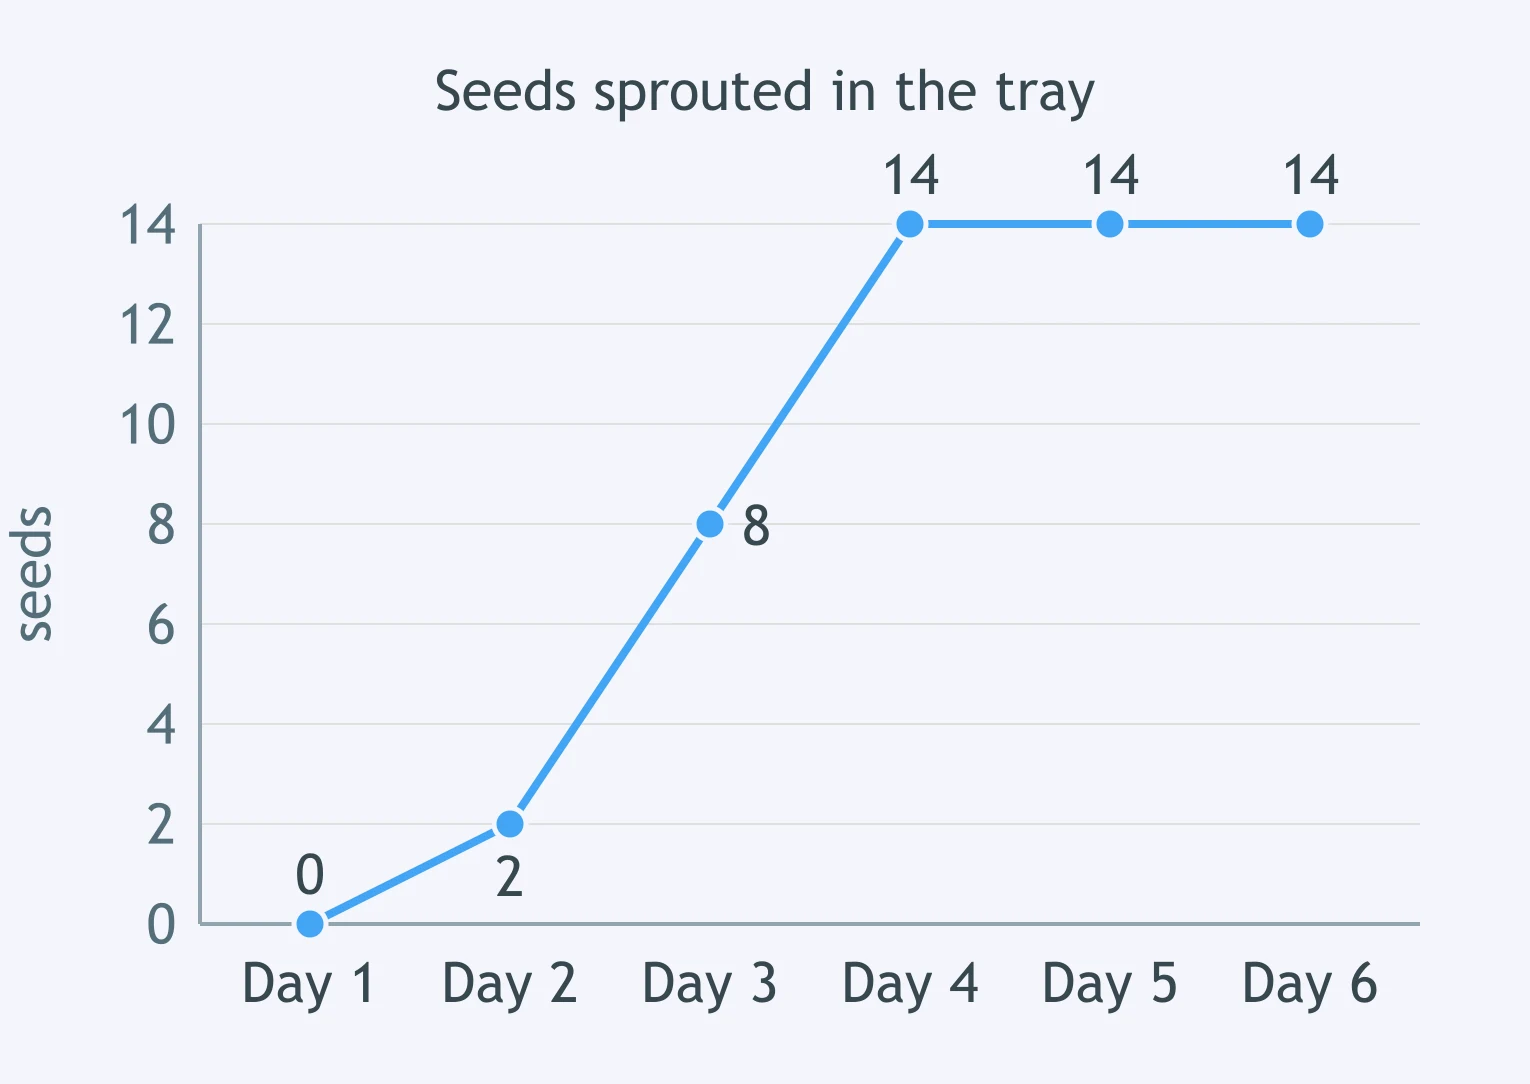
Look at the graph. Between day 4 and day 6, the number of seeds sprouted in the tray ___.
Crack the passcode before the zombies get in.
Answer, then swat bugs for bonus points.
Race through questions at your own speed.
Same question on every screen. Fastest wins.

Pick a tile, answer, hit bonuses and steals.

Asking a Question and Making a Prediction
40 questions