Loading
by BlastRoom
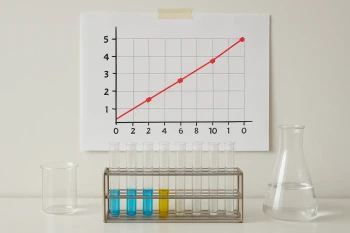
Judge which straight line best fits the points on a scatter plot.
#us_grade_8_math
40 questions
One question set, multiple game modes. Tap any game to see it in action. Not sure which to pick?
Answer to place stones and capture territory.
Outrun the snow together.
Earn blasts, then hunt the other team.
Answer to earn energy, then climb.

The class blasts through walls together.
Bid on mystery lots. Most money wins.
Sell tours. Nice, standard, or a total scam.

Answer, restock, and serve the rush.
More correct answers pulls the rope your way.
Answer, then shoot down the alien wave.
Answer, then tap to leap the frozen ridge.
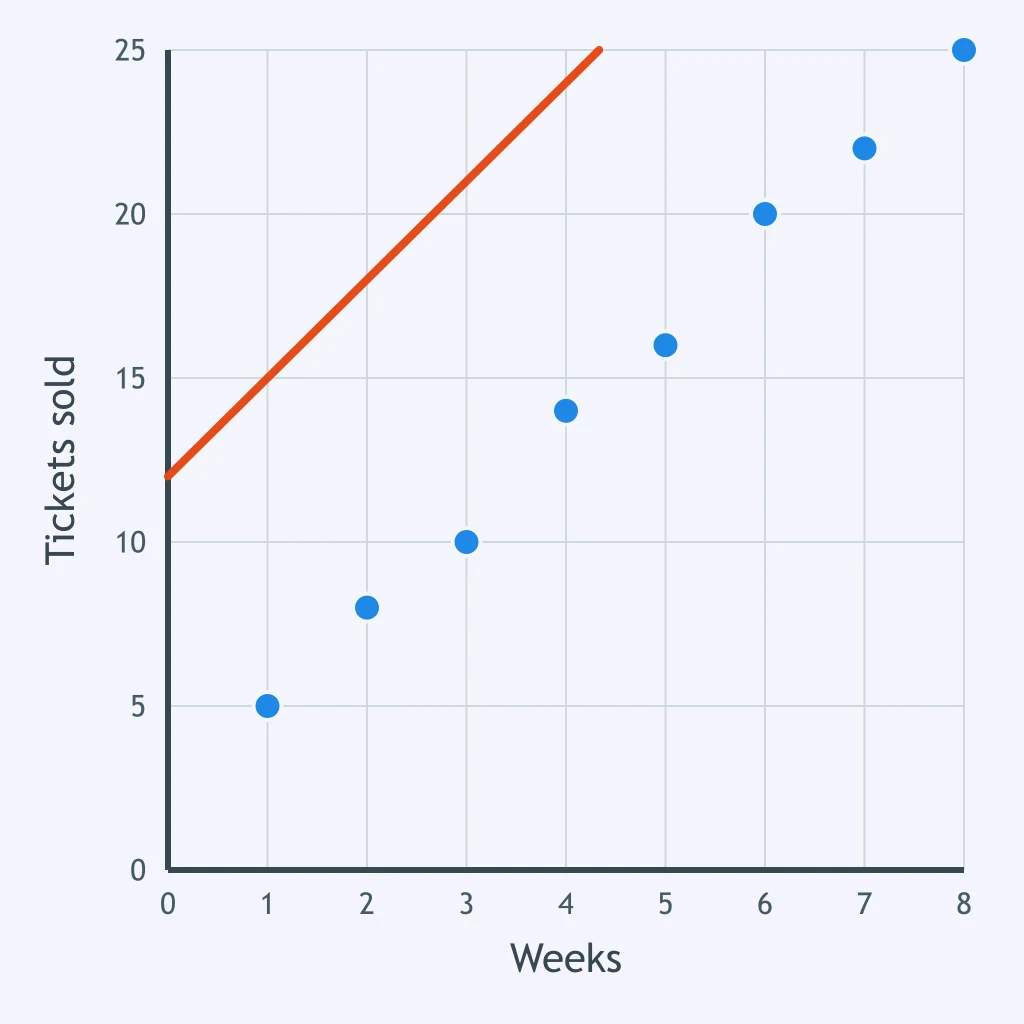
Does the line drawn on this ticket-sales plot fit the plotted points well?
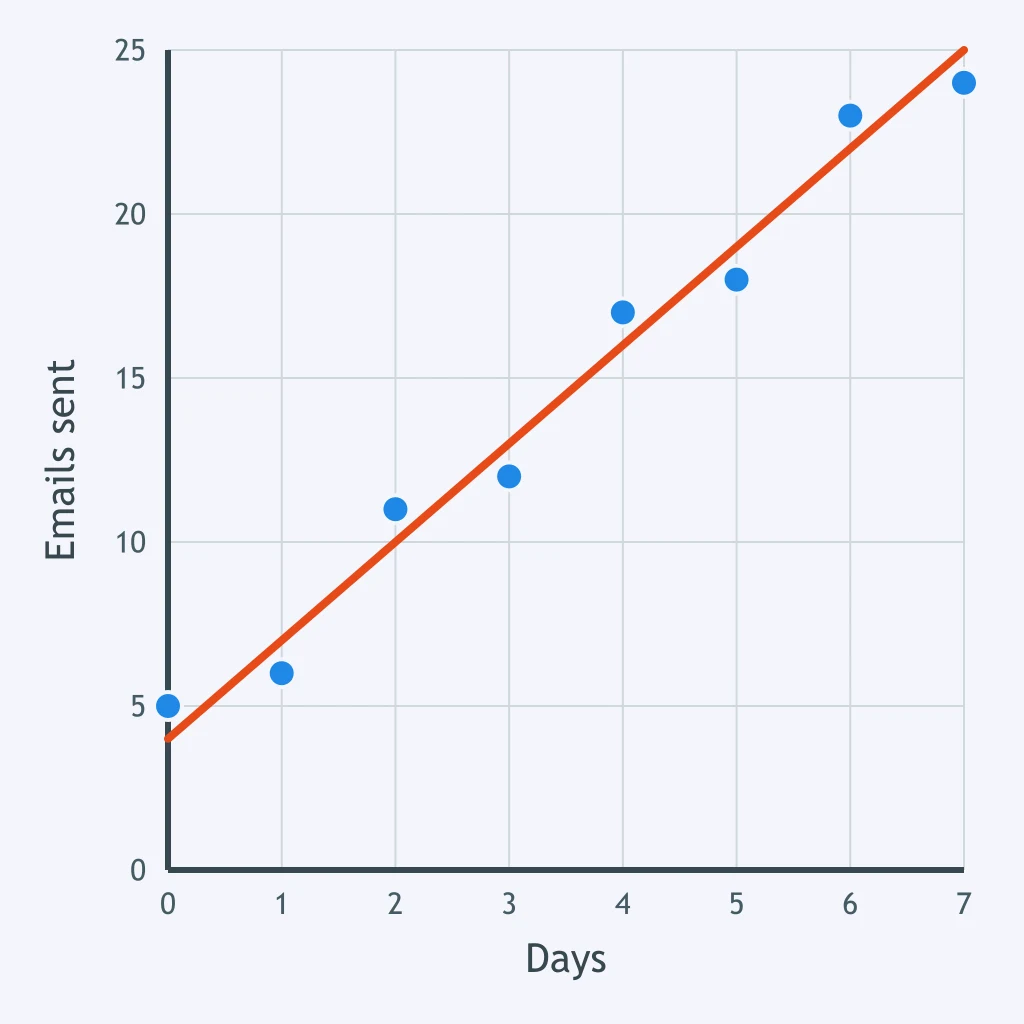
A student drew this line as a line of best fit for the email data. Is it a good fit, and why?
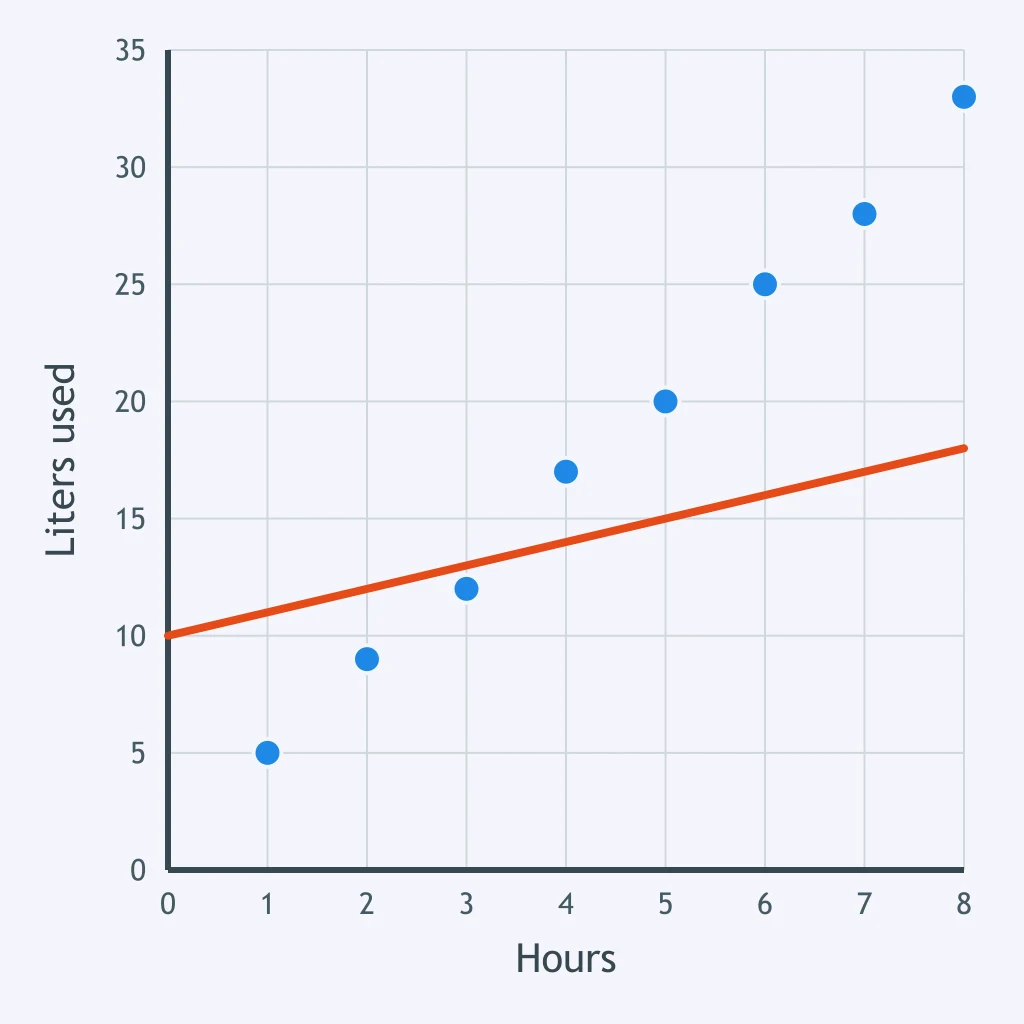
Judge the line drawn on this fuel plot. How well does it fit the plotted points?
Is the line drawn a reasonable trend line for the club membership points?
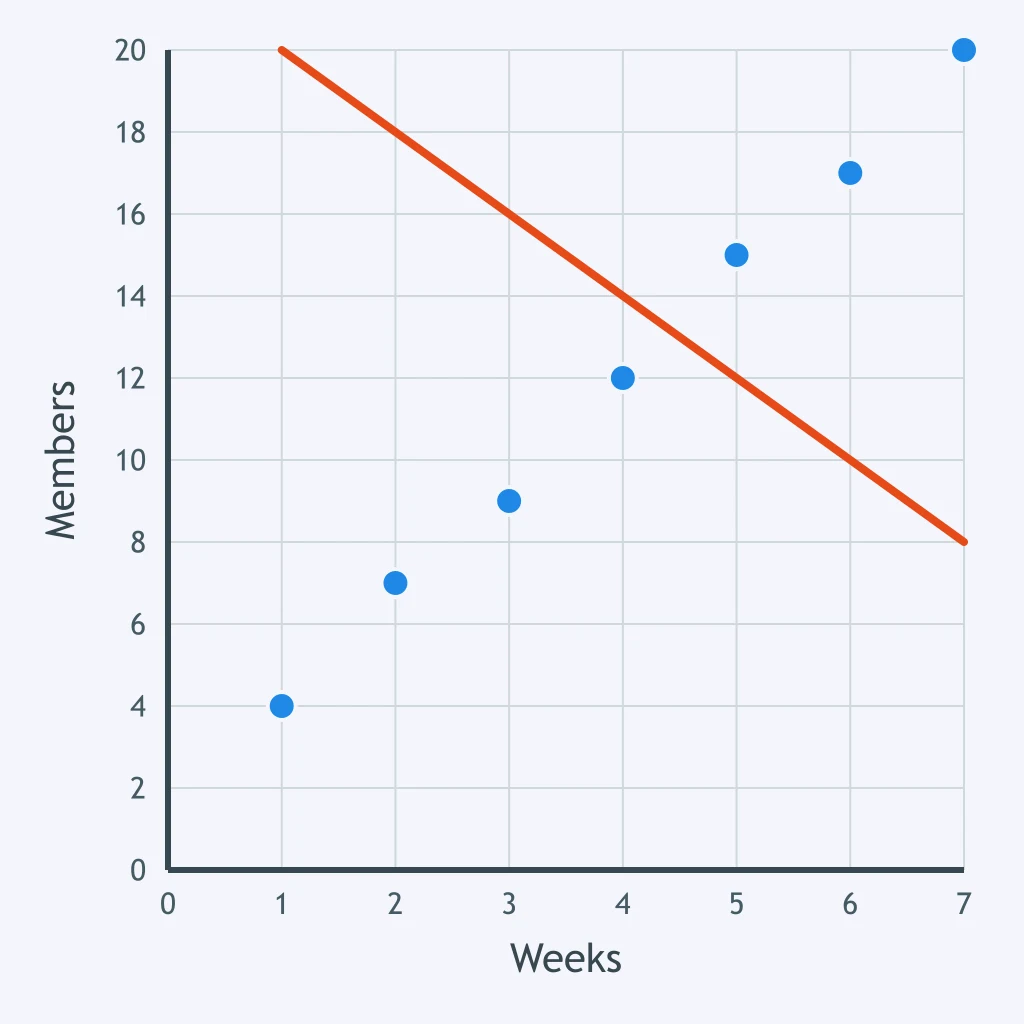
How well does the line drawn match the pattern of the plotted cookie points?
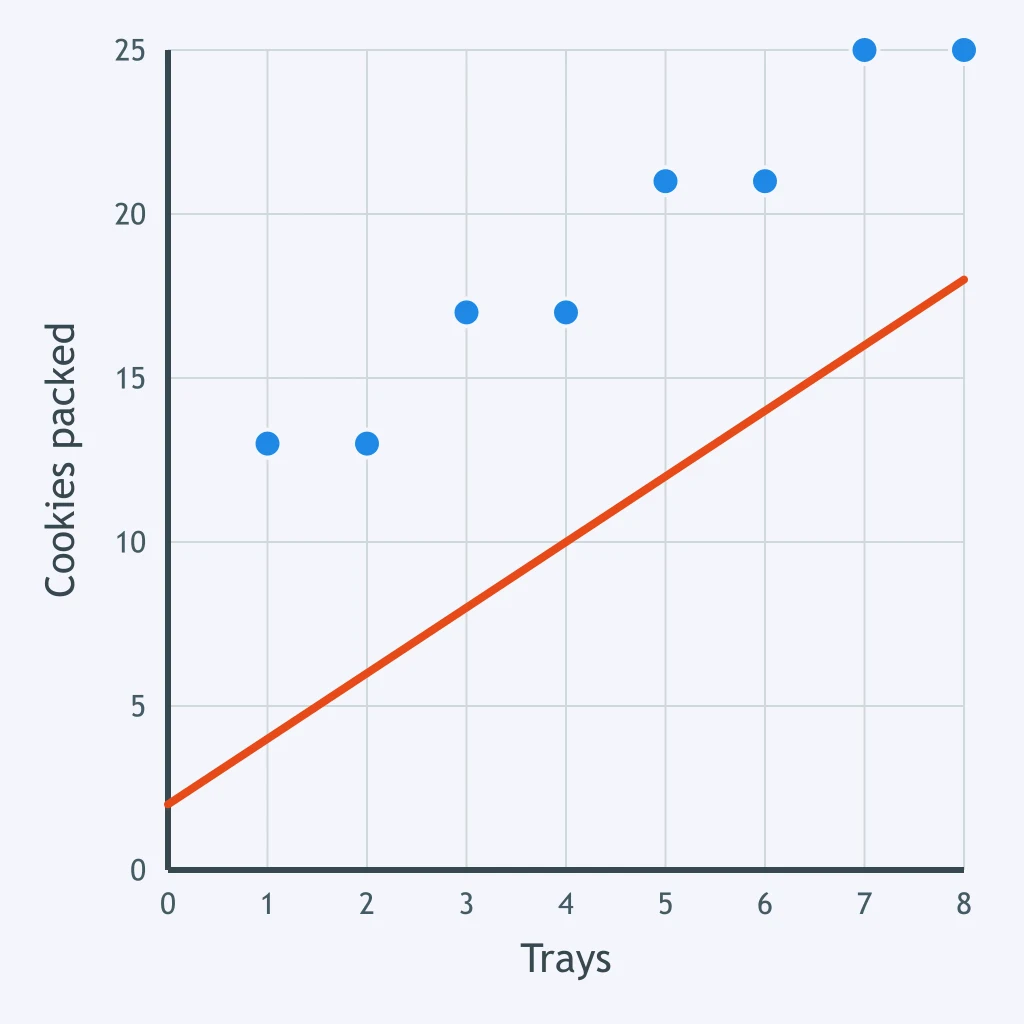
Does the line drawn belong to this cloud of reading points?
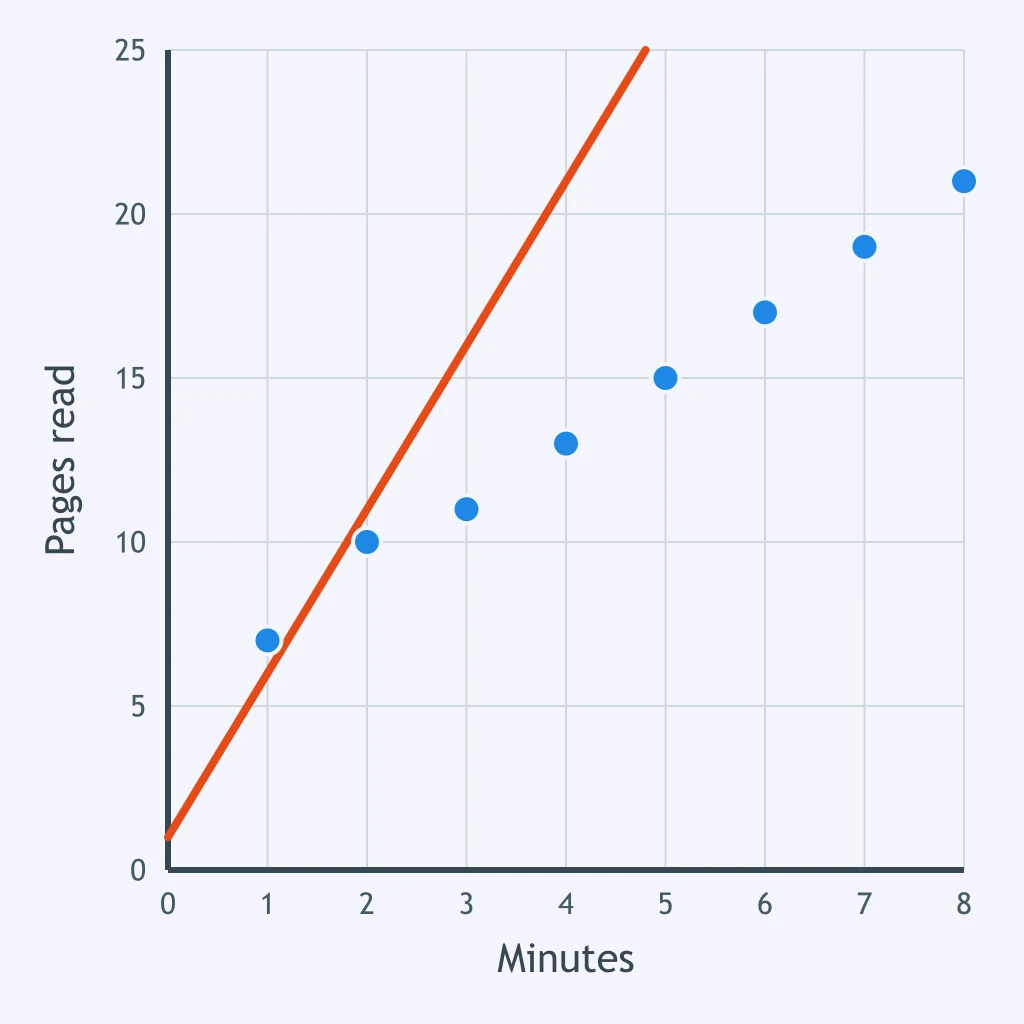
Is the line drawn a good line of best fit for these cans-left points?
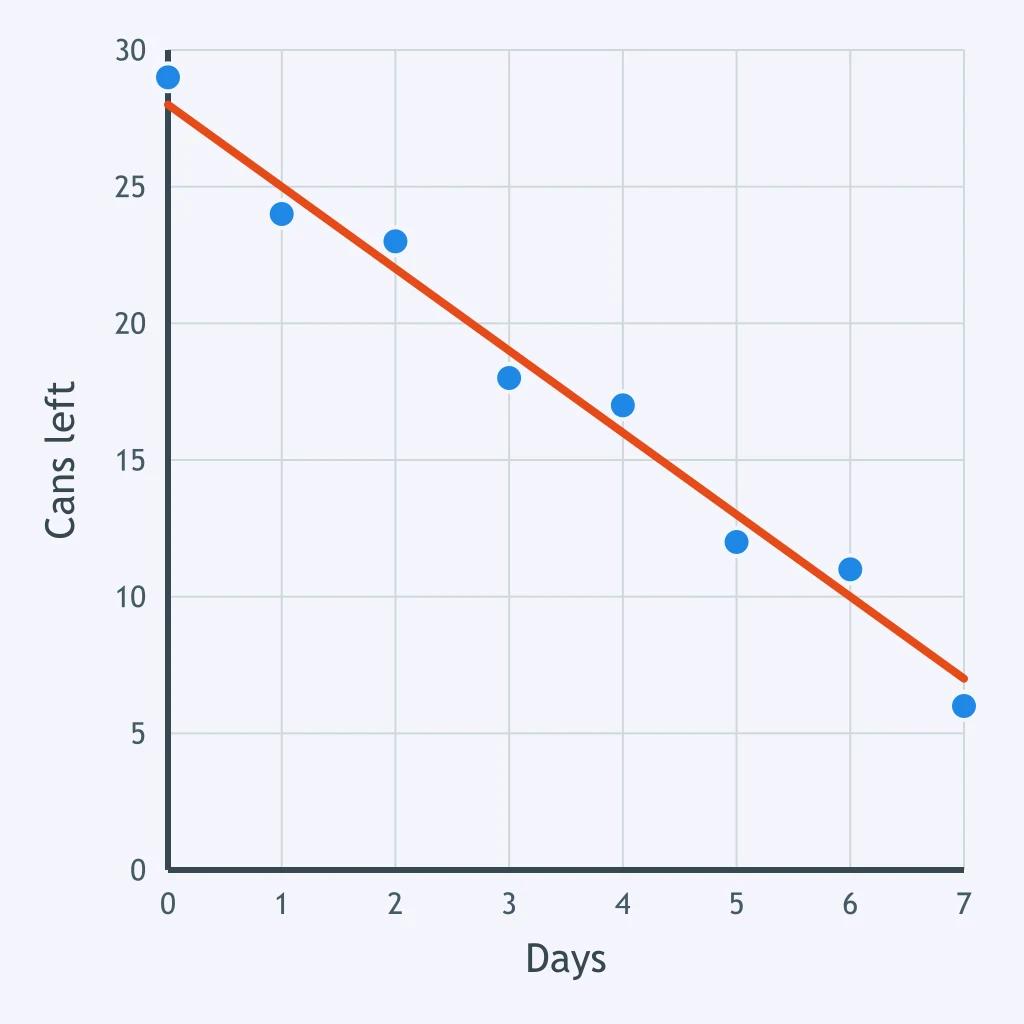
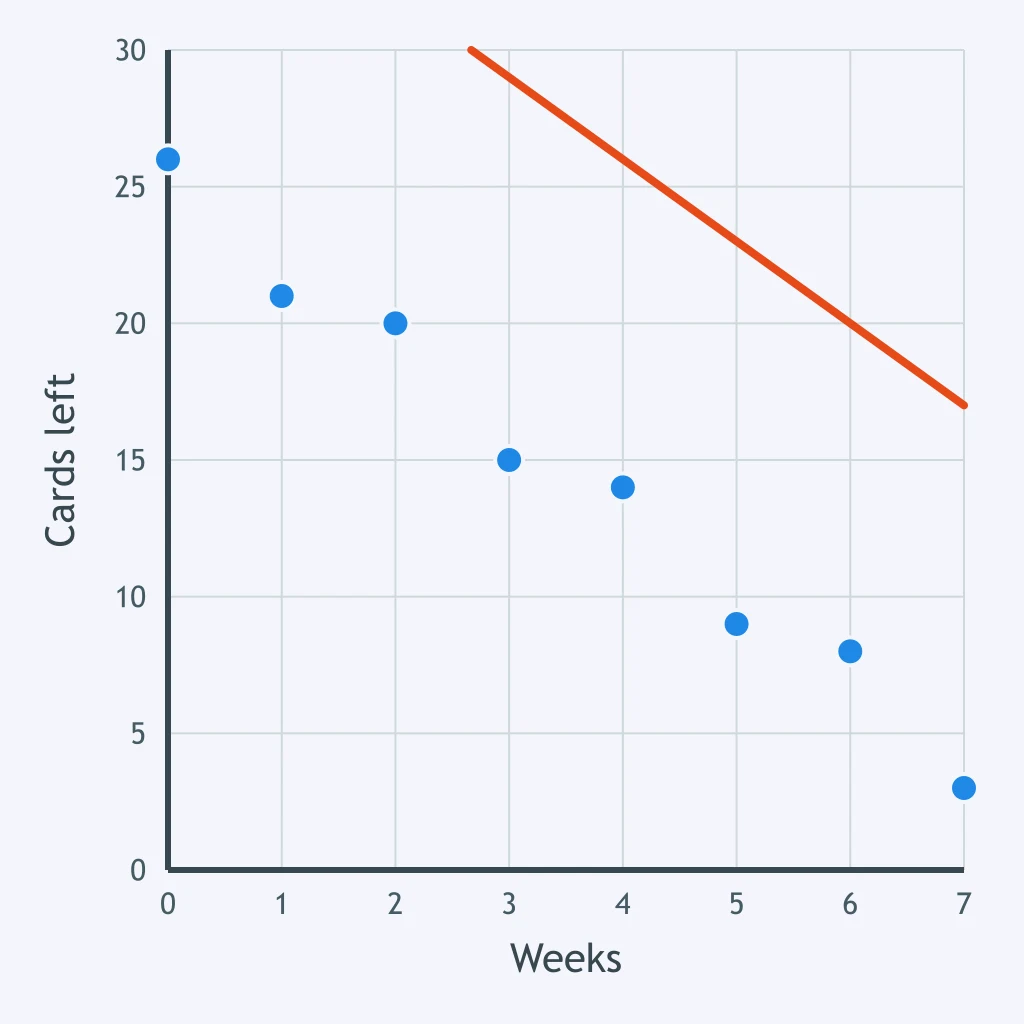
A student says the line drawn is the line of best fit for the cards data. Is that correct?
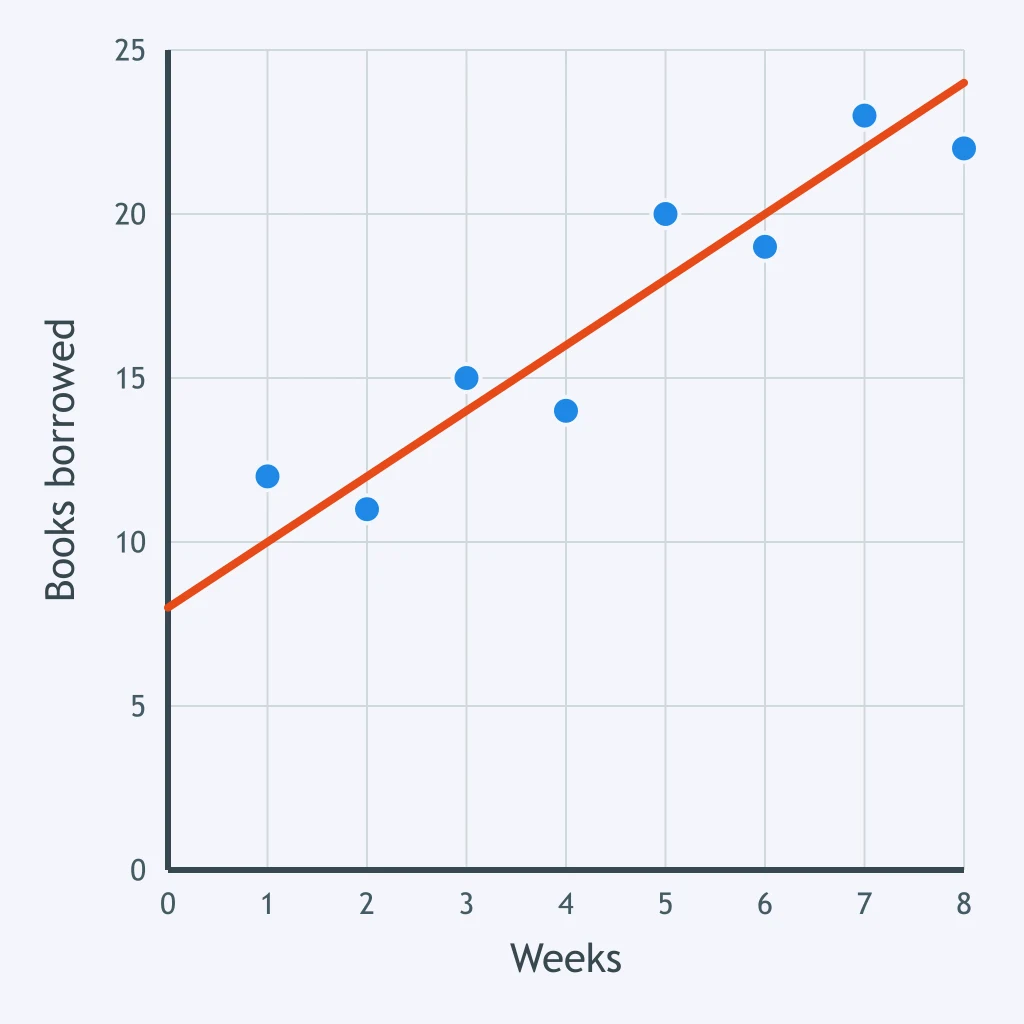
Decide whether the line drawn fits the borrowing points, and give the reason.
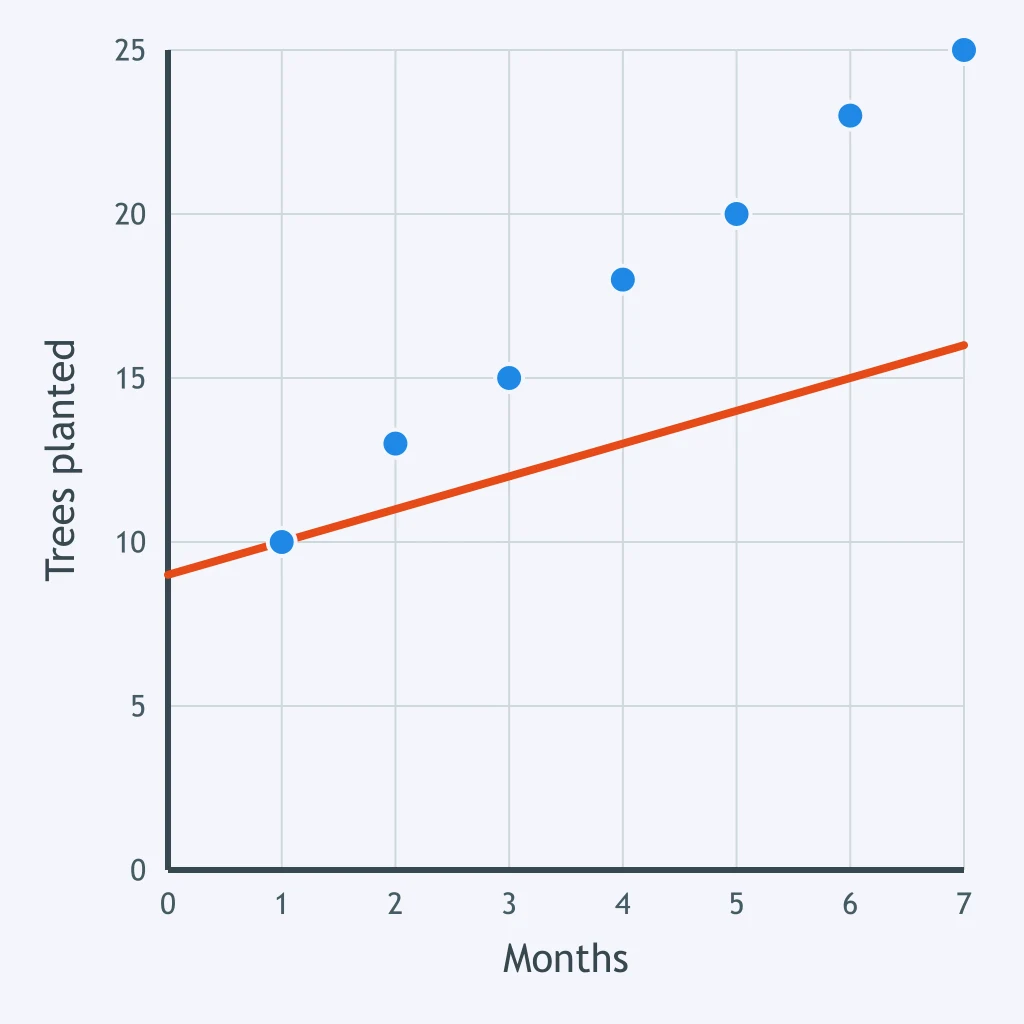
Does the line drawn on this tree-planting plot follow the points well?
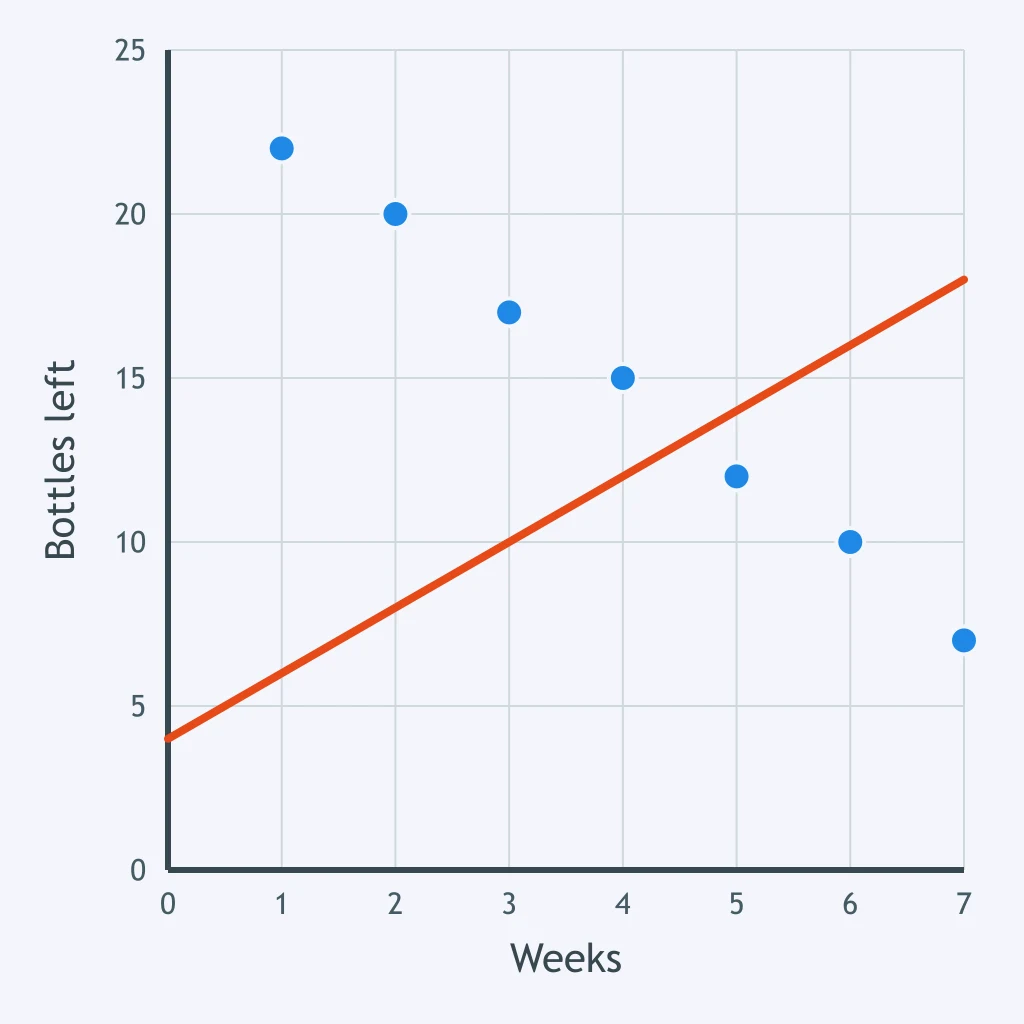
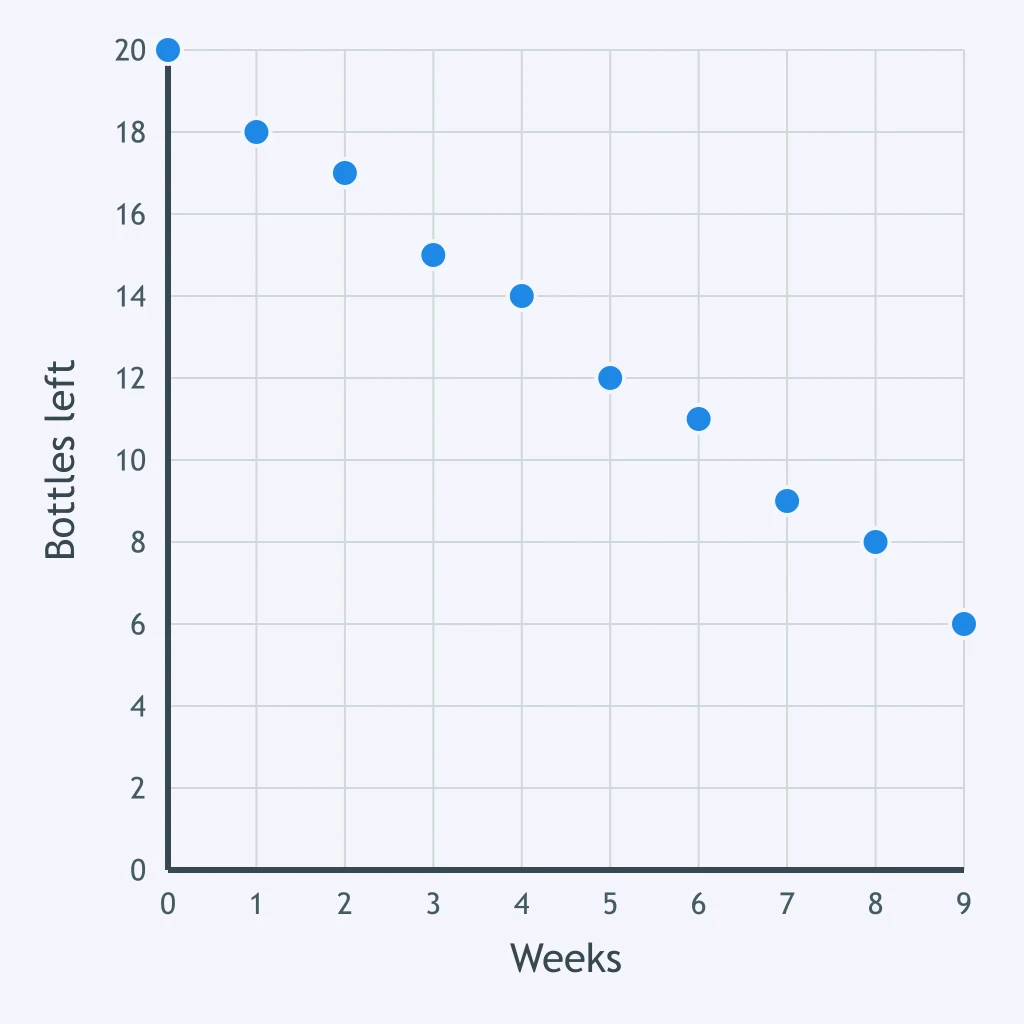
How well does the line drawn describe the trend in these bottles-left points?
Is the line drawn placed correctly for these scoring points?
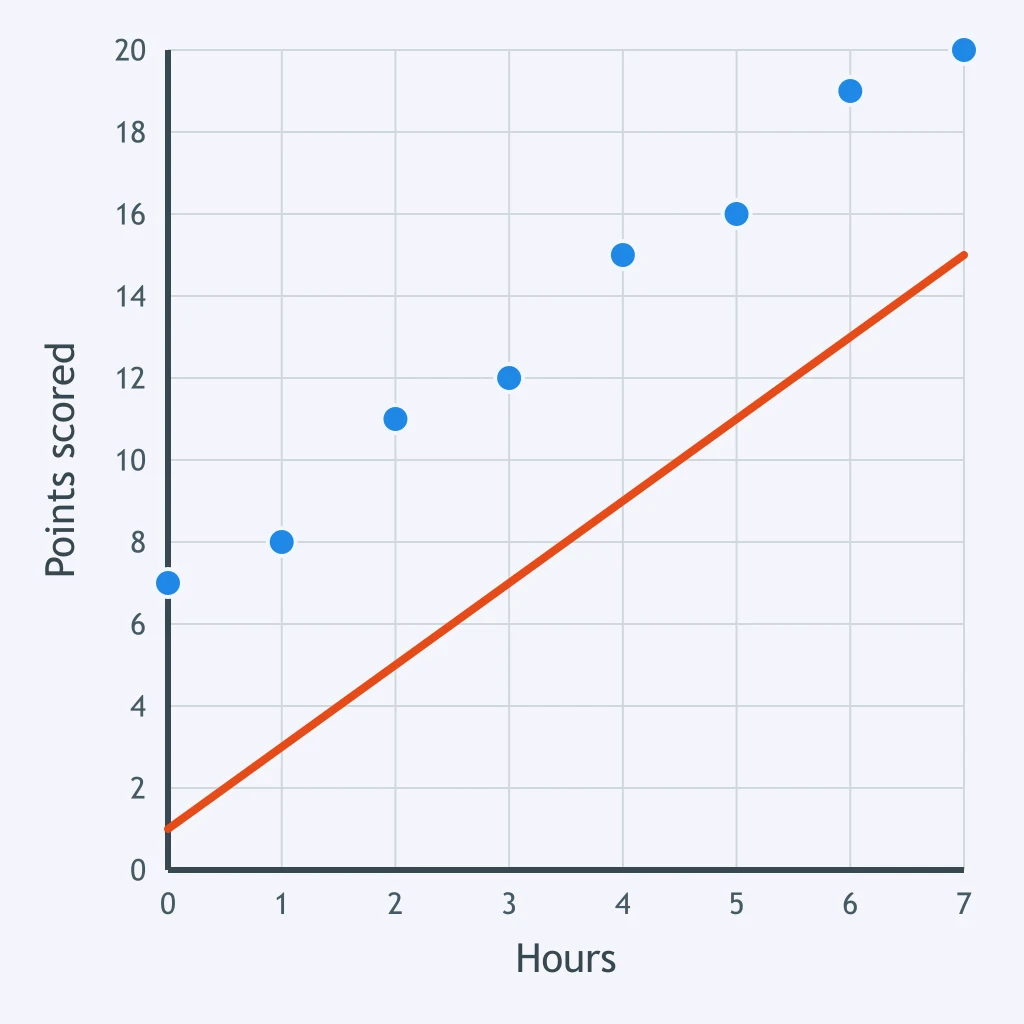
The line drawn does not fit the packing points. What would have to change?
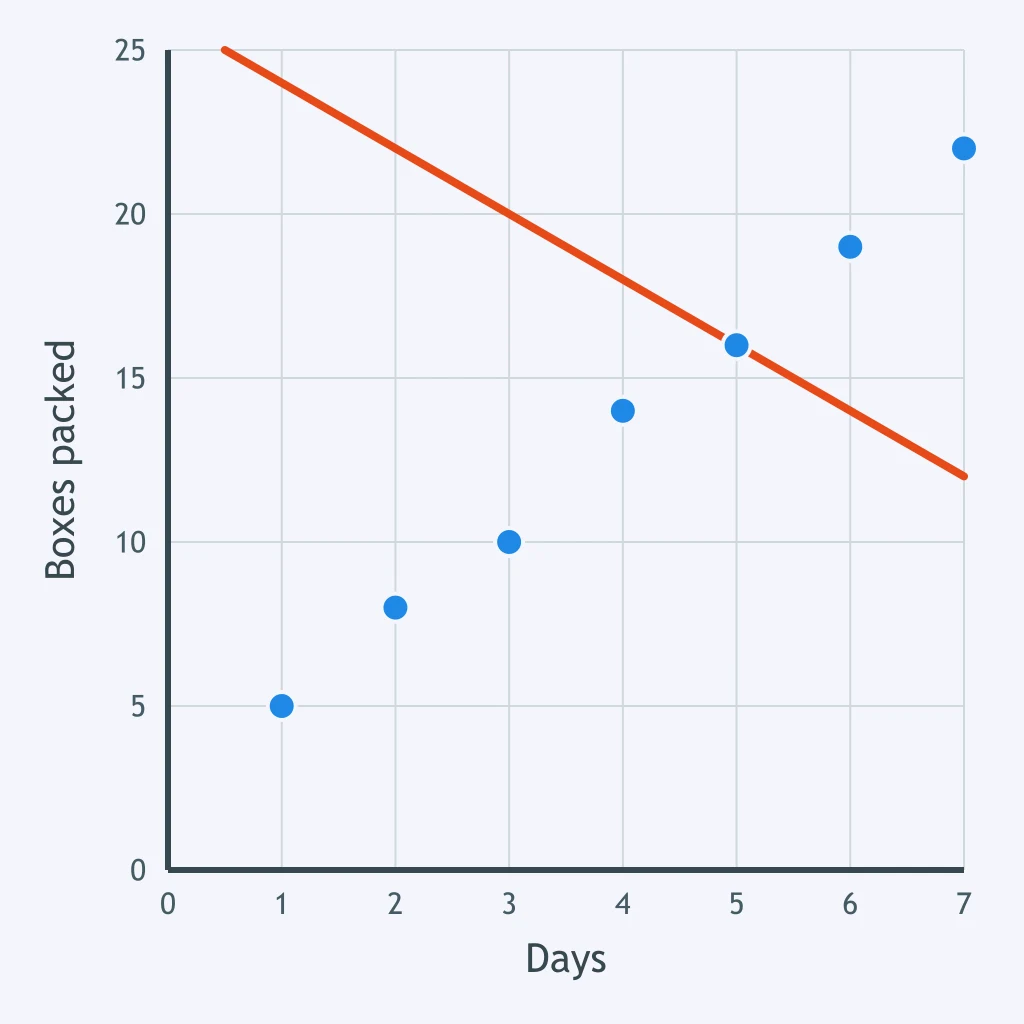
This line misses the plotted upload points. What single change would make it fit?
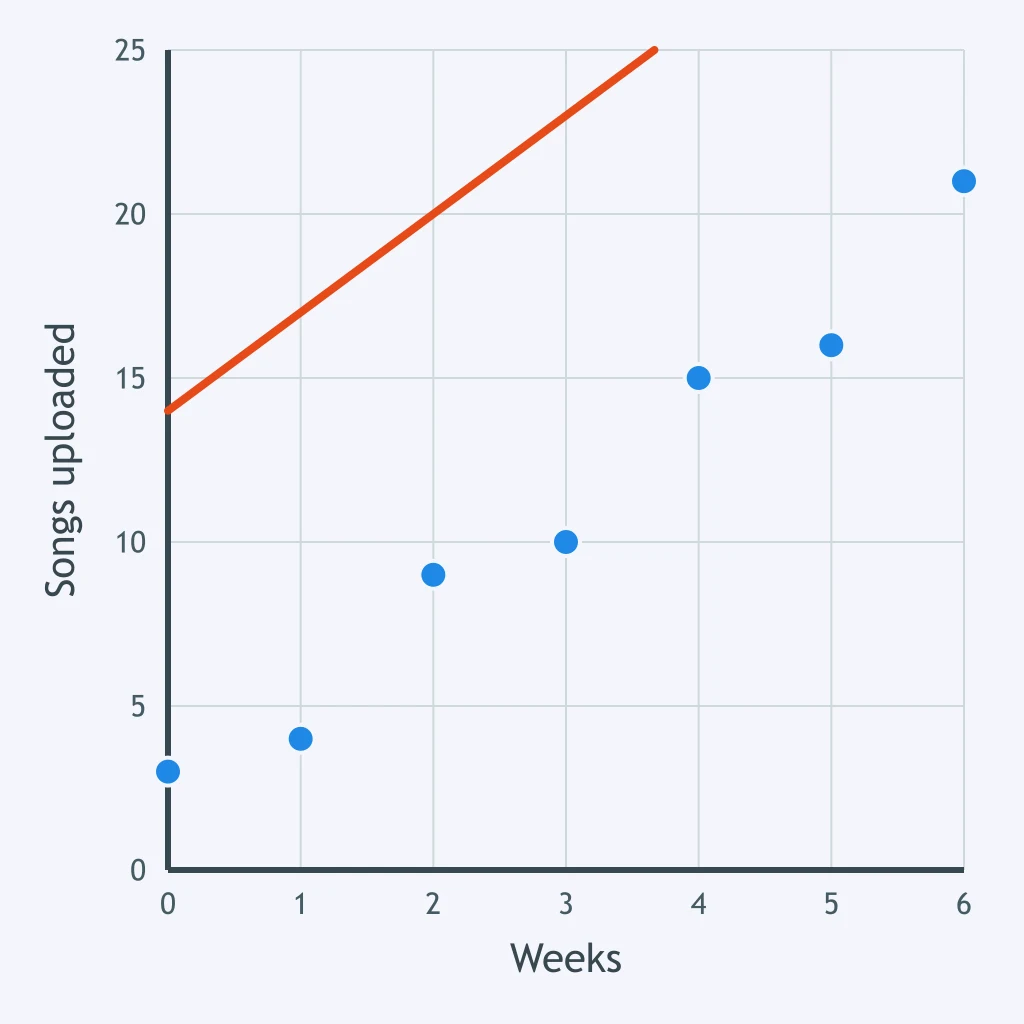
The cycling line is a poor fit. What has to change before it can be a trend line?
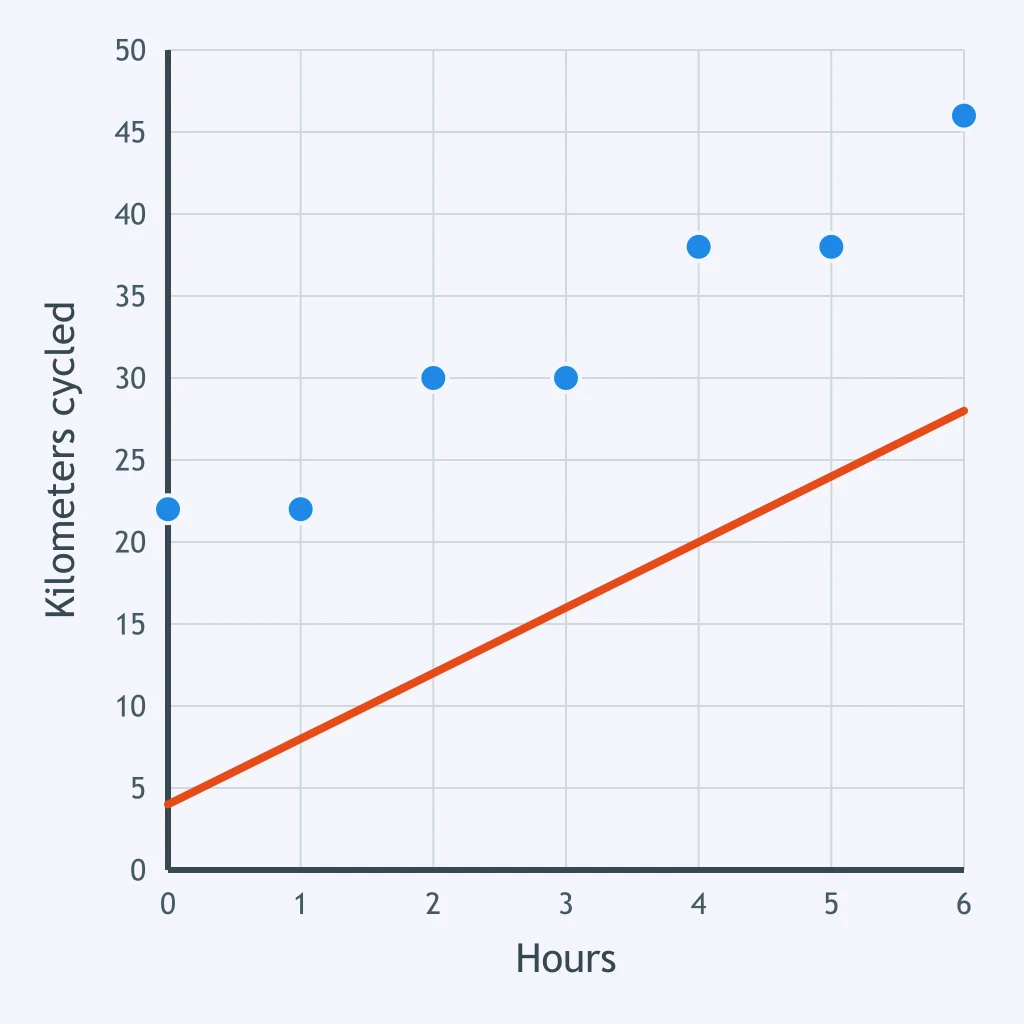
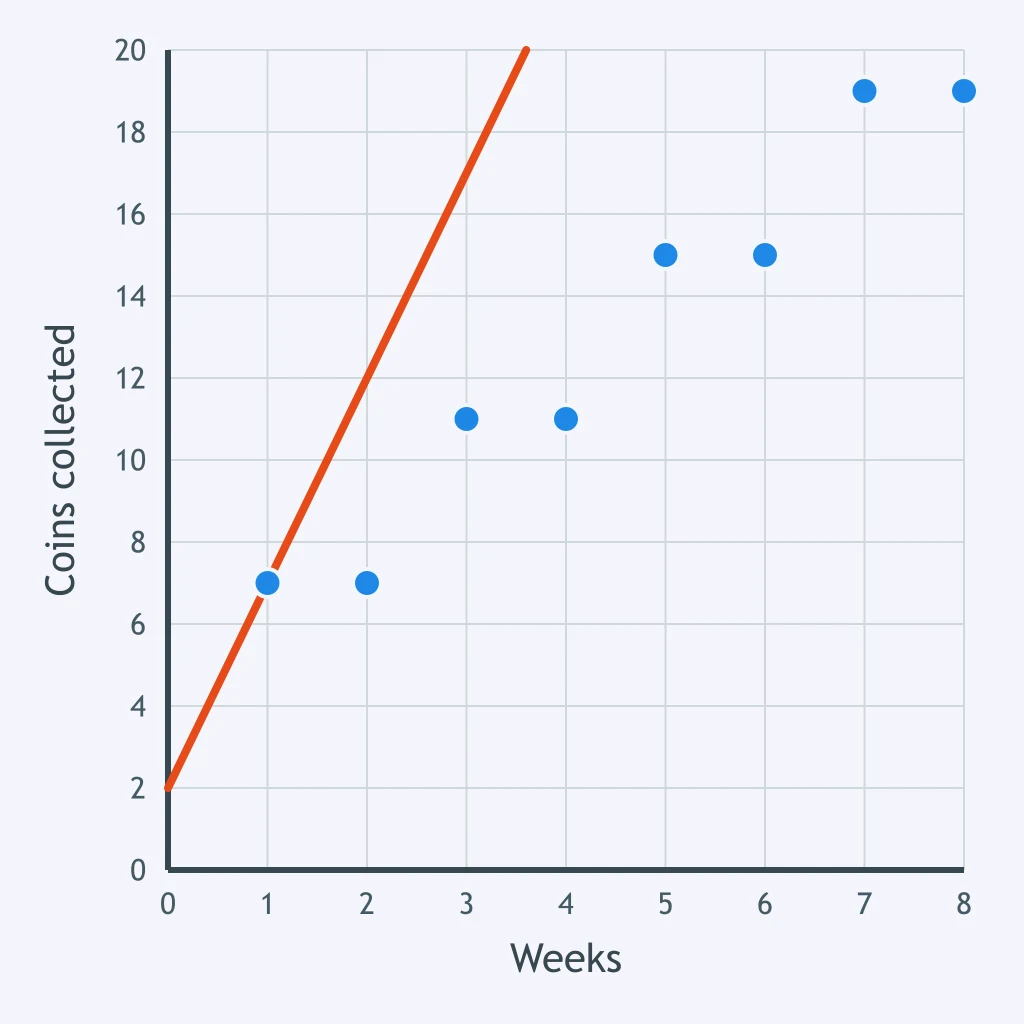
The line drawn leaves the coin points behind. What correction does it need?
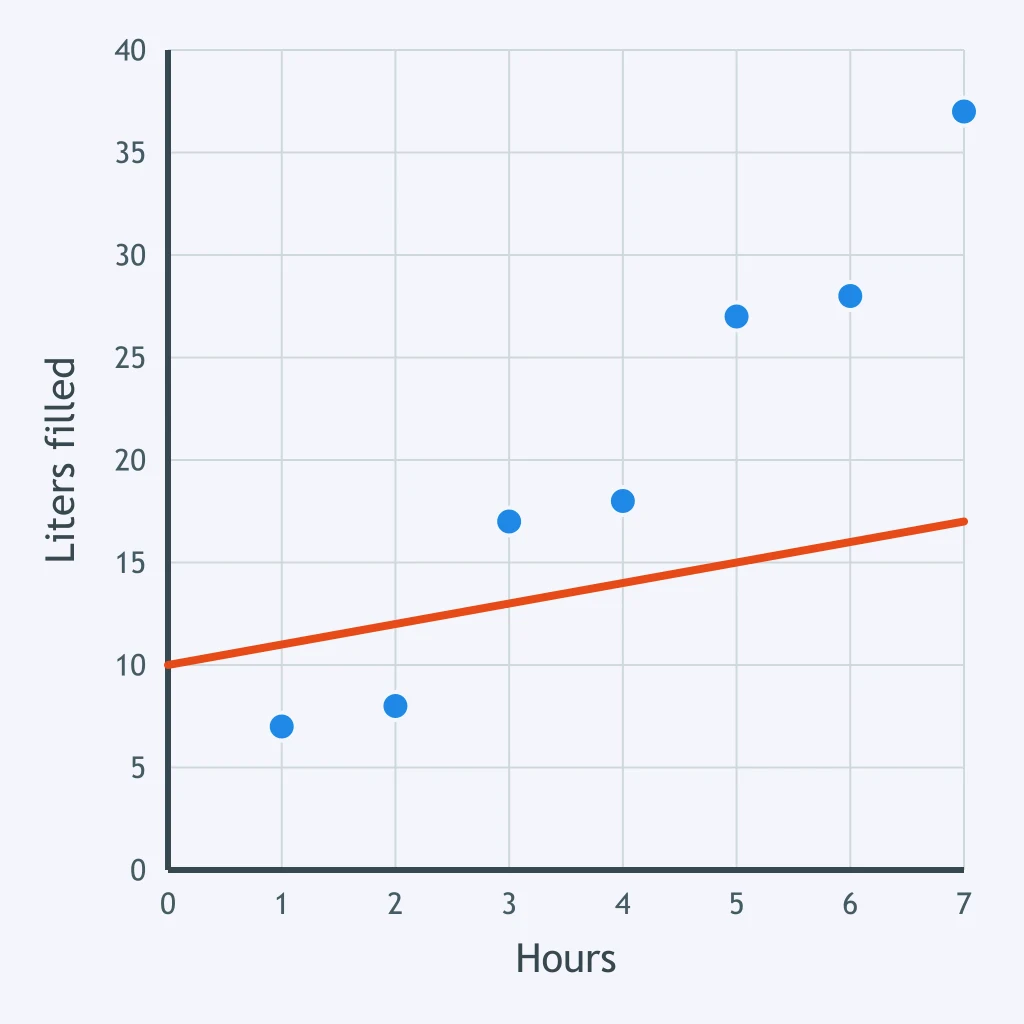
The line drawn is a poor fit for these filling points. What would fix it?
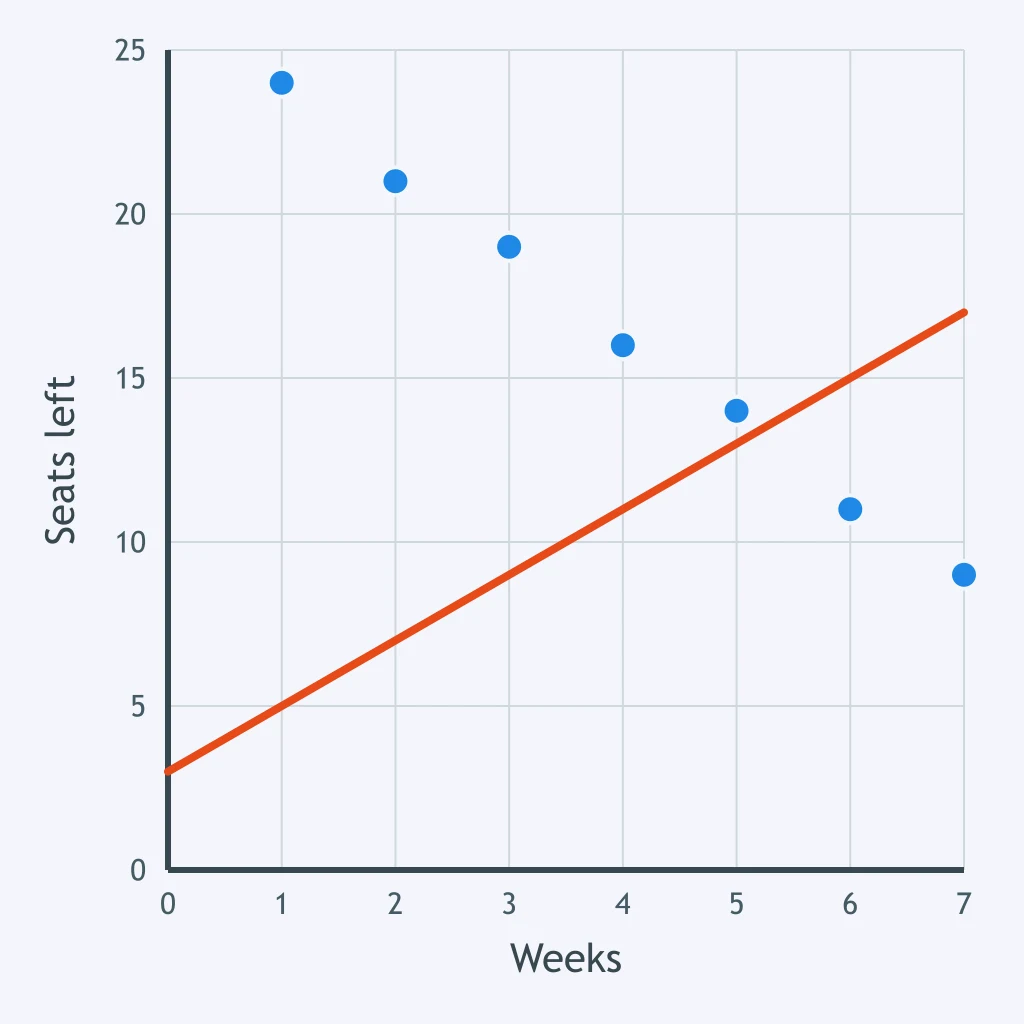
The line on this seats-left plot does not follow the data. What must change about it?
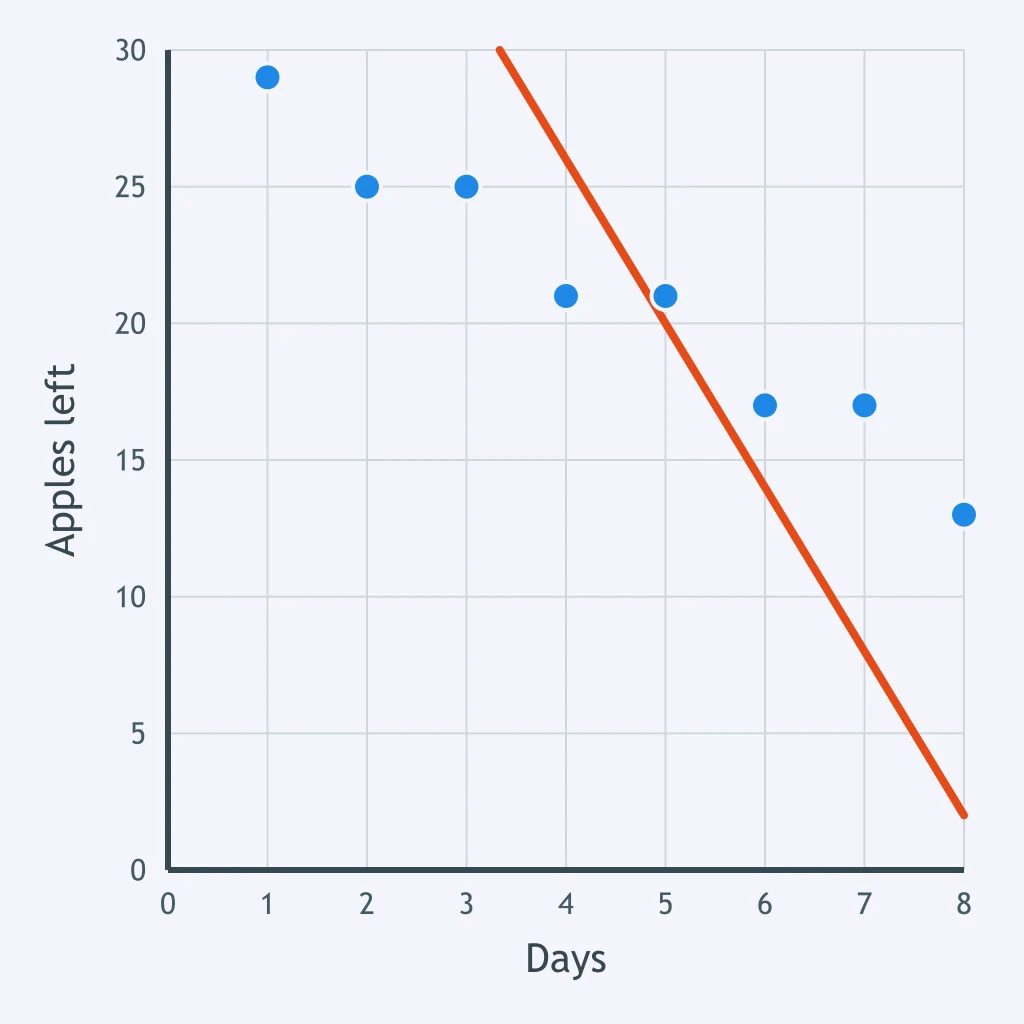
The line drawn falls, like the apple points, yet still fits badly. What has to change?
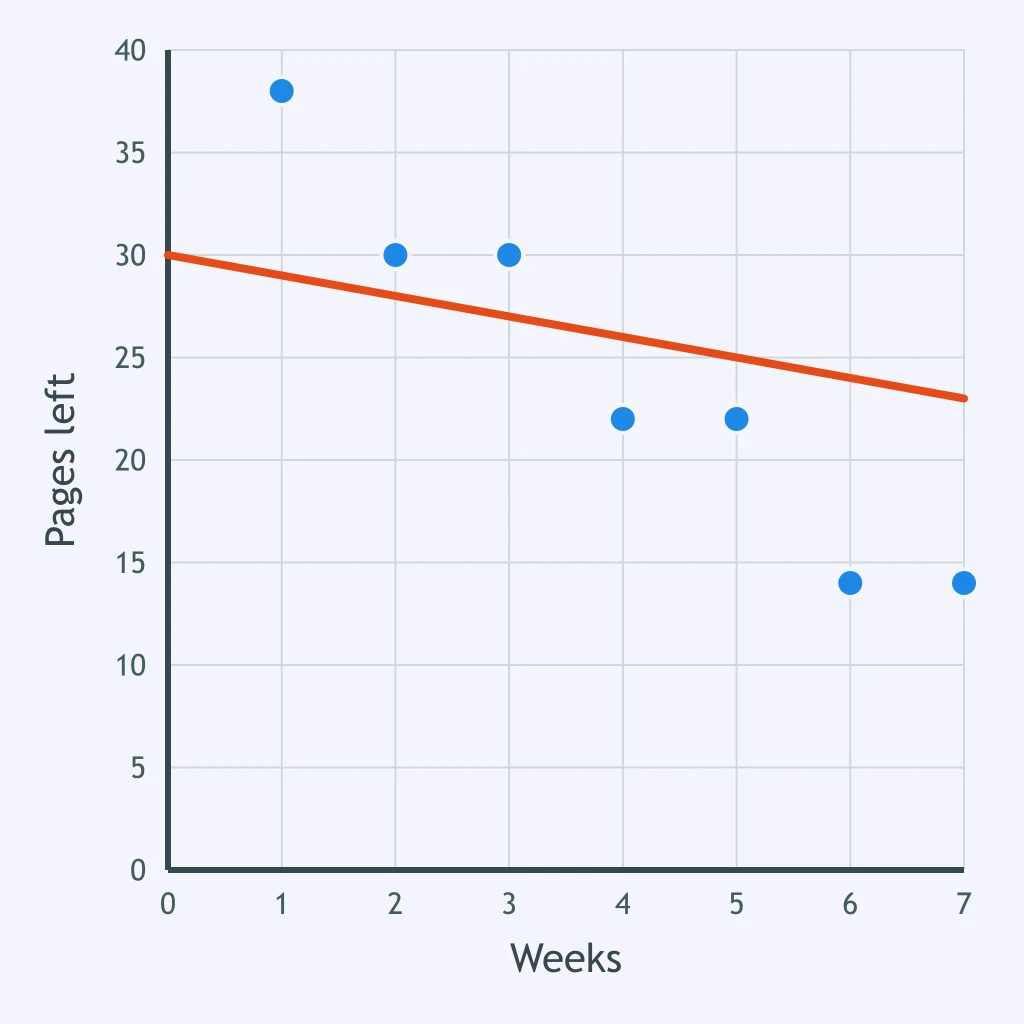
The line drawn does not fit the points showing the pages left each week. What would have to change for it to fit?
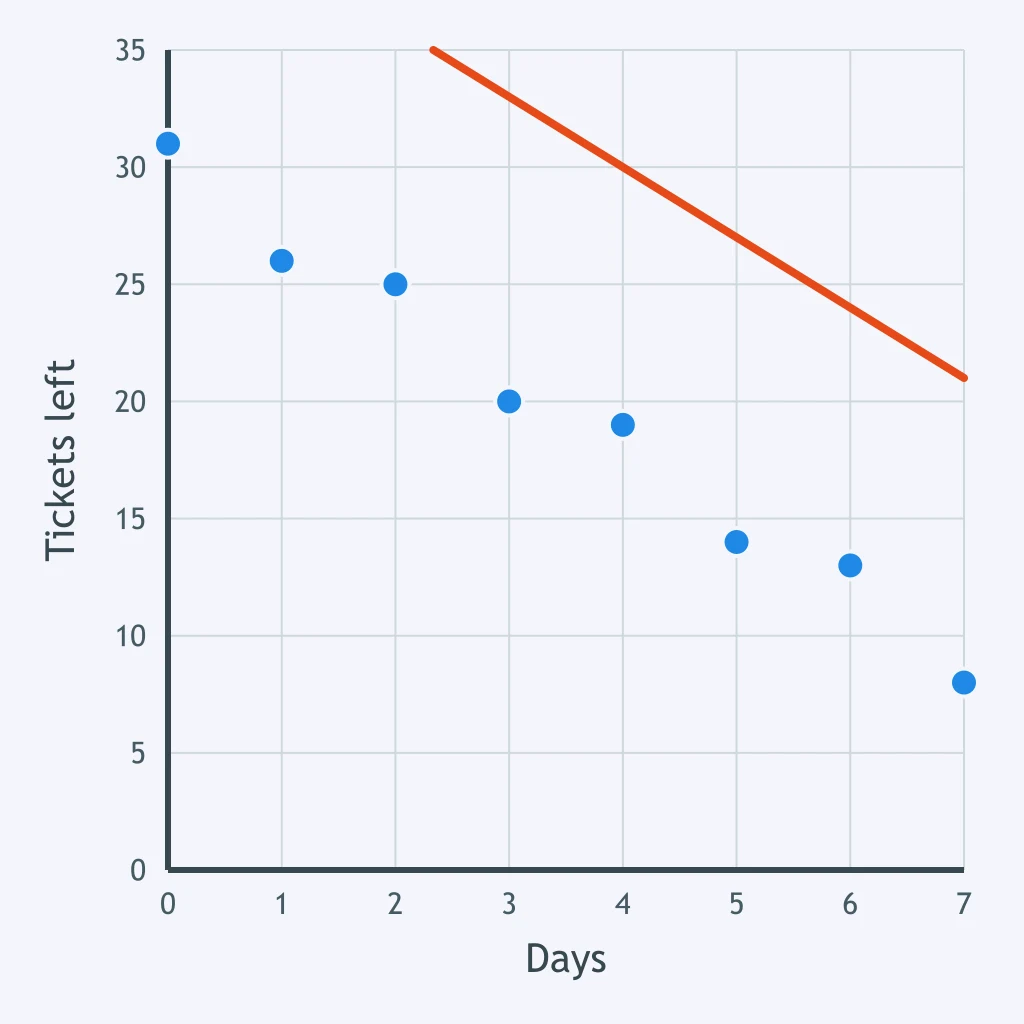
The line drawn slopes like these ticket points but still misses them. What change is needed?
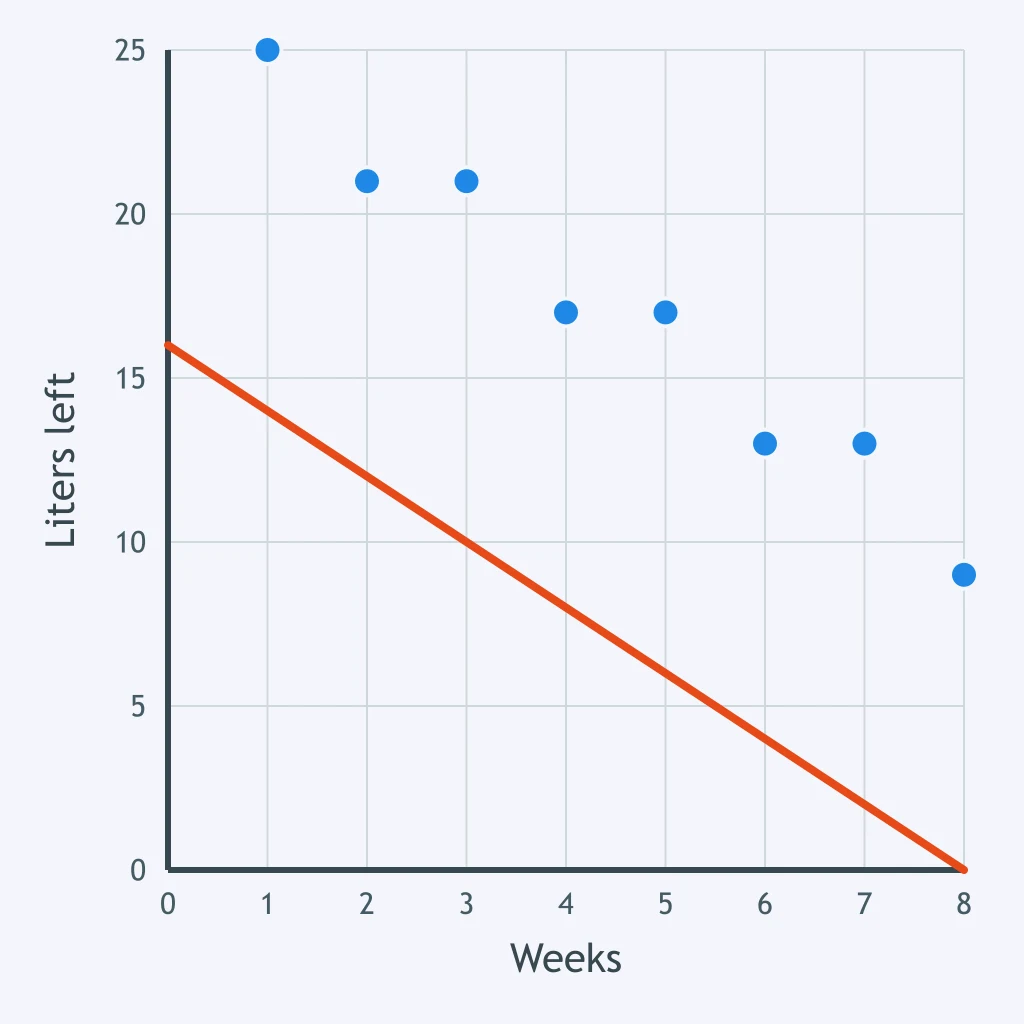
The line drawn matches the steepness of these liters-left points but not their position. What must change?
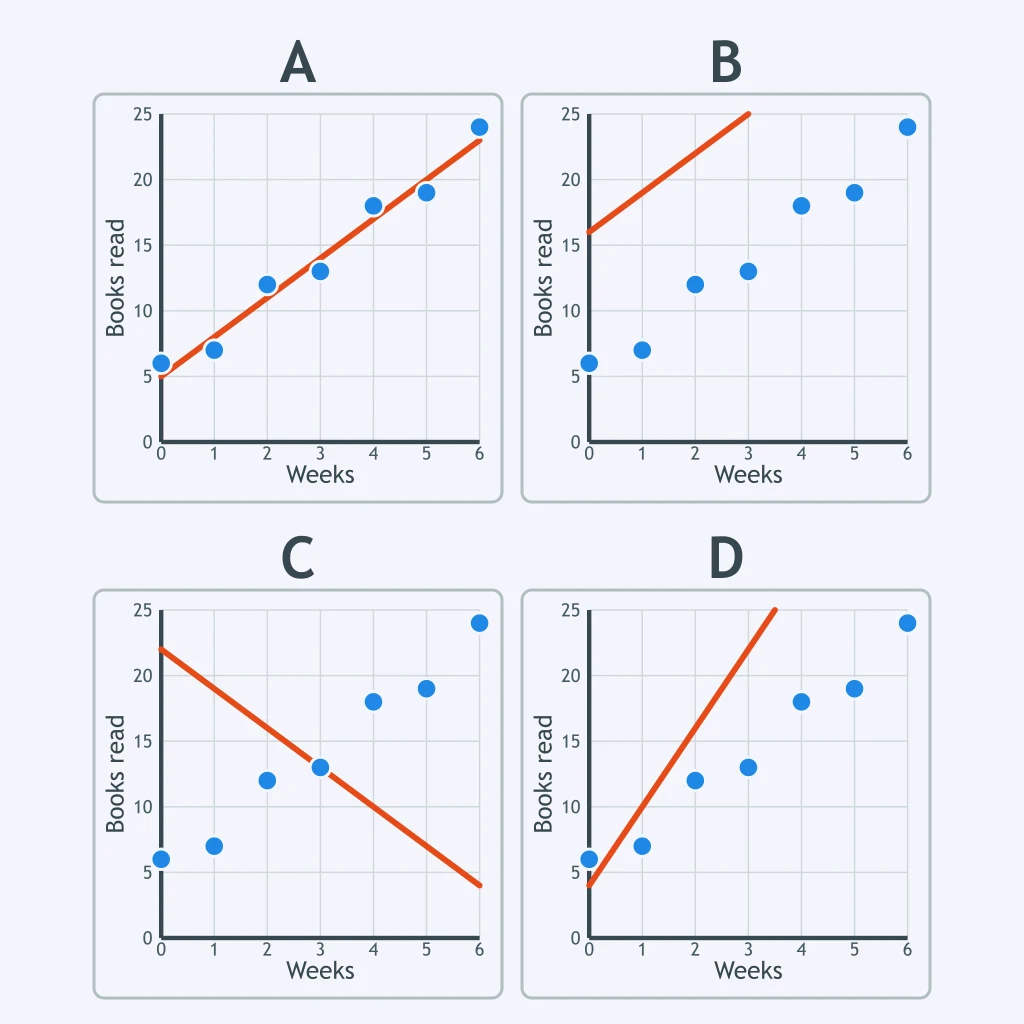
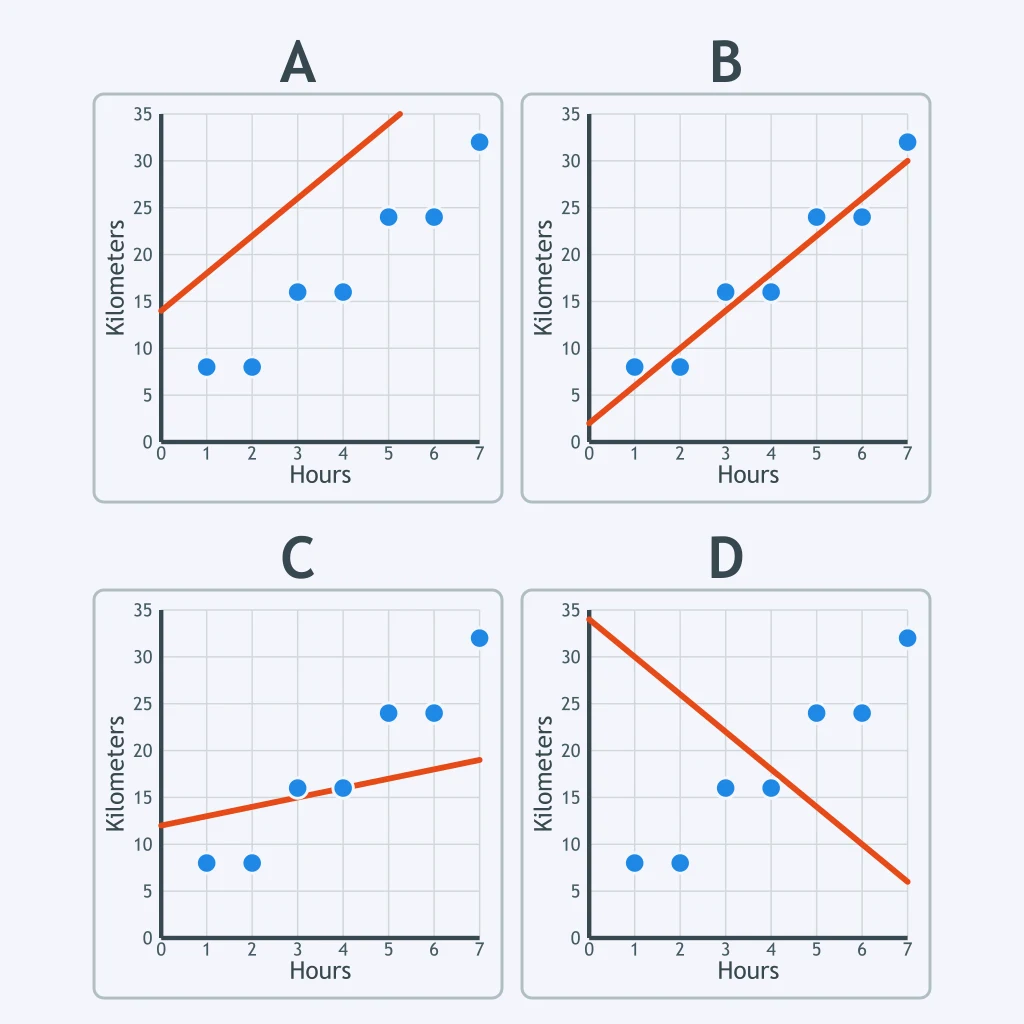
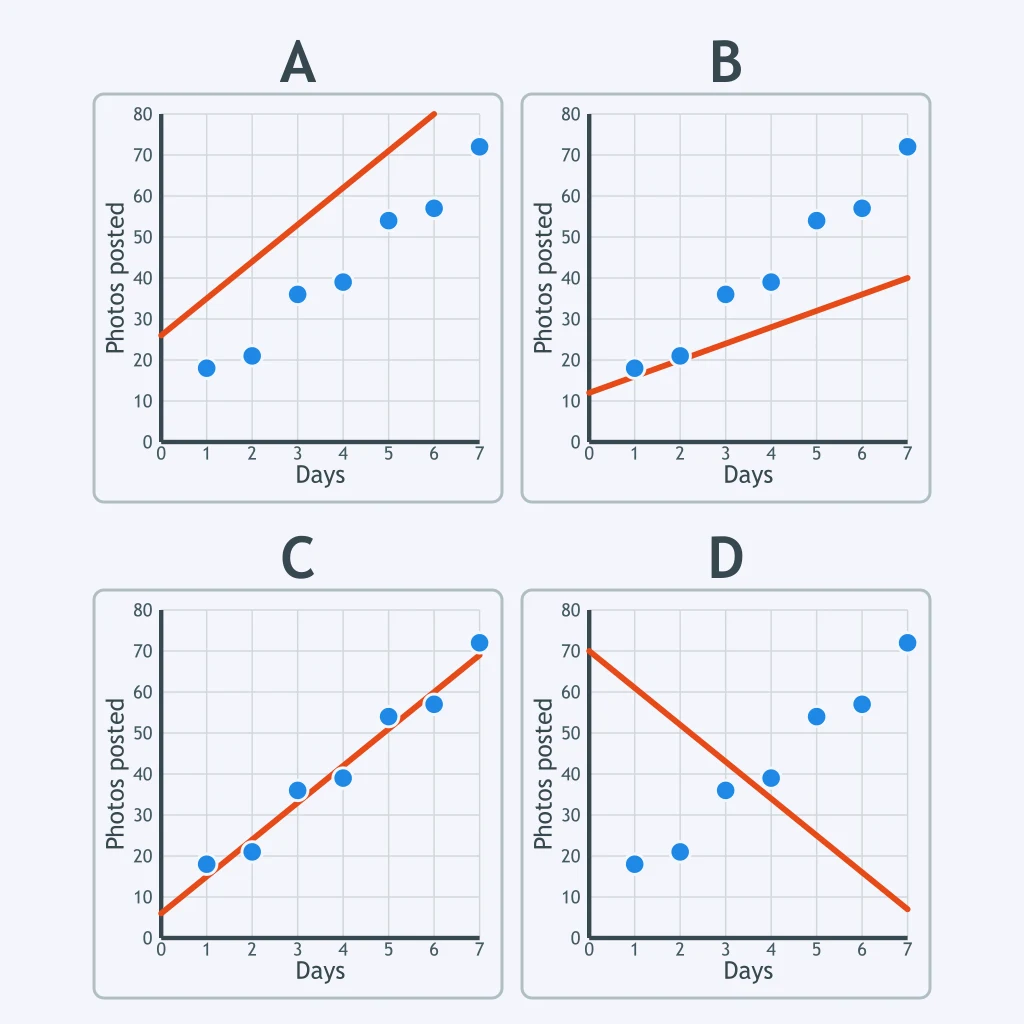
All four panels plot the same reading data, each with a different line drawn on it. In which panel does the line fit the points best?
Four students each drew a trend line on the same travel data. Whose panel holds the best fit?
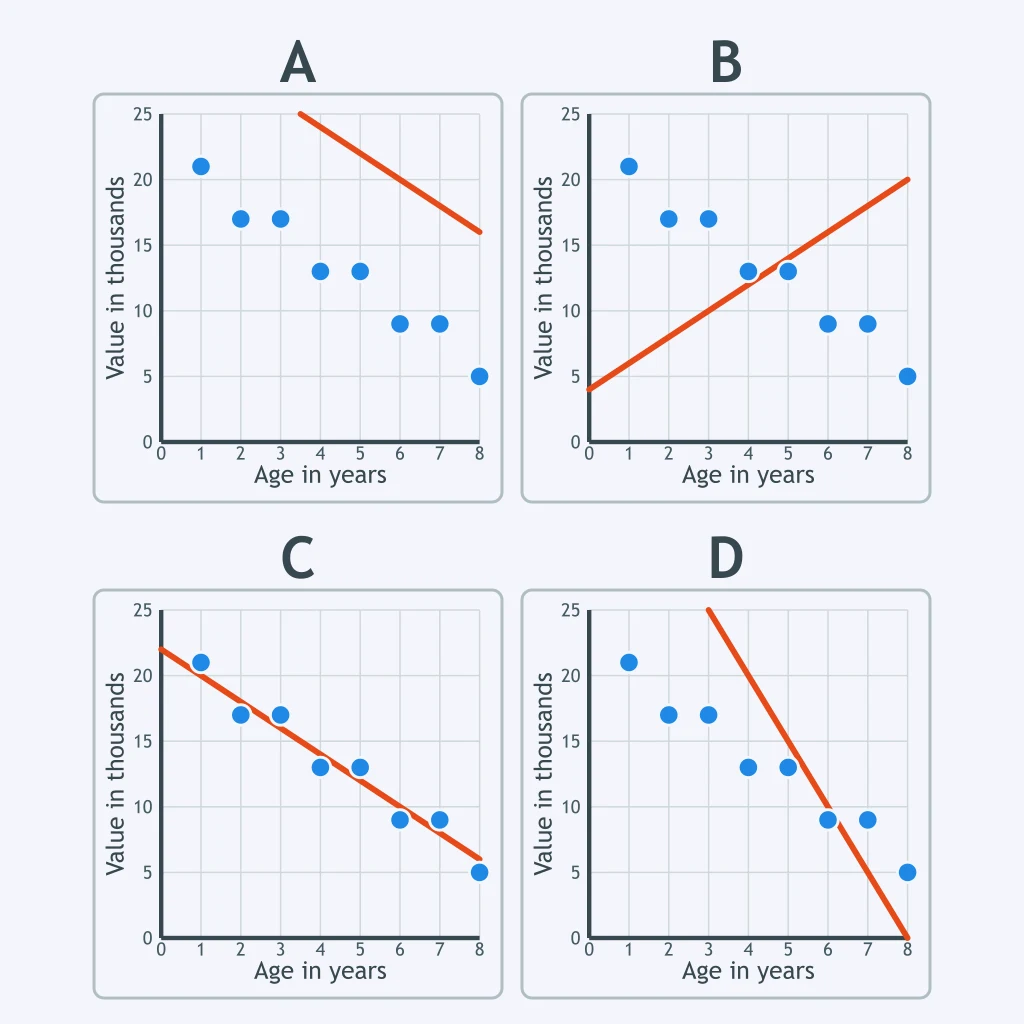
The same car-value points are plotted in all four panels with a different line on each. Which panel's line runs through the middle of the points?
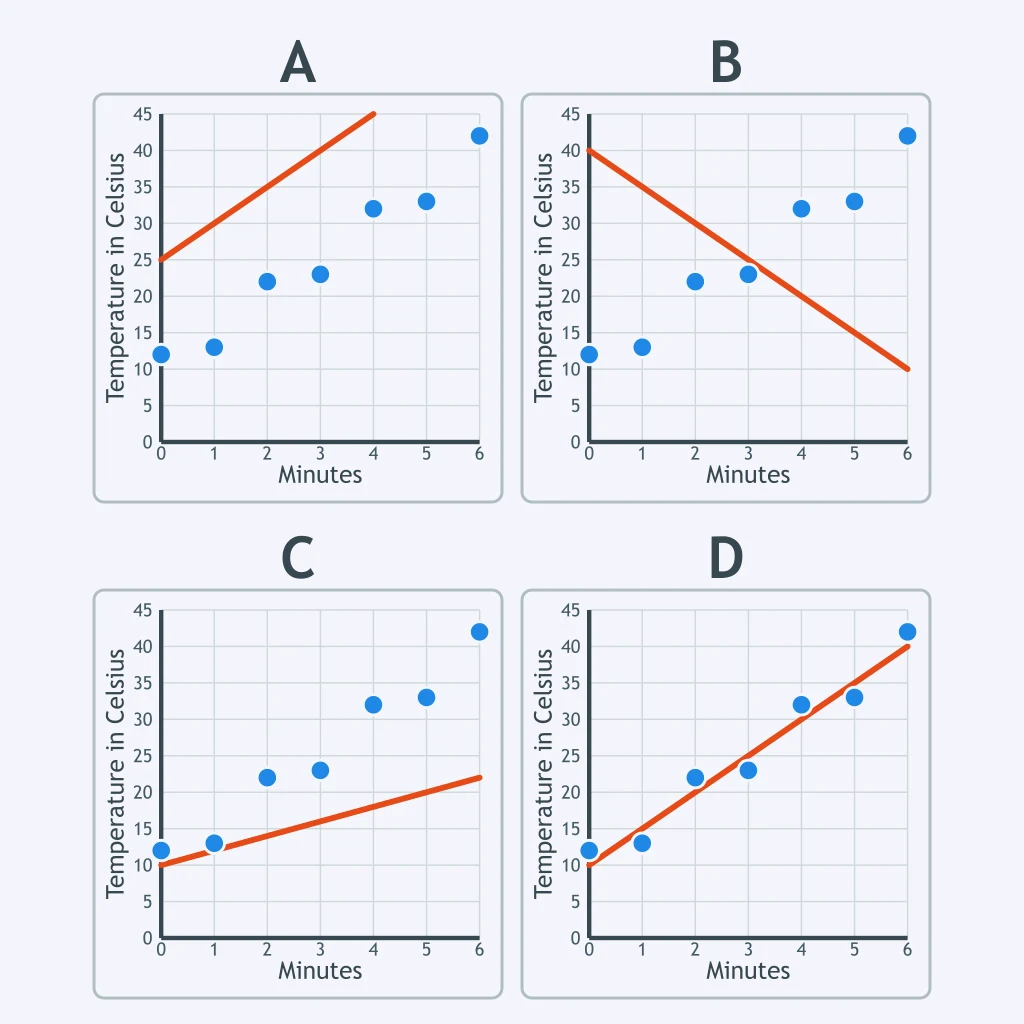
Each panel shows the same heating data with one line drawn on it. Which line would you keep as the line of best fit?
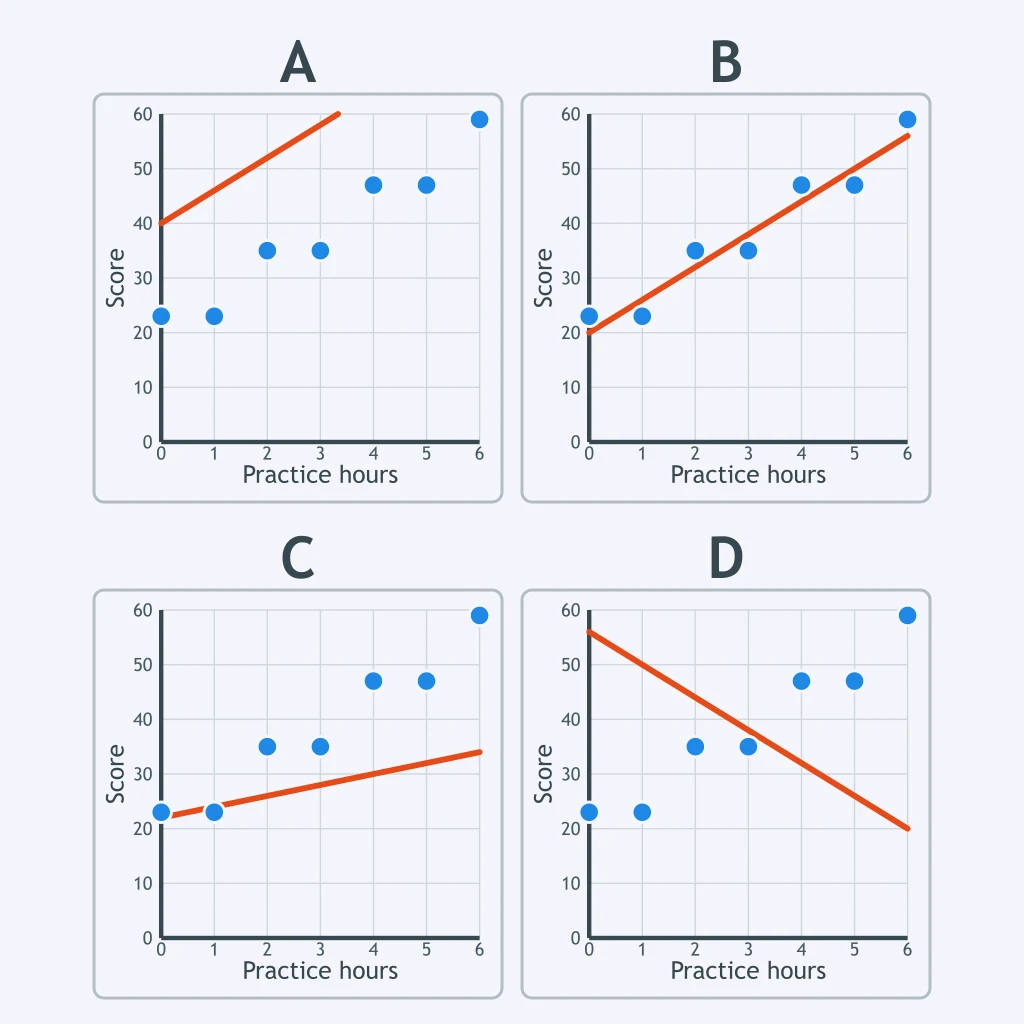
All four panels carry the same practice-and-score points. In which panel is the drawn line closest to the middle of them?
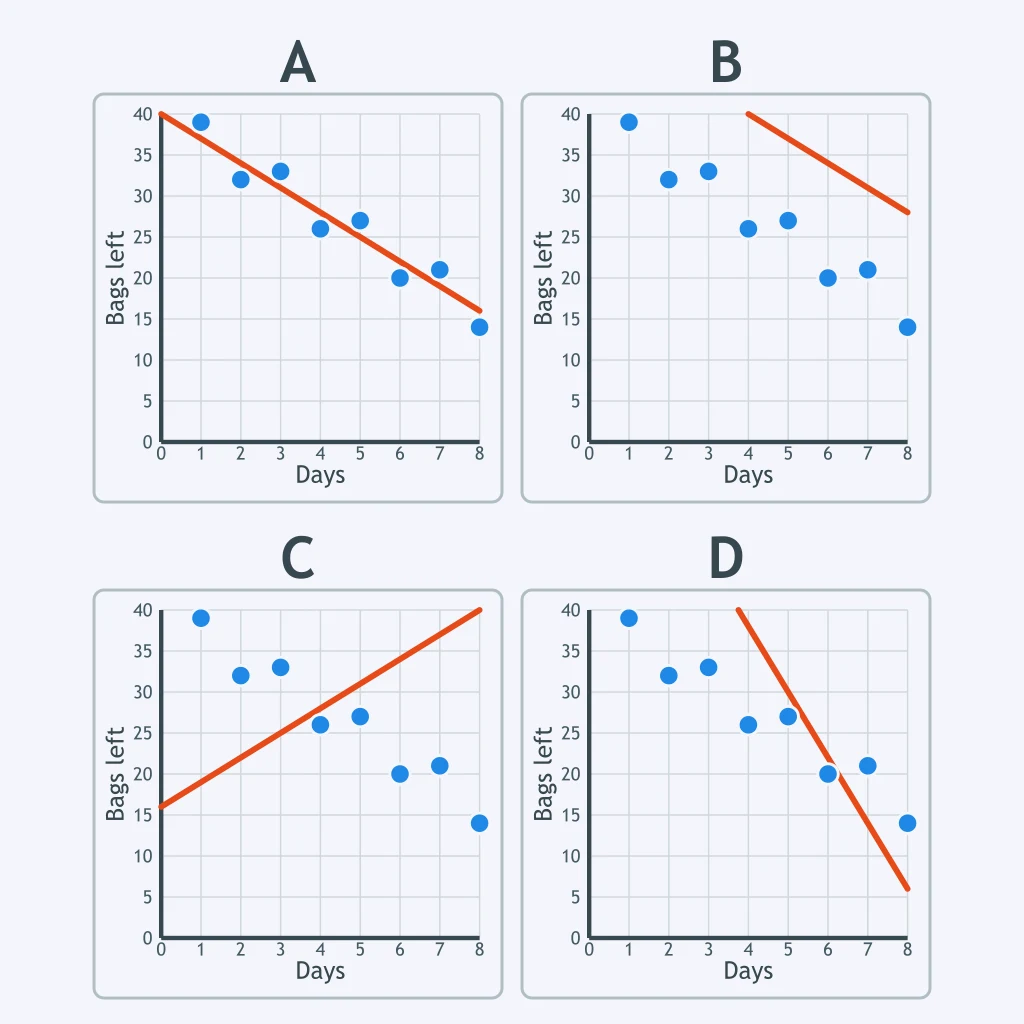
The same bags-left points appear in every panel with a different line drawn. Which panel shows the best trend line?
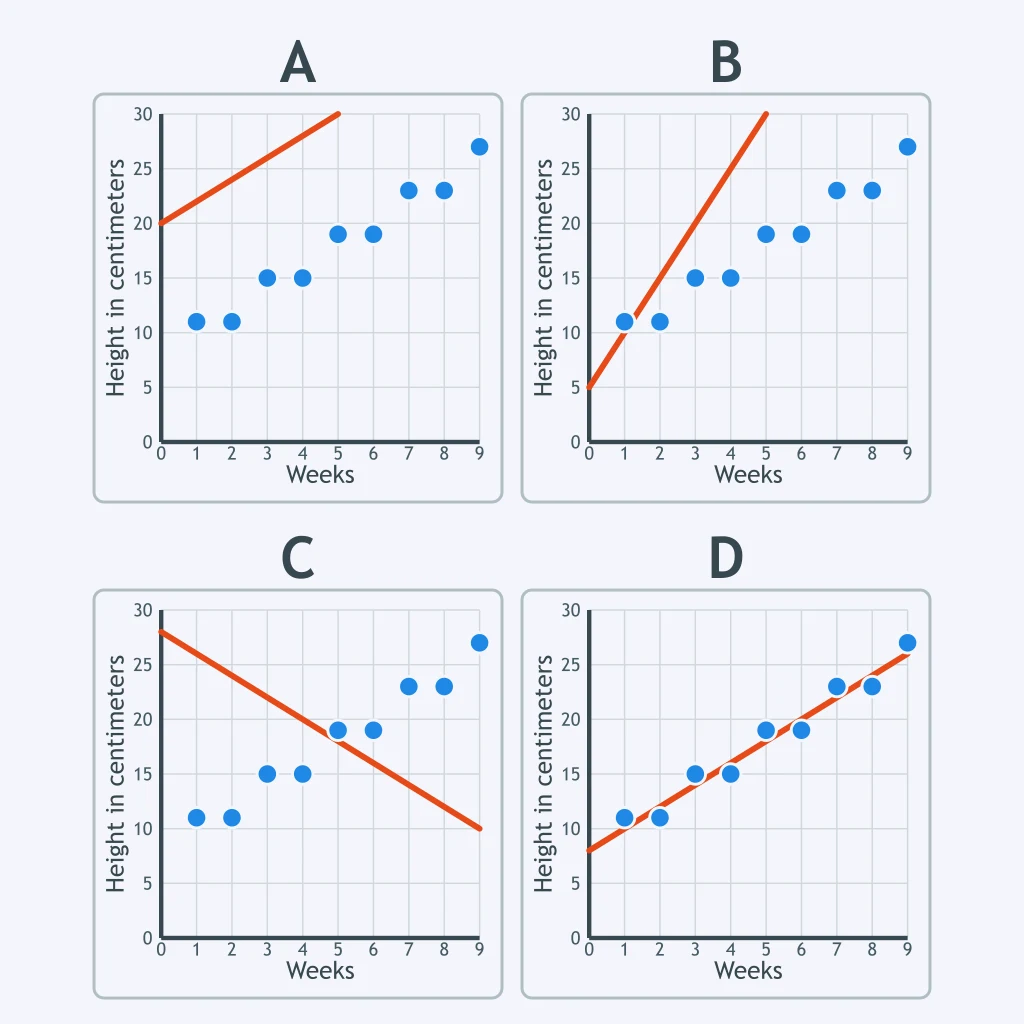
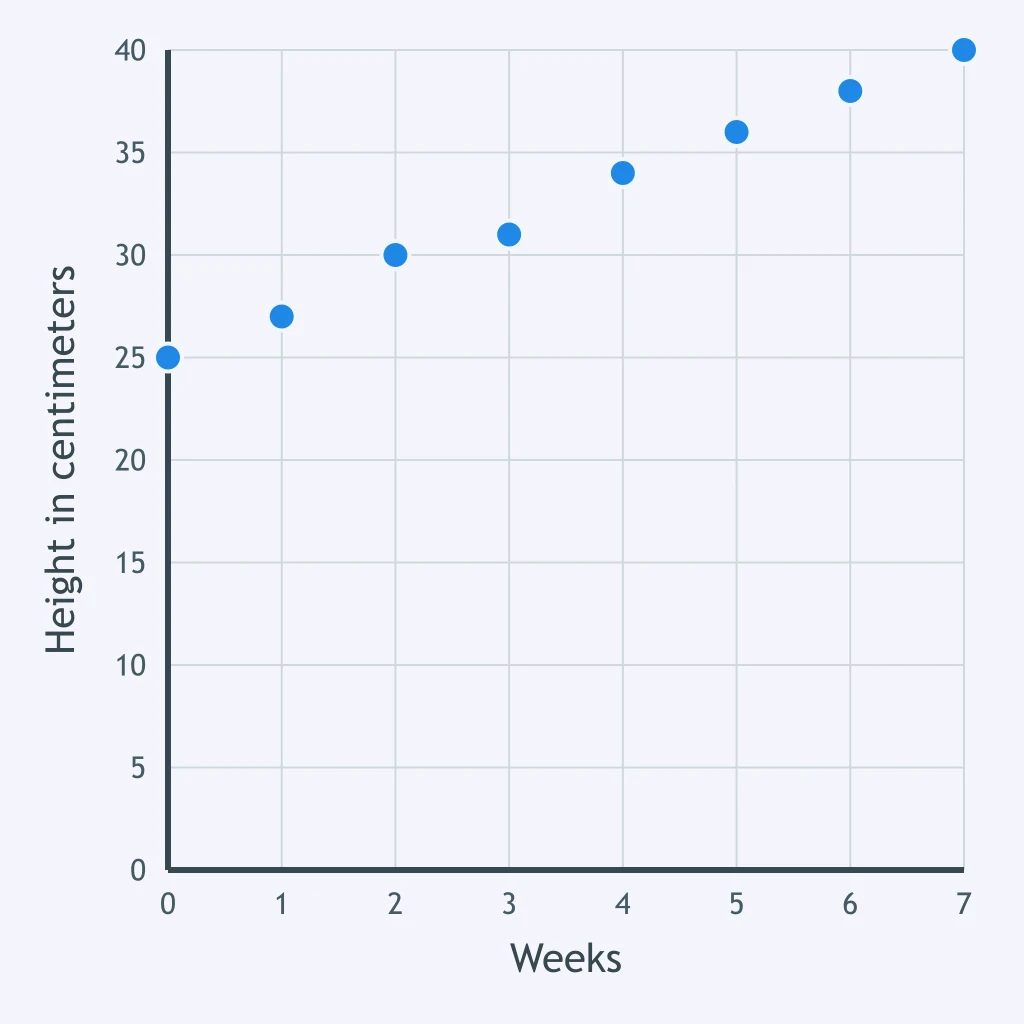
Four panels plot the same seedling heights, each with its own straight line. Which line balances the points above and below it best?
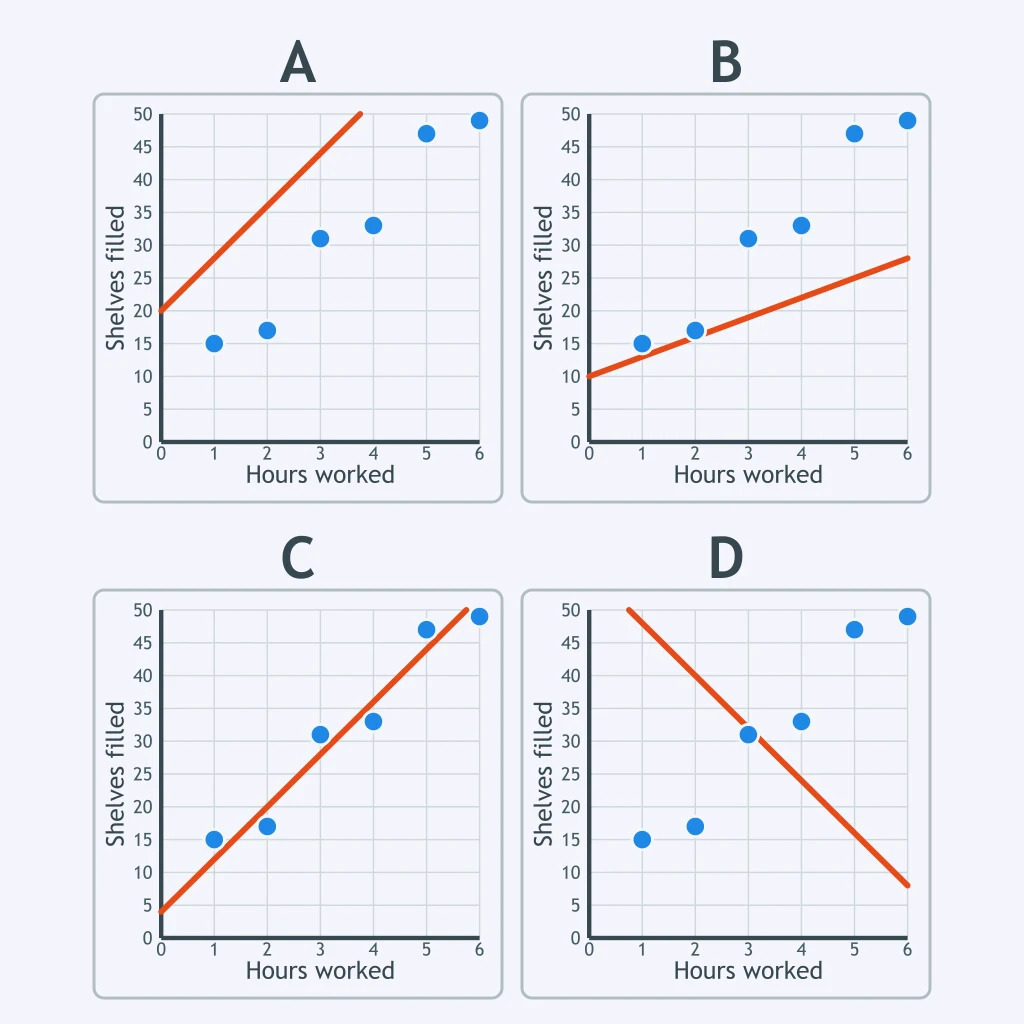
Each panel draws one line over the same workshop data. Which panel's line would give the most sensible predictions?
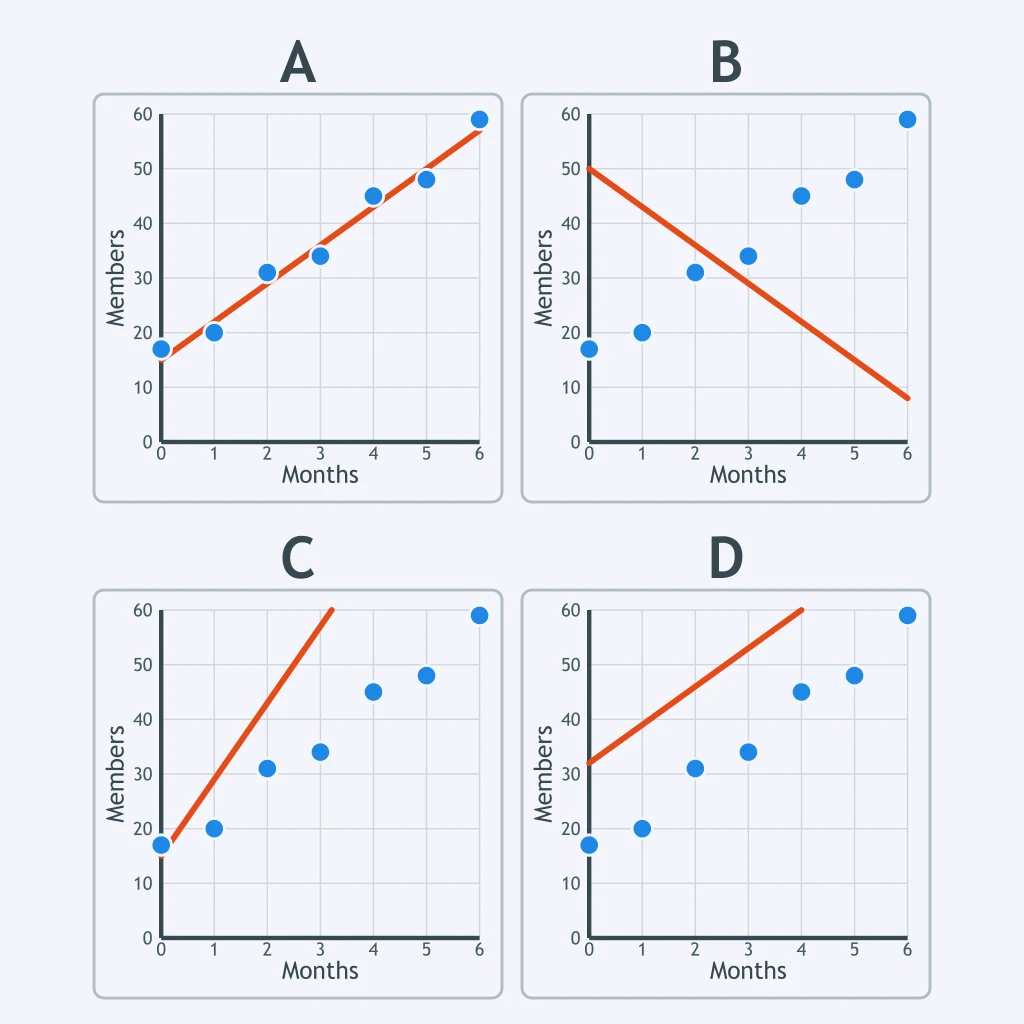
All four panels plot the same membership points with one line each. In which panel does the line fit the points best?
The same photo-posting points are drawn in four panels with four different lines. Which panel holds the line of best fit?
Twelve points are plotted with no line yet. If a trend line is drawn well through them, about how many points should lie above it?
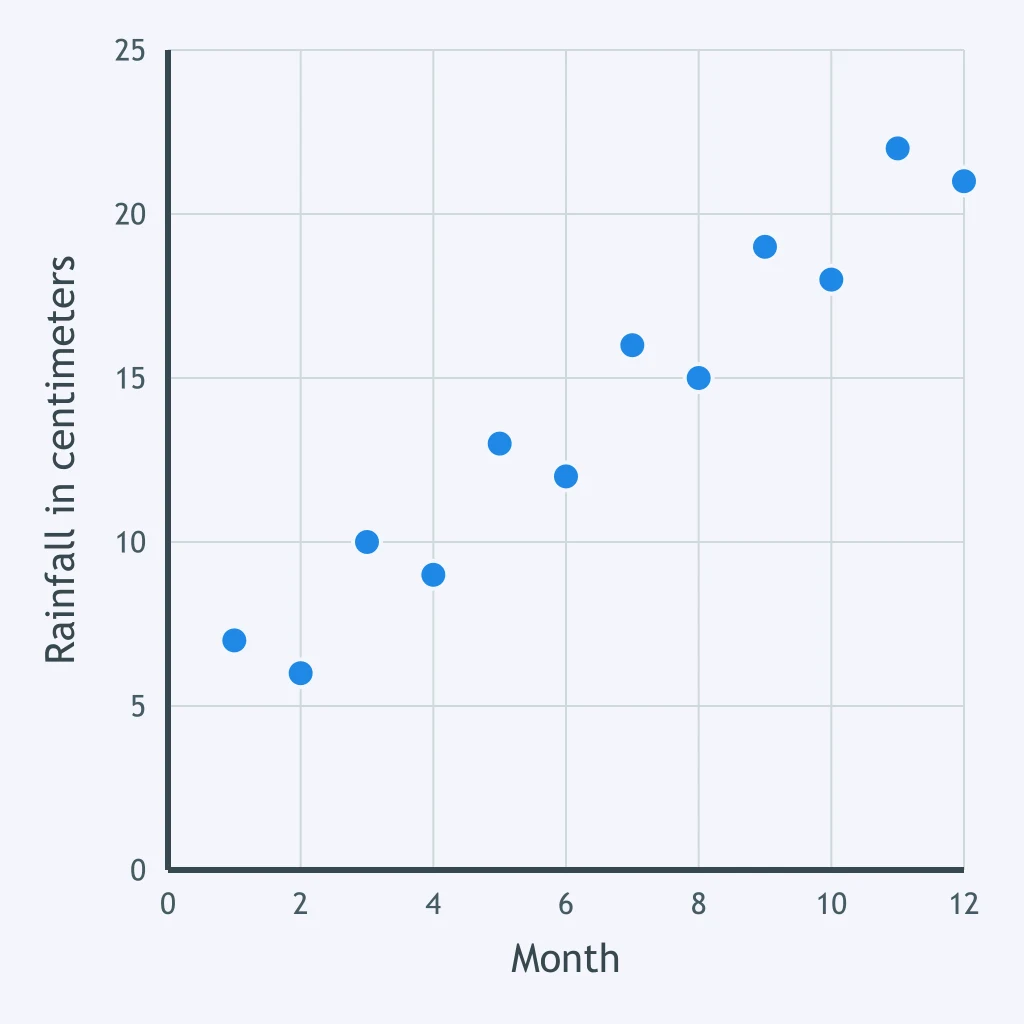
Ten points are plotted and no line is drawn yet. A well-drawn trend line would leave about how many of them below it?
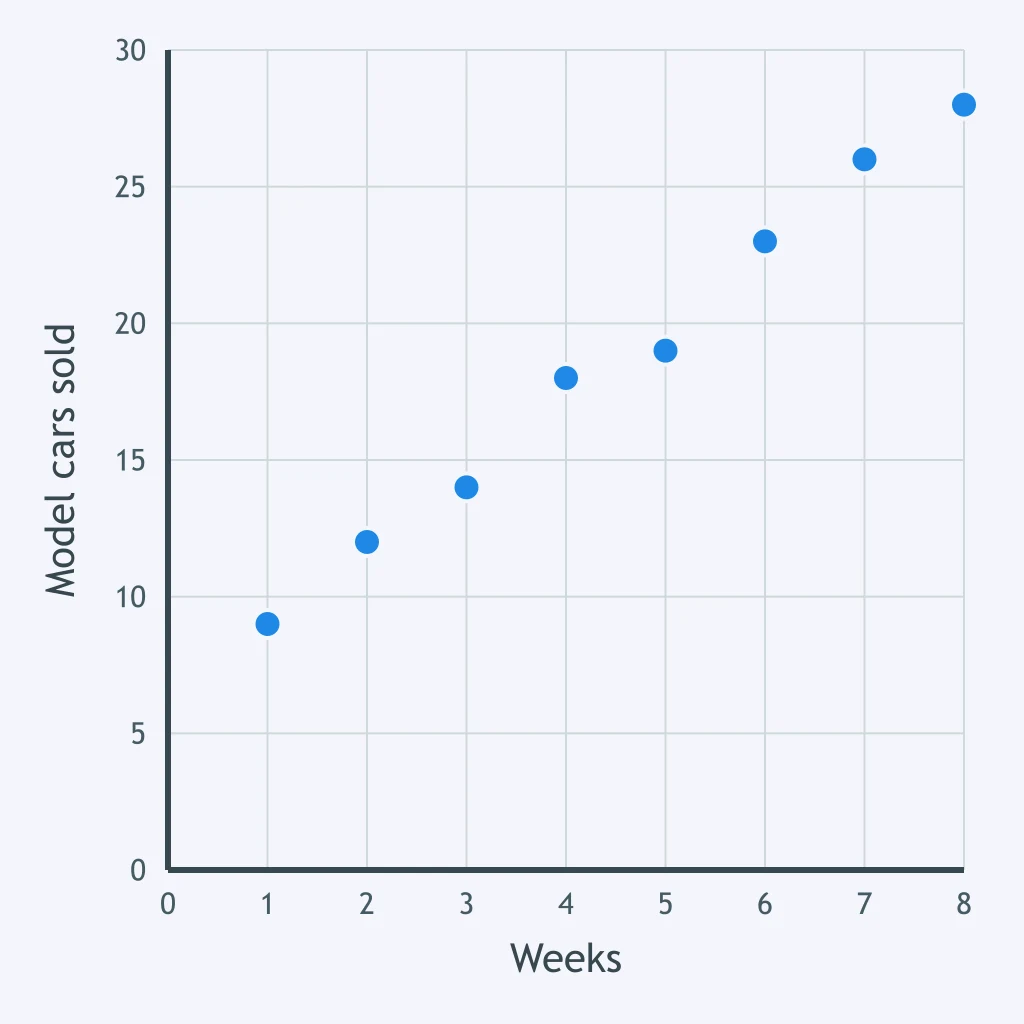
Where should a trend line be drawn on this model-car plot?
How many of these plotted sticker points must a well-drawn trend line pass through?
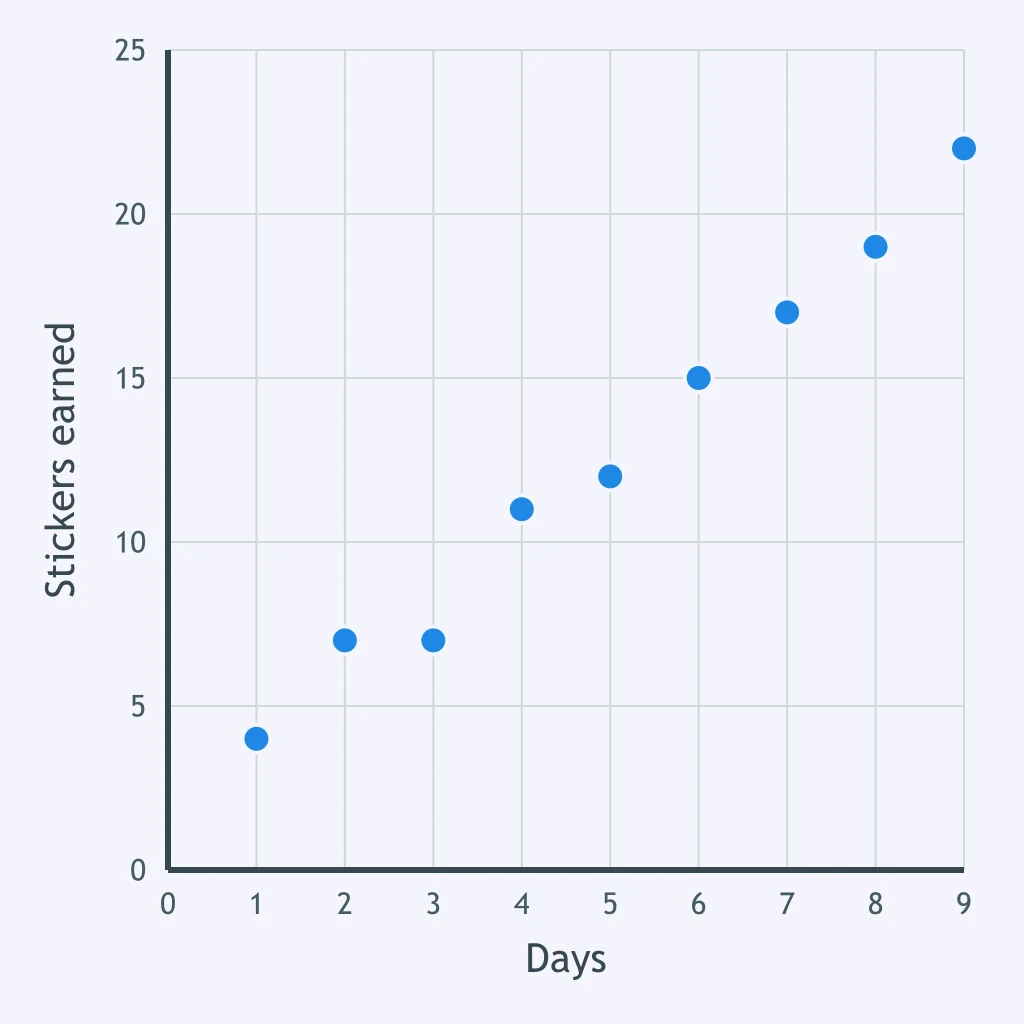
No line has been drawn on this puzzle plot yet. In which direction should a trend line for these points slope?
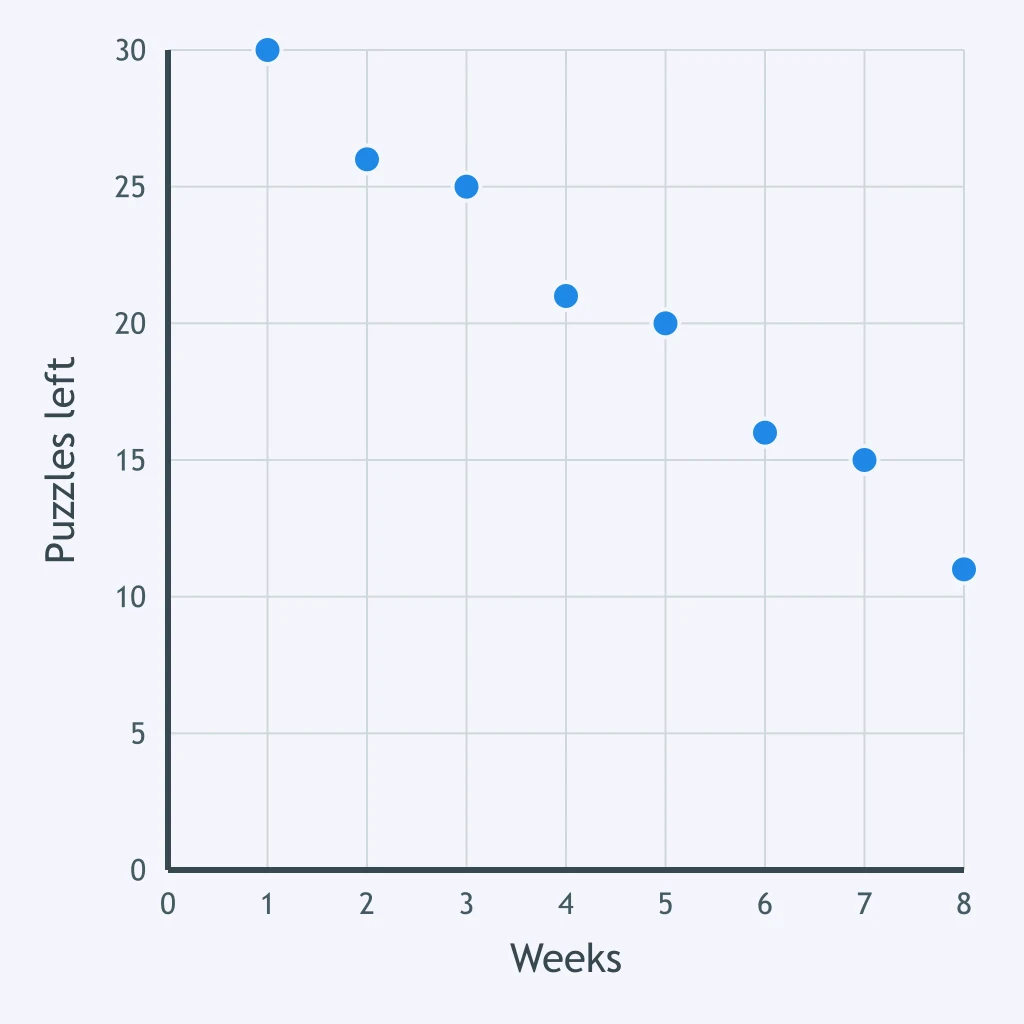
A good trend line has about half the points above it. How many of the ten plotted points lie above the line drawn here?
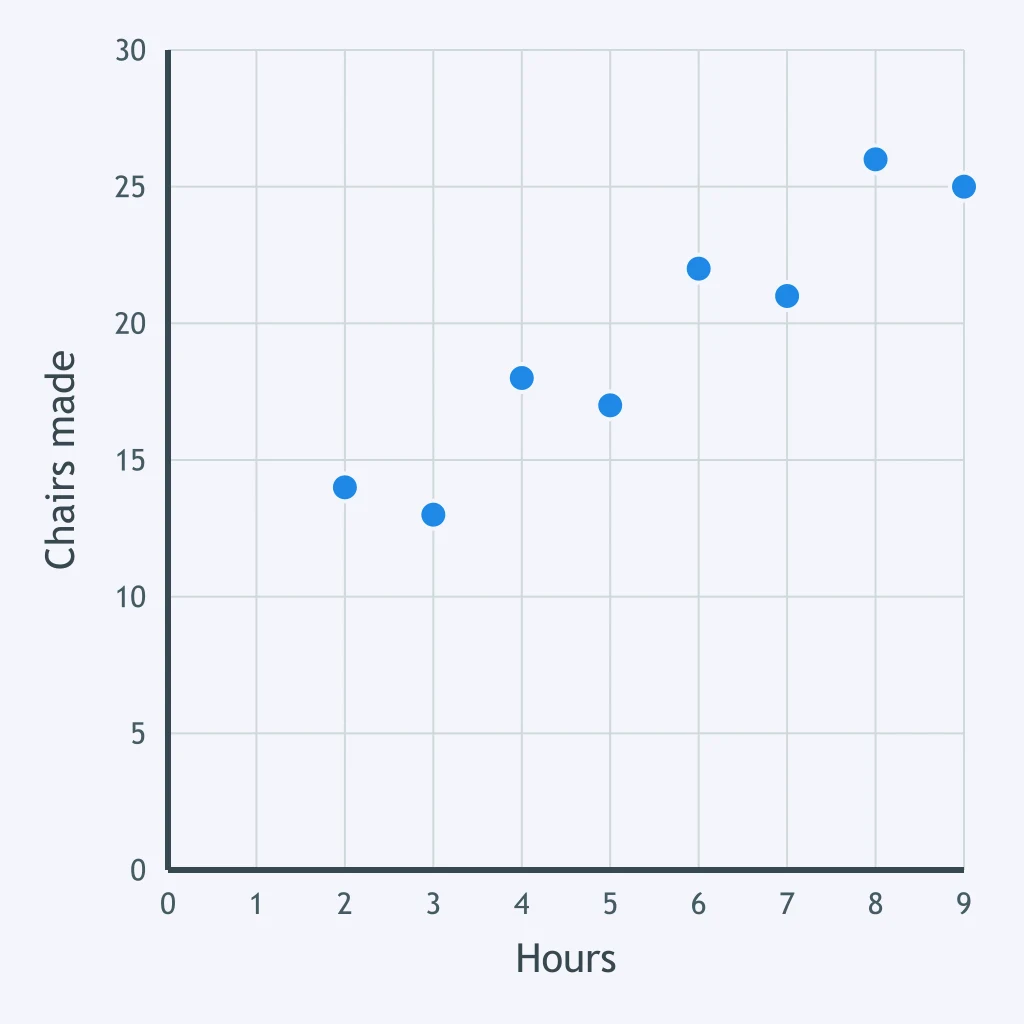
Where should a trend line pass in relation to the highest and lowest points on this plot?
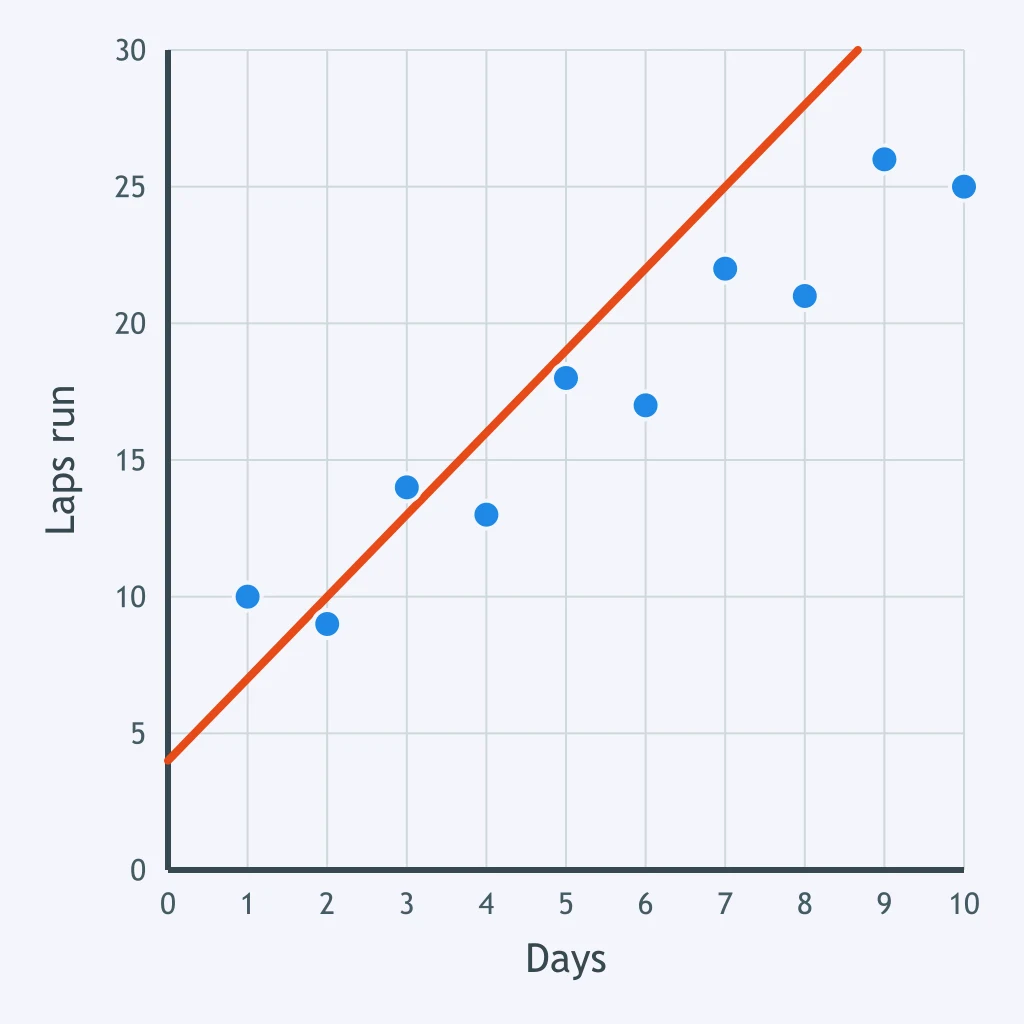
A student says every trend line must start at the origin. Why would that ruin the fit for this plot?
Crack the passcode before the zombies get in.
Answer, then swat bugs for bonus points.
Race through questions at your own speed.
Same question on every screen. Fastest wins.

Pick a tile, answer, hit bonuses and steals.
What the Slope and Intercept Mean
40 questions