Loading
by BlastRoom
Use a trend line to predict a value the data does not contain.
#us_grade_8_math

40 questions
One question set, multiple game modes. Tap any game to see it in action. Not sure which to pick?
Answer to place stones and capture territory.
Outrun the snow together.
Earn blasts, then hunt the other team.
Answer to earn energy, then climb.

The class blasts through walls together.
Bid on mystery lots. Most money wins.
Sell tours. Nice, standard, or a total scam.

Answer, restock, and serve the rush.
More correct answers pulls the rope your way.
Answer, then shoot down the alien wave.
Answer, then tap to leap the frozen ridge.
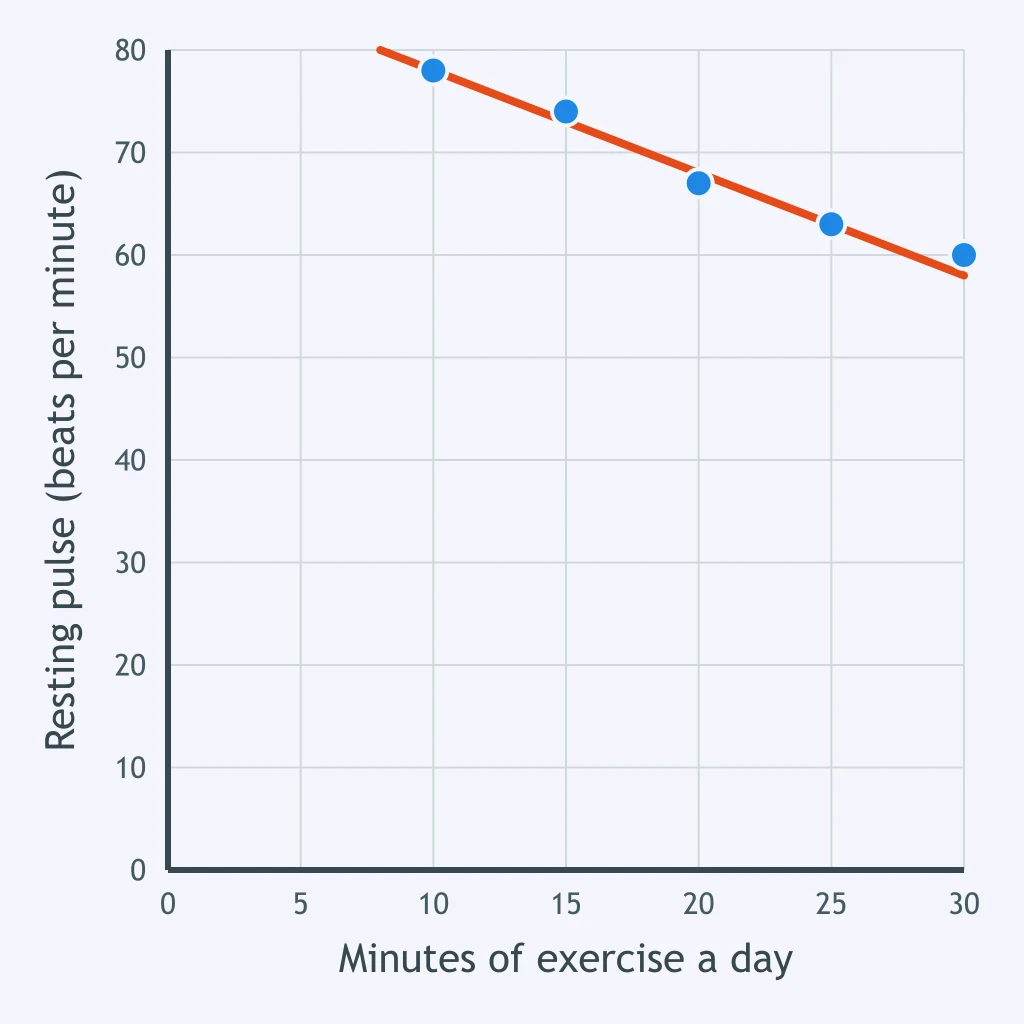
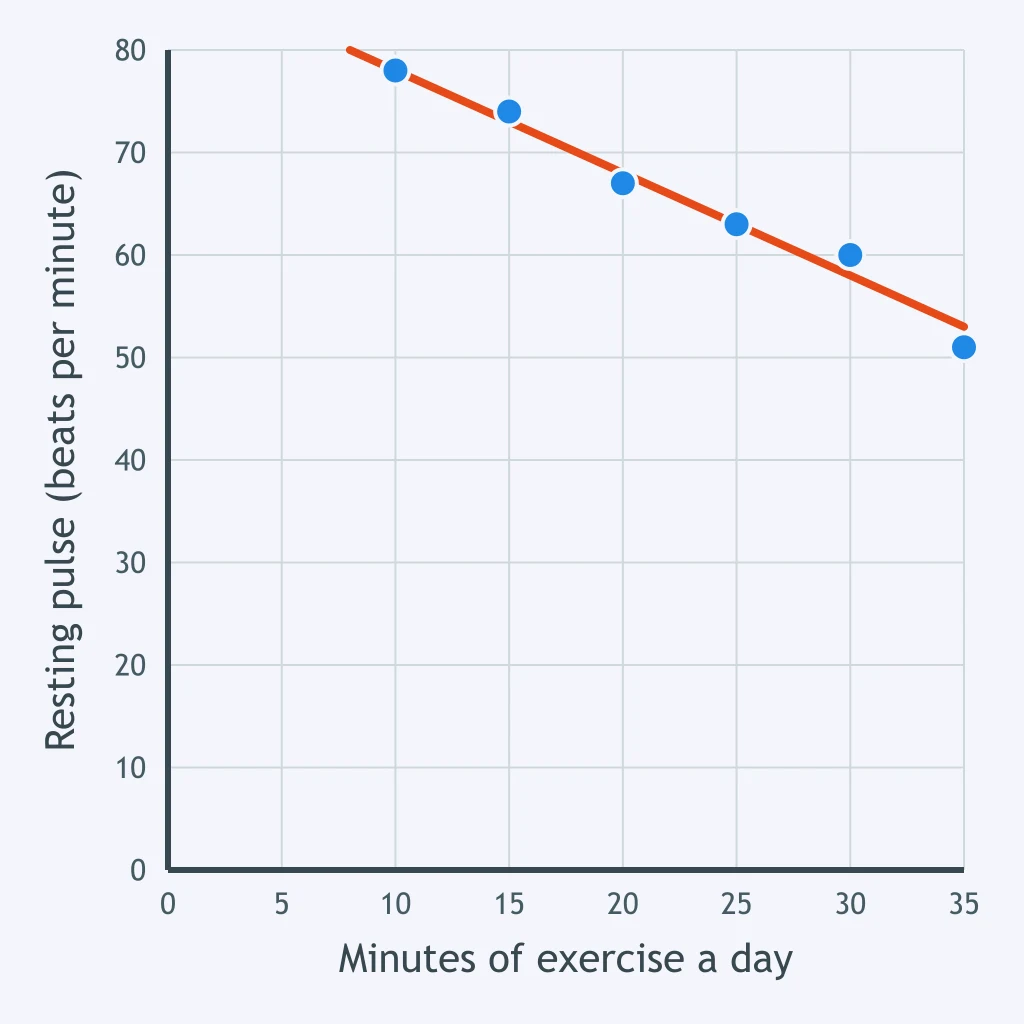
The trend line drawn on the plot is y = -x + 88. The plot has no reading at 16 minutes of exercise a day. What resting pulse does the line predict at 16 minutes?
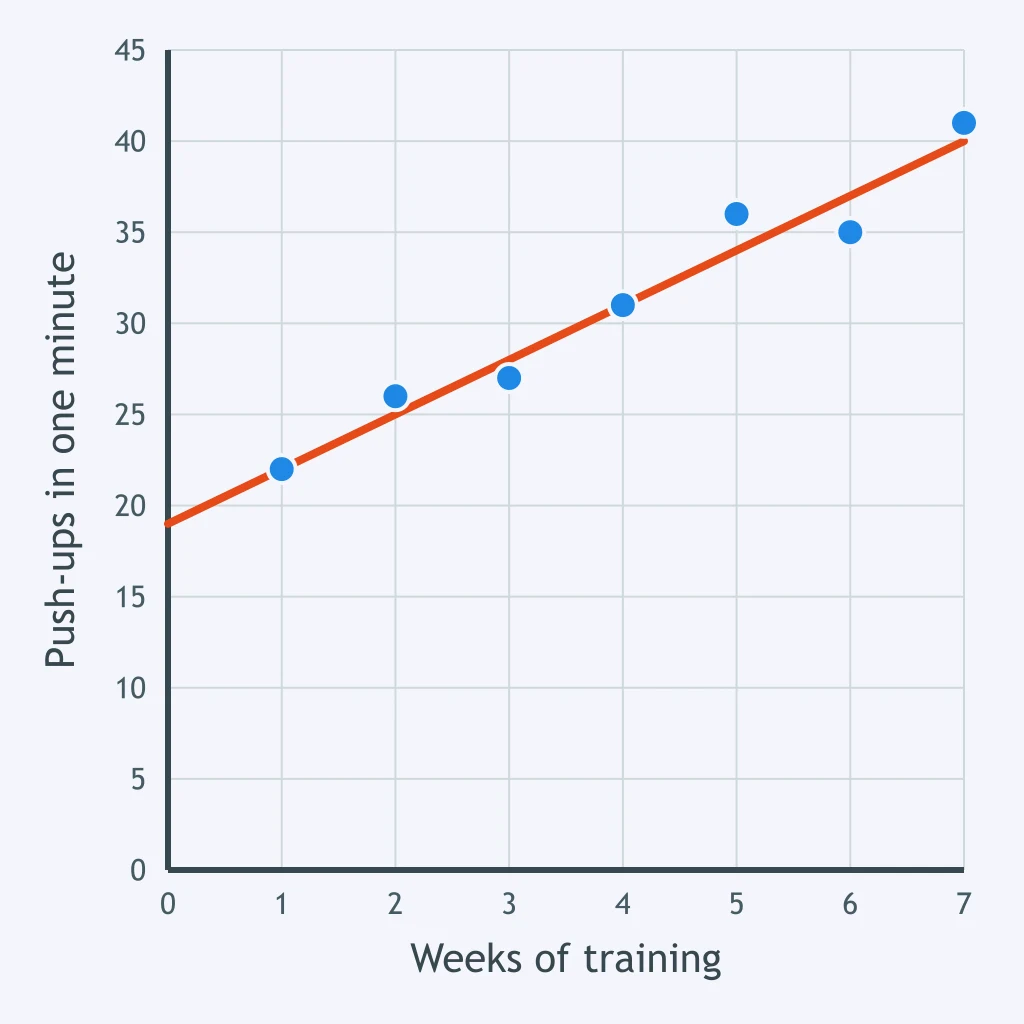
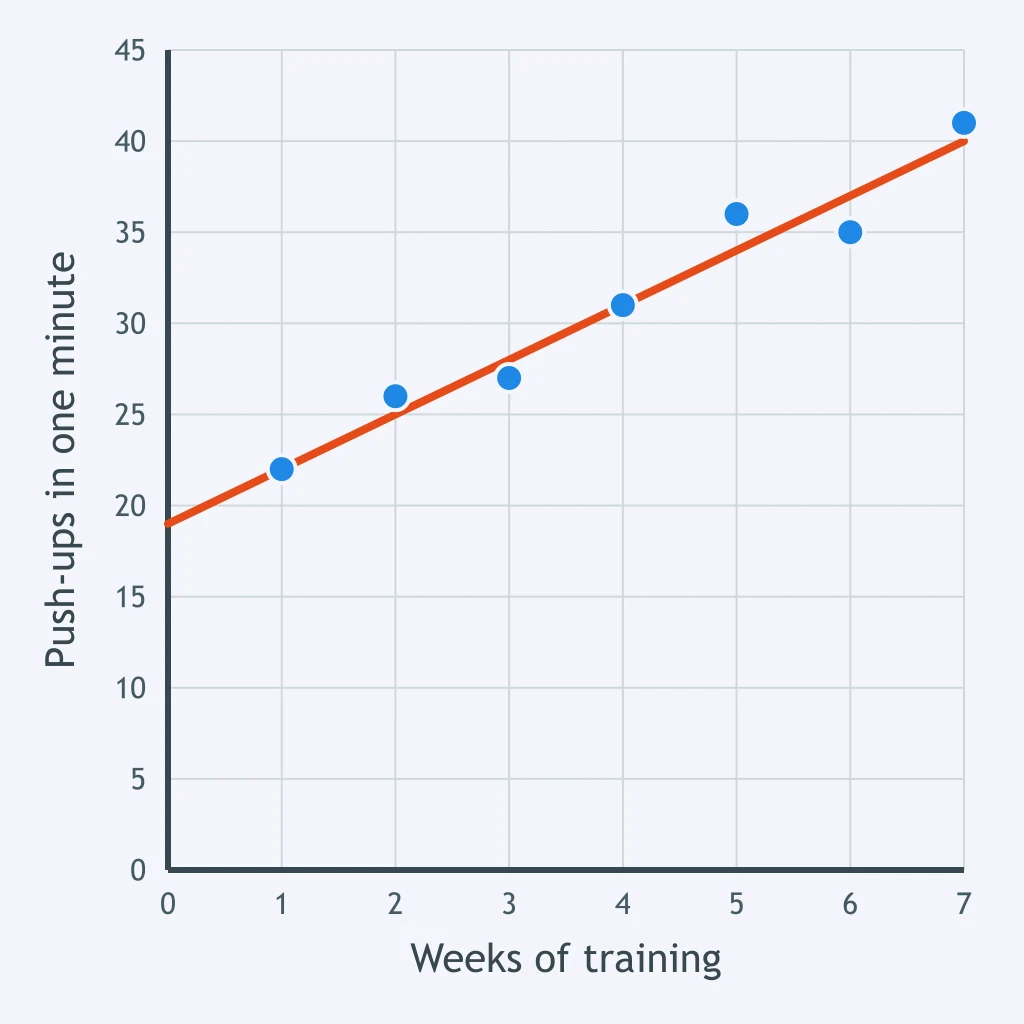
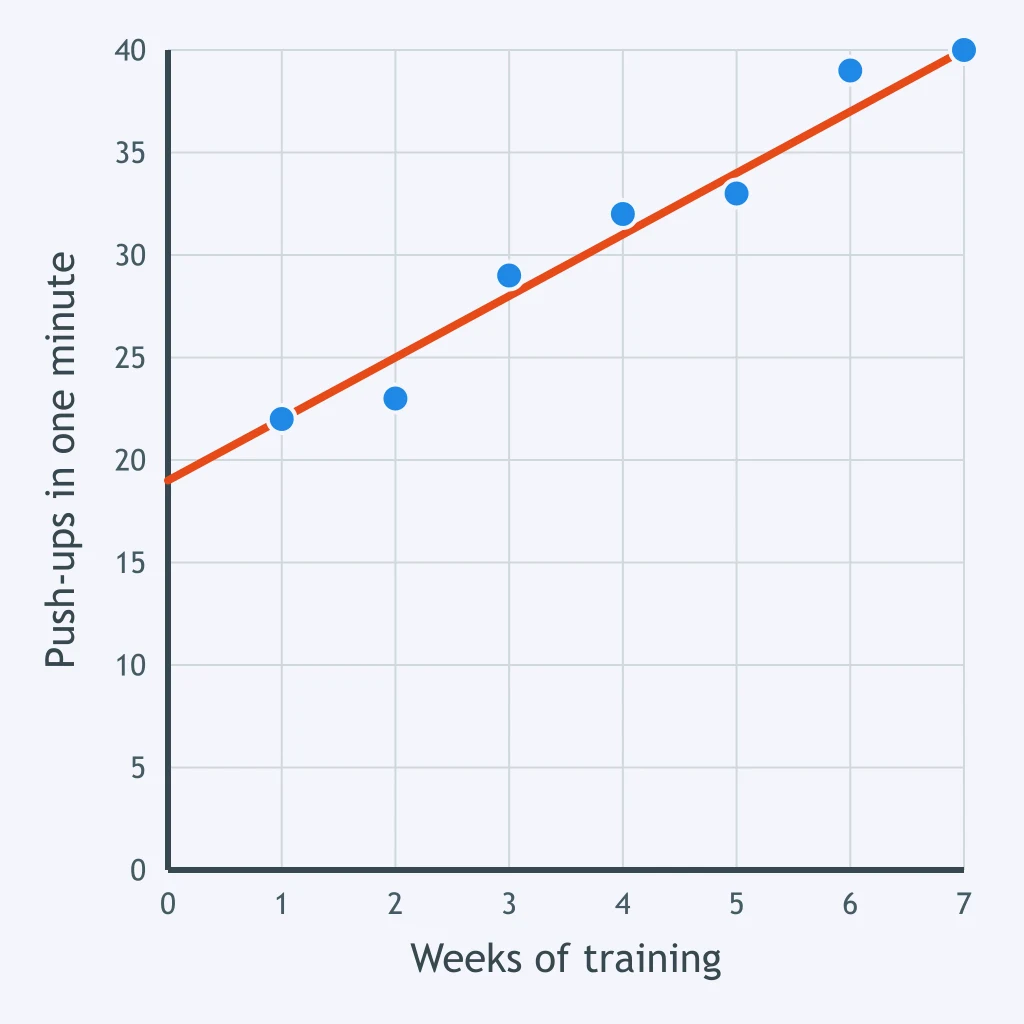
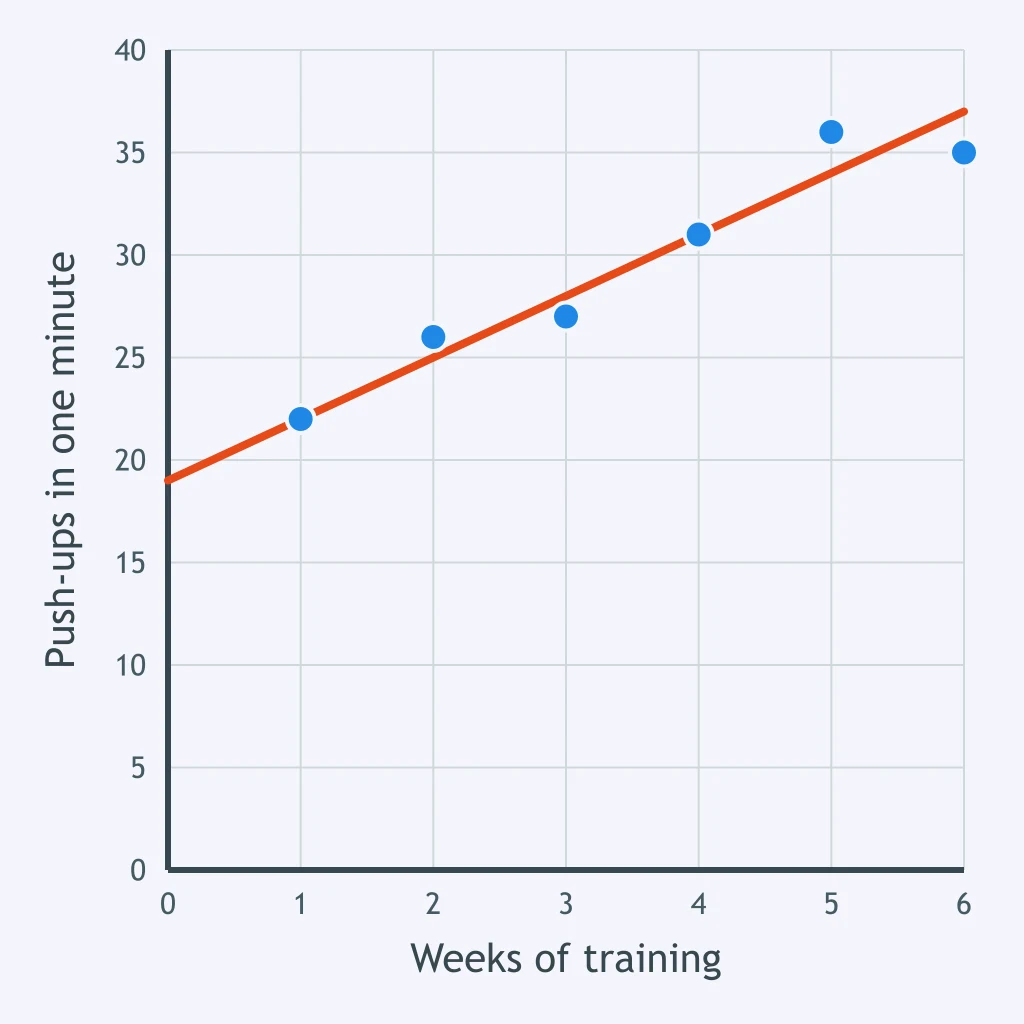
The trend line drawn on the plot is y = 3x + 19. How many push-ups in one minute does the line predict at 9 weeks of training, beyond the plotted data?
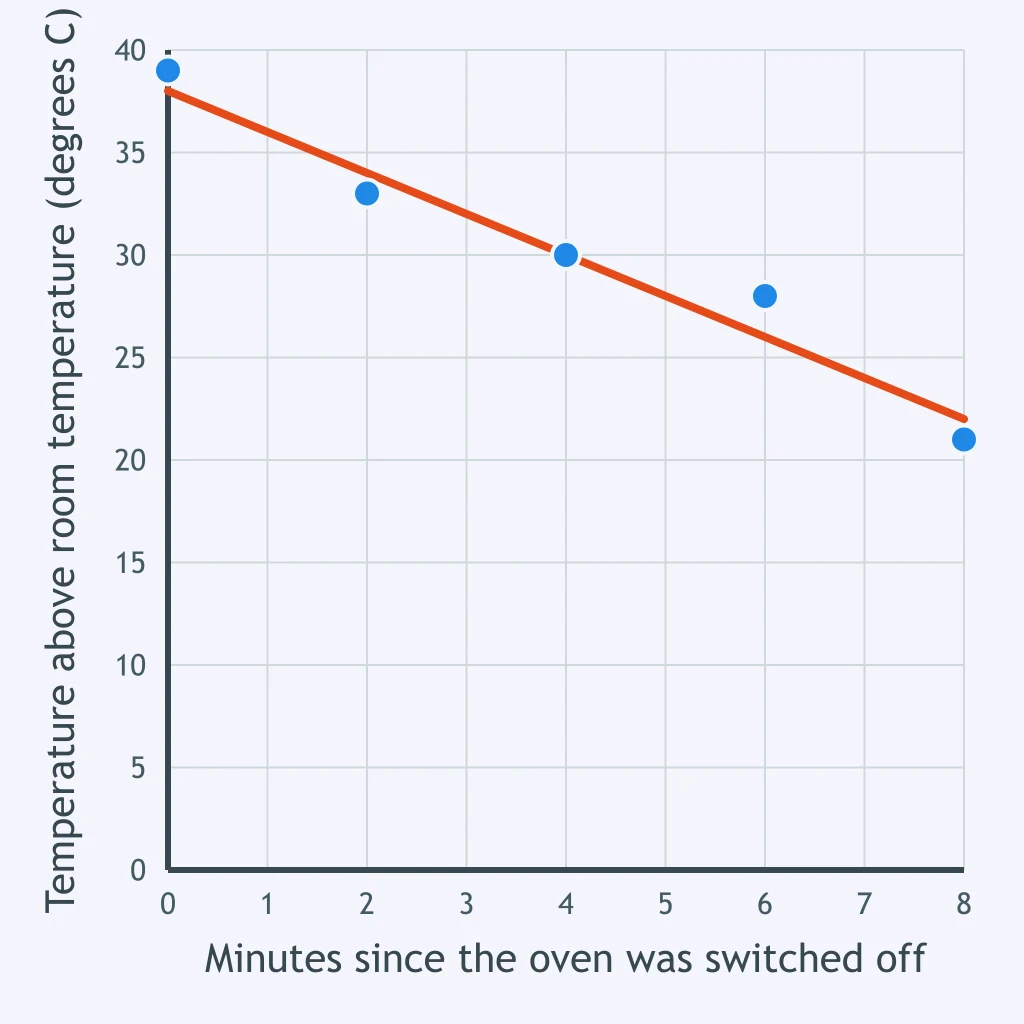
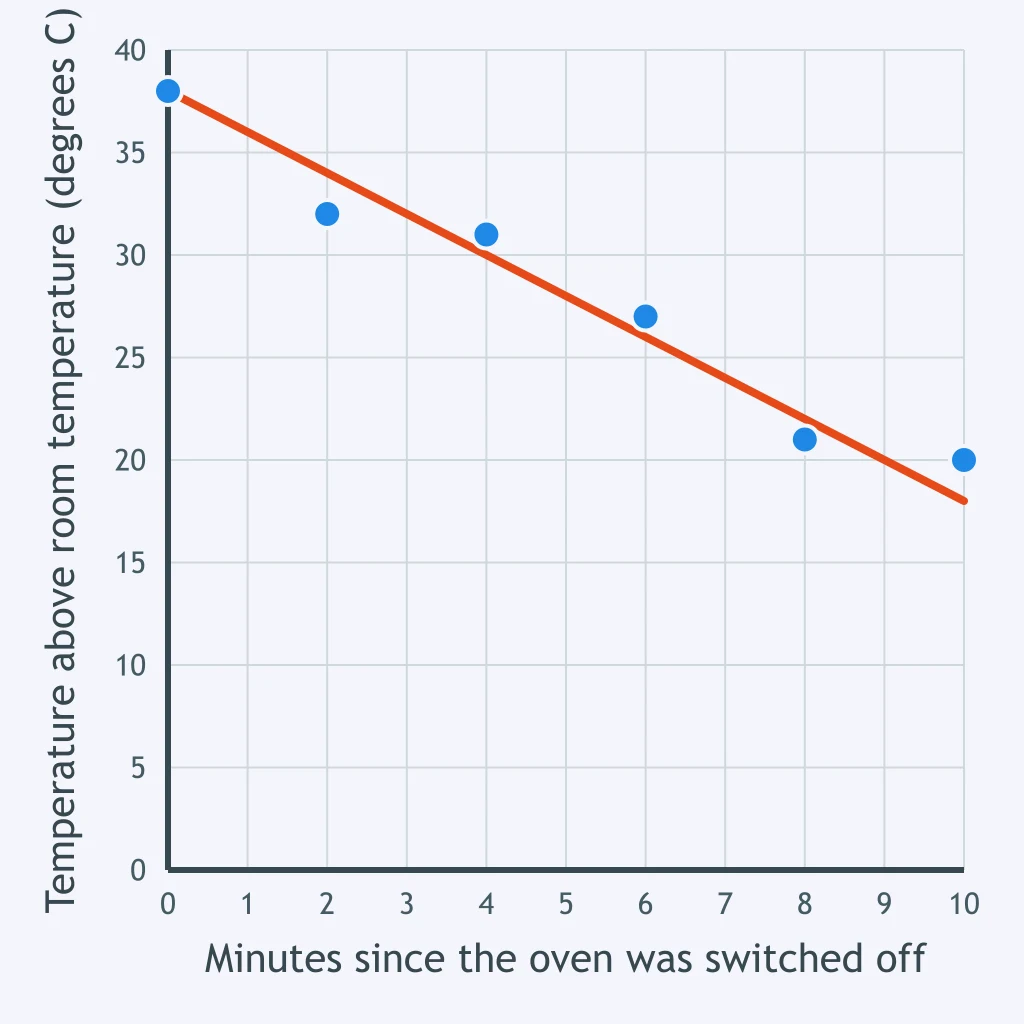
The plotted data for a cooling oven runs from 0 minutes to 8 minutes. Putting 60 minutes into the trend line y = -2x + 38 gives -82 degrees C. What does that show?
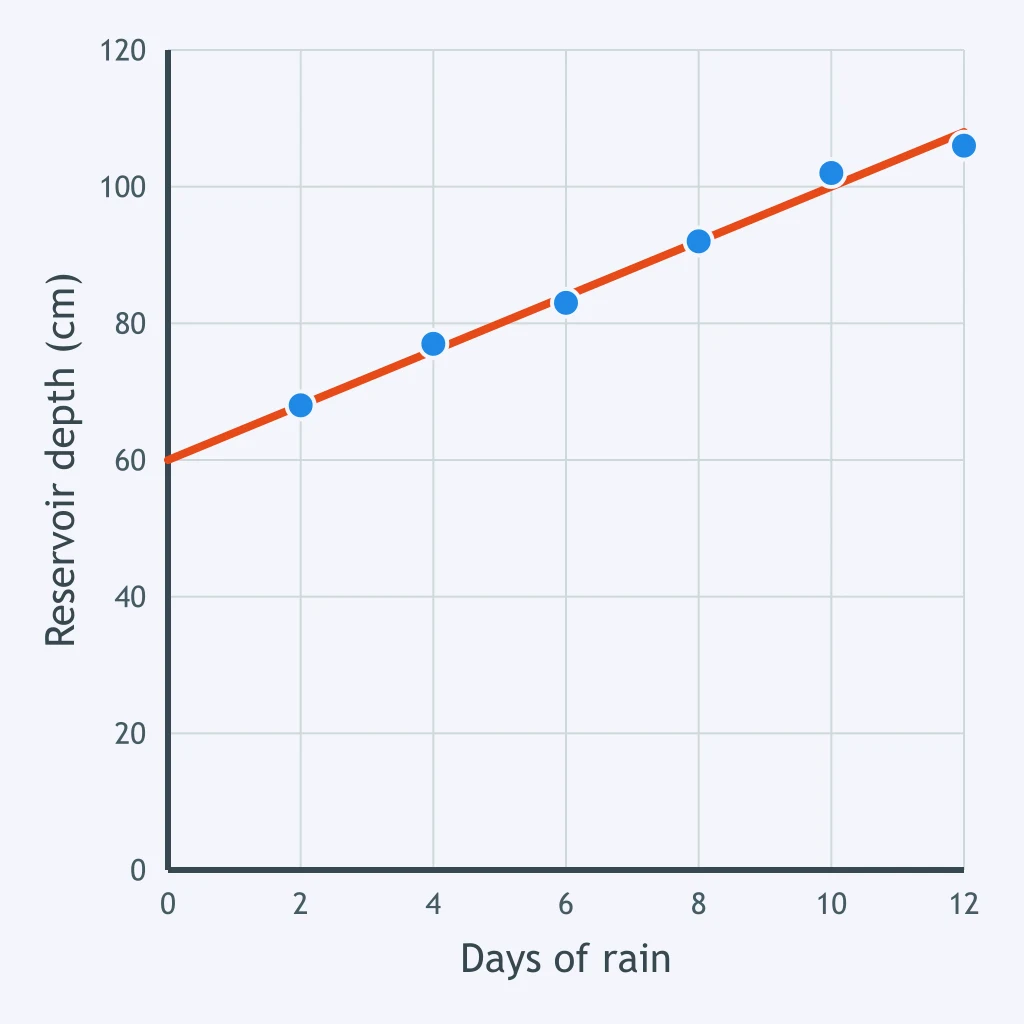
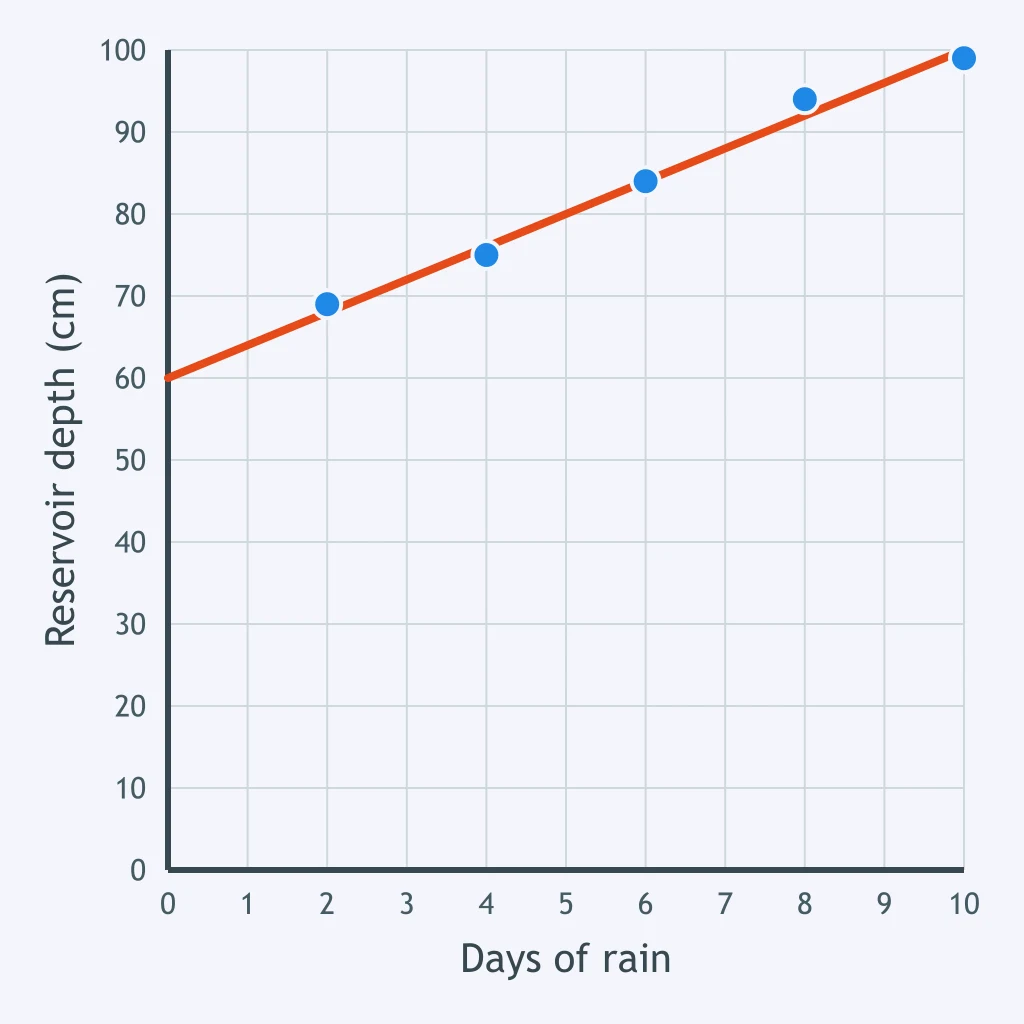
The trend line drawn on the plot is y = 4x + 60. What reservoir depth does the line predict after 20 days of rain, beyond the plotted data?
The plotted data for one athlete runs from 1 week to 7 weeks. Putting 200 weeks into the trend line y = 3x + 19 gives 619 push-ups. What does that show?
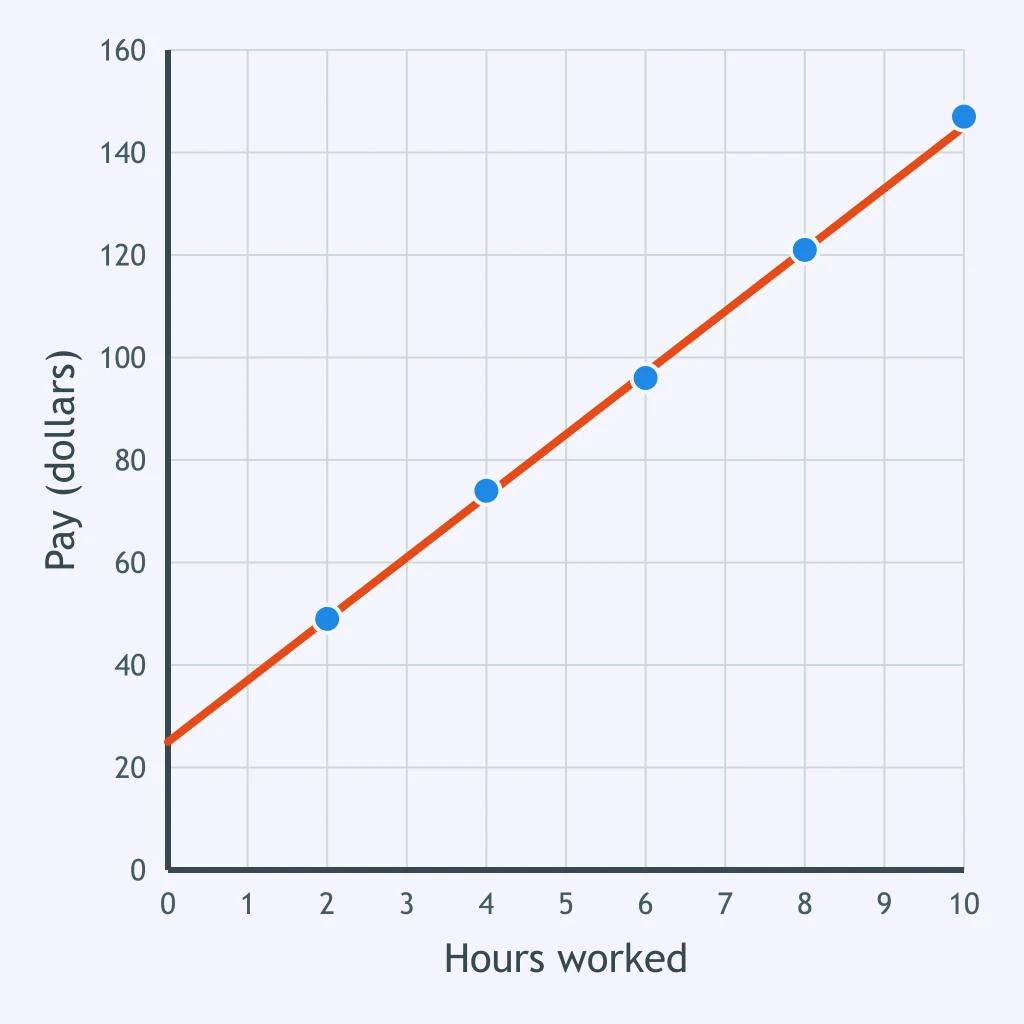
The trend line drawn on the plot is y = 12x + 25. What pay does the line predict for 14 hours worked, beyond the plotted data?
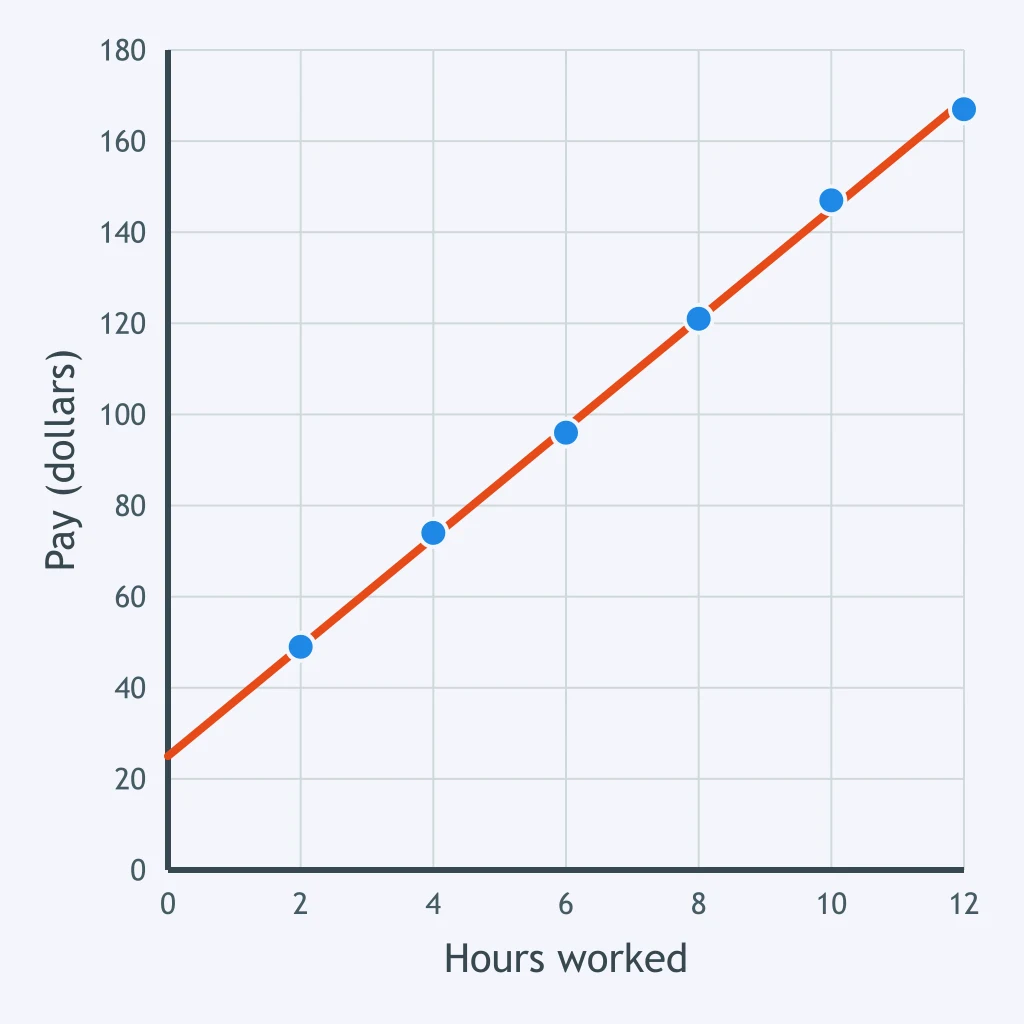
The plotted data for weekend shifts runs from 2 hours to 12 hours. Putting 500 hours into the trend line y = 12x + 25 gives 6025 dollars. What does that show?
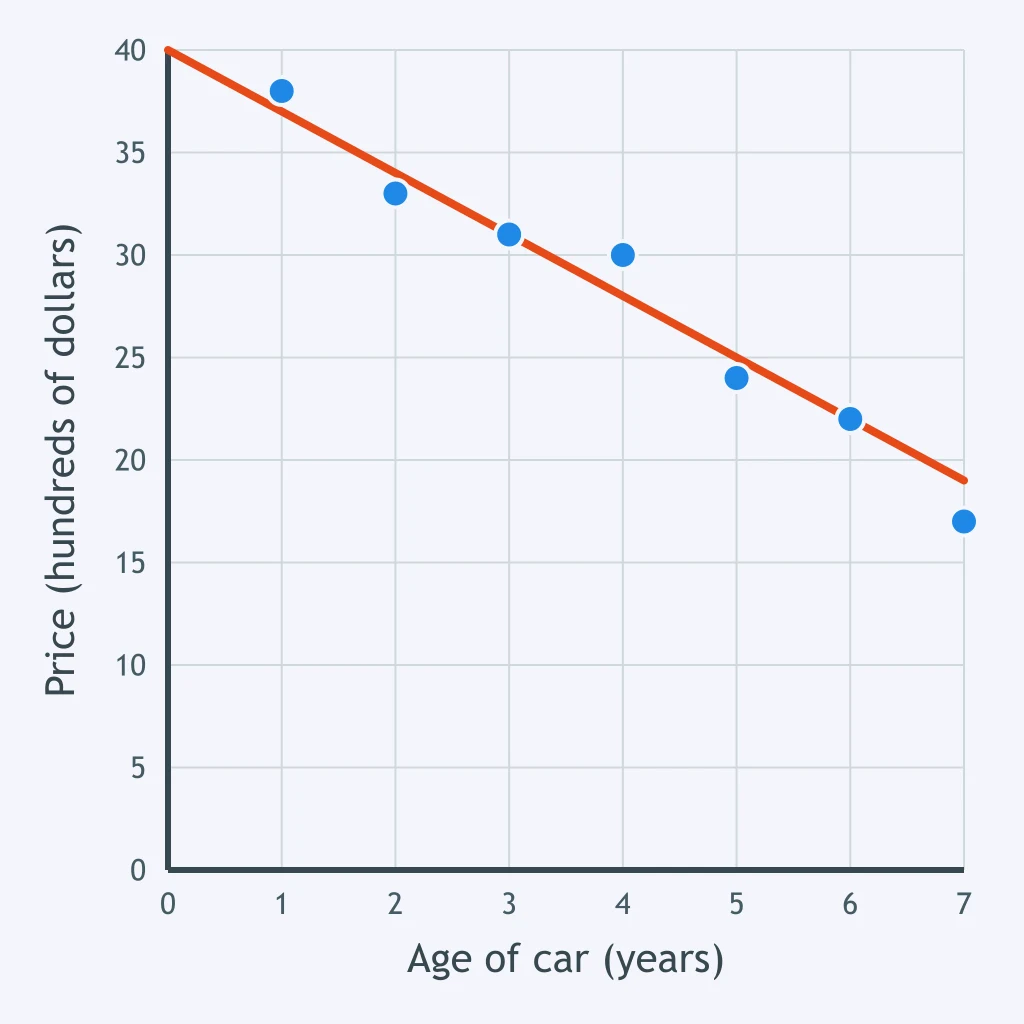
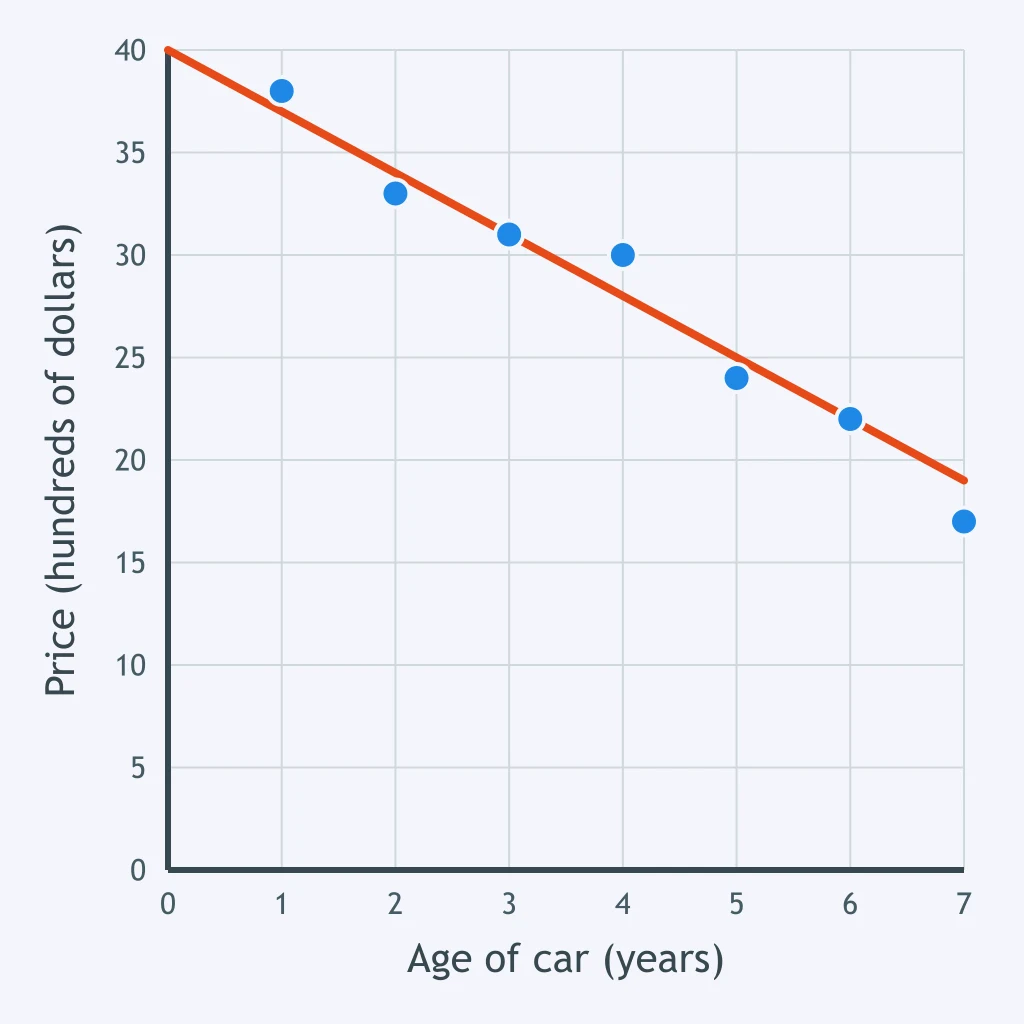
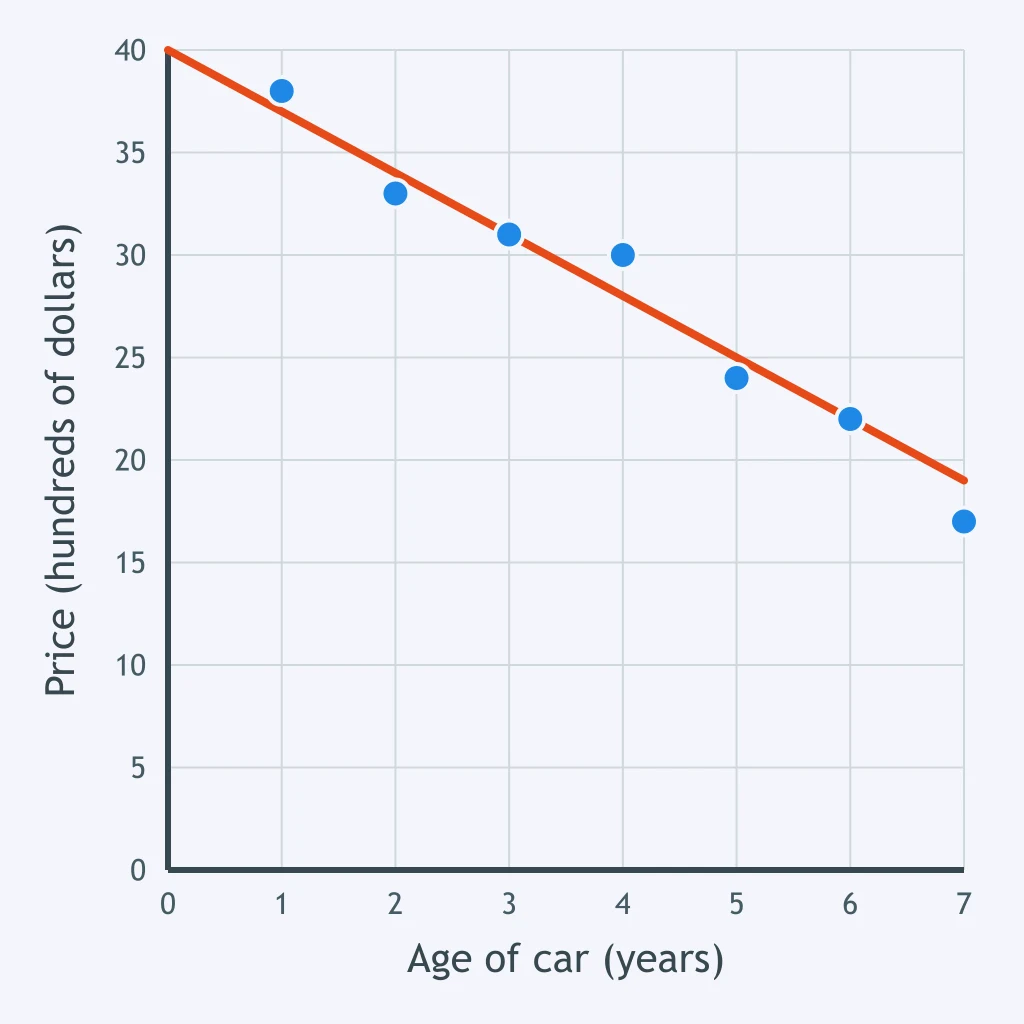
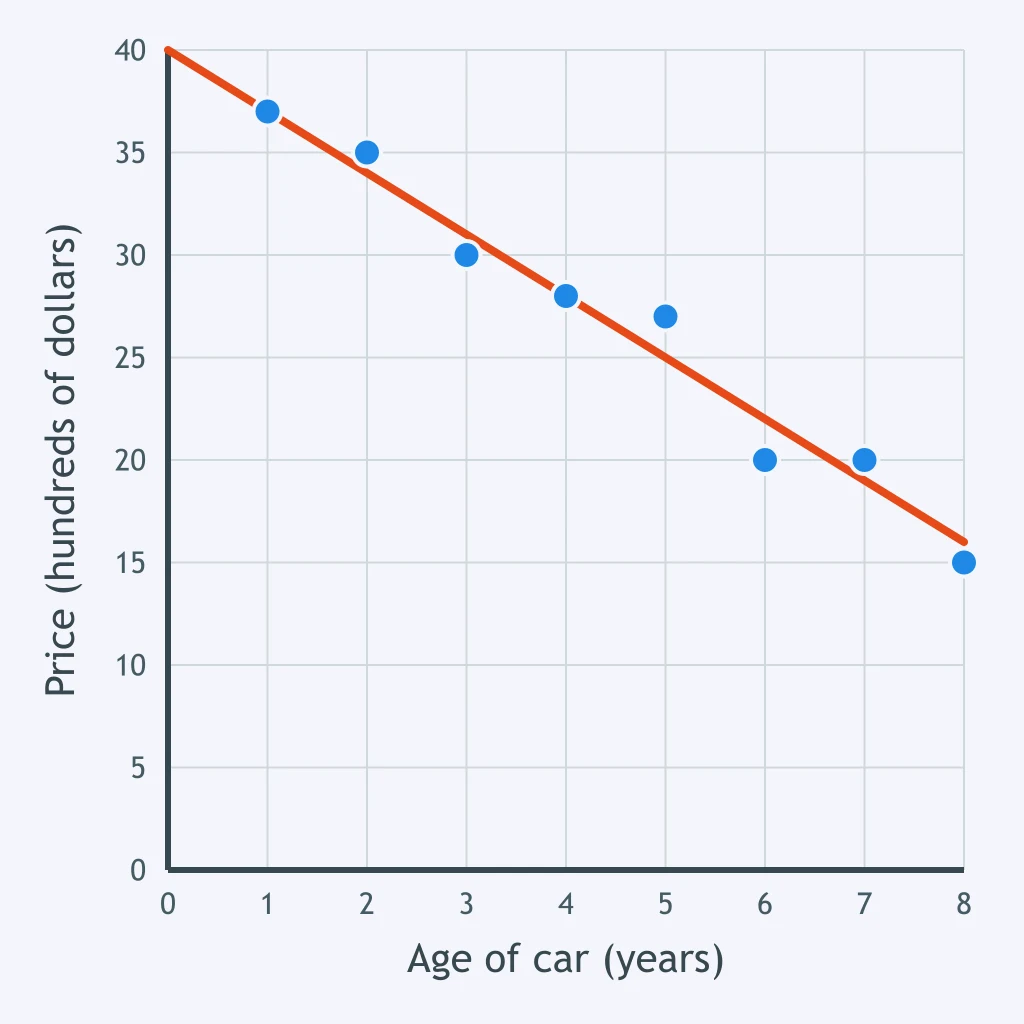
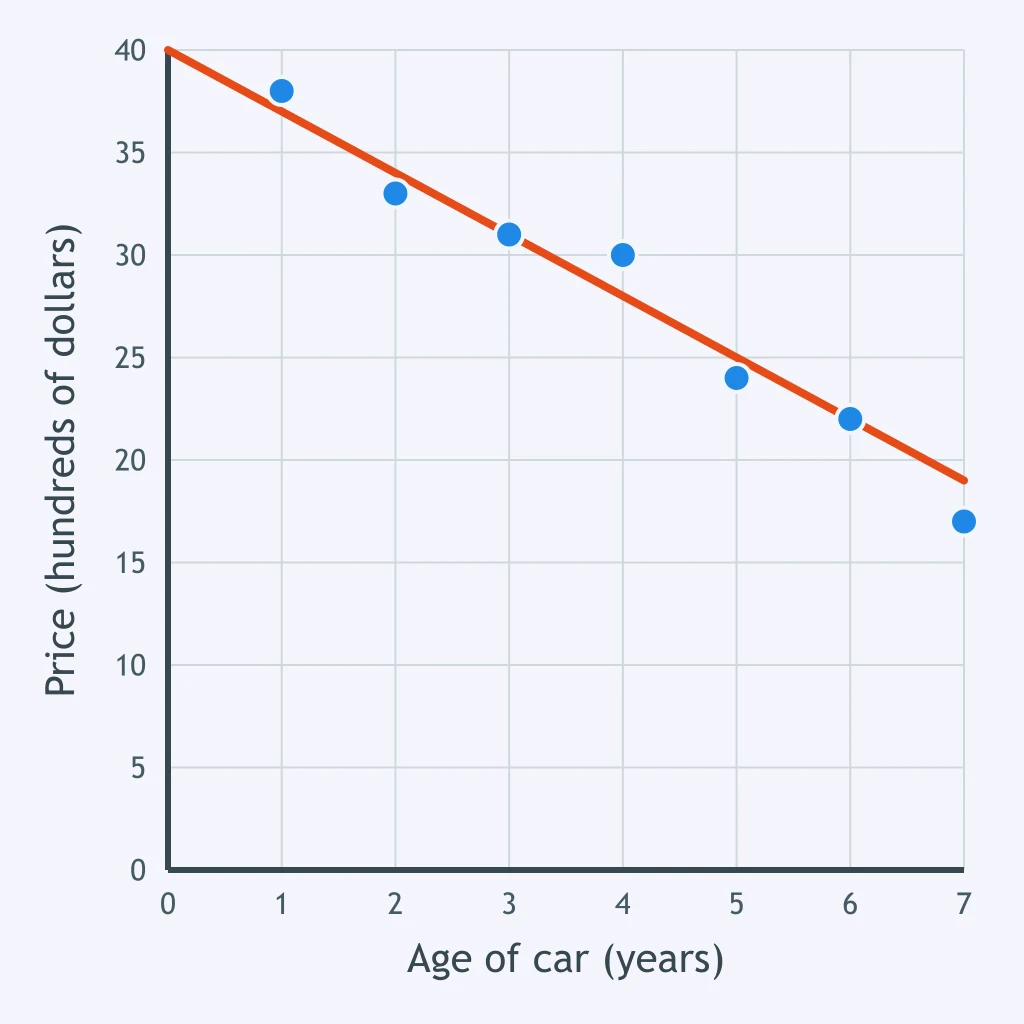
The trend line drawn on the plot is y = -3x + 40. At what age does the line reach a price of 16 hundred dollars?
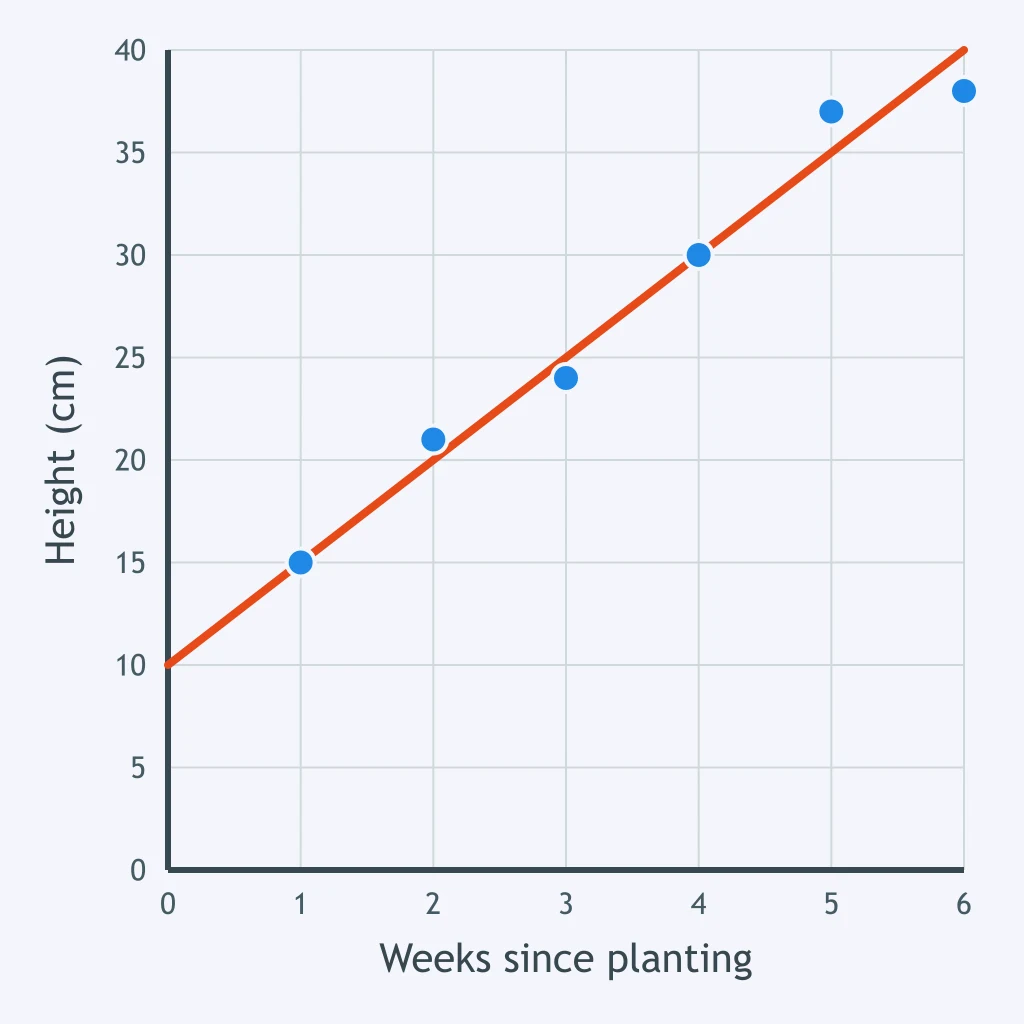
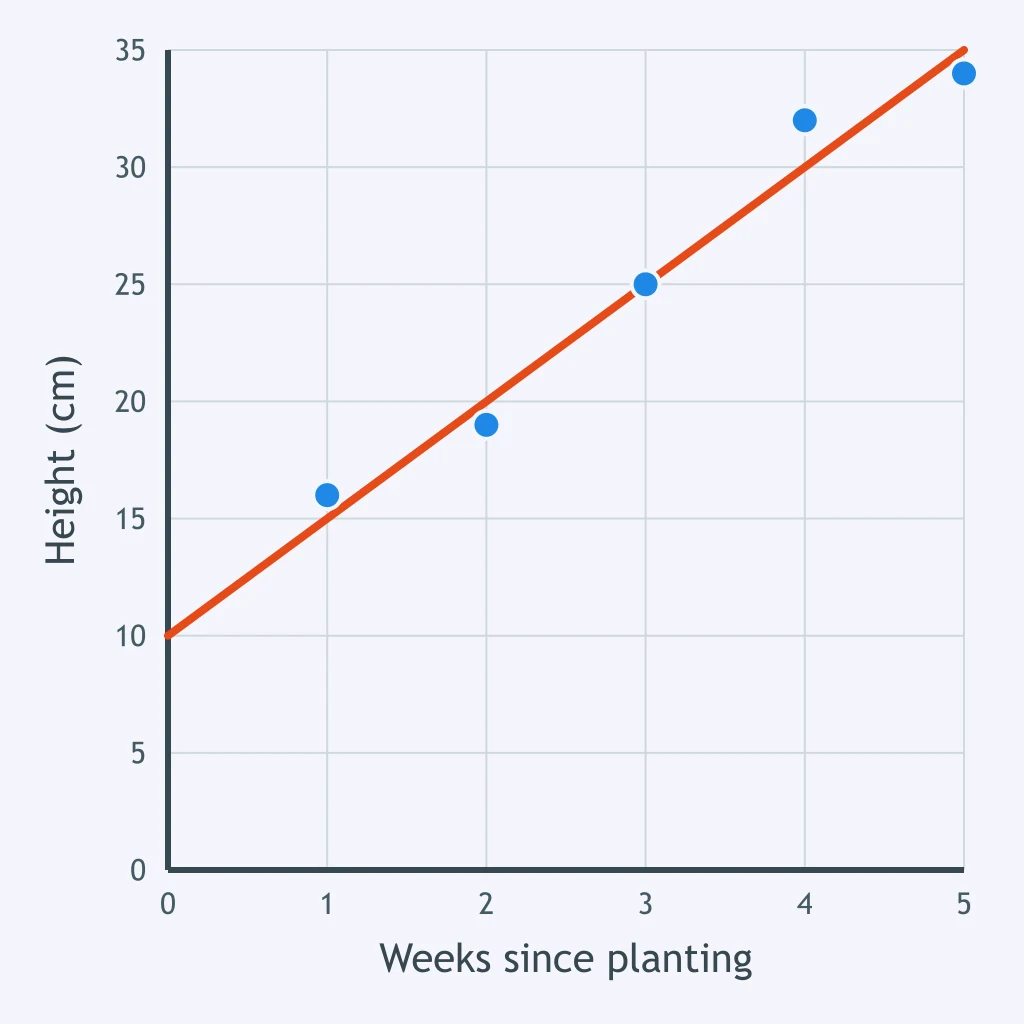
The trend line drawn on the plot is y = 5x + 10. What height does the line predict for the seedling at 3 weeks since planting?
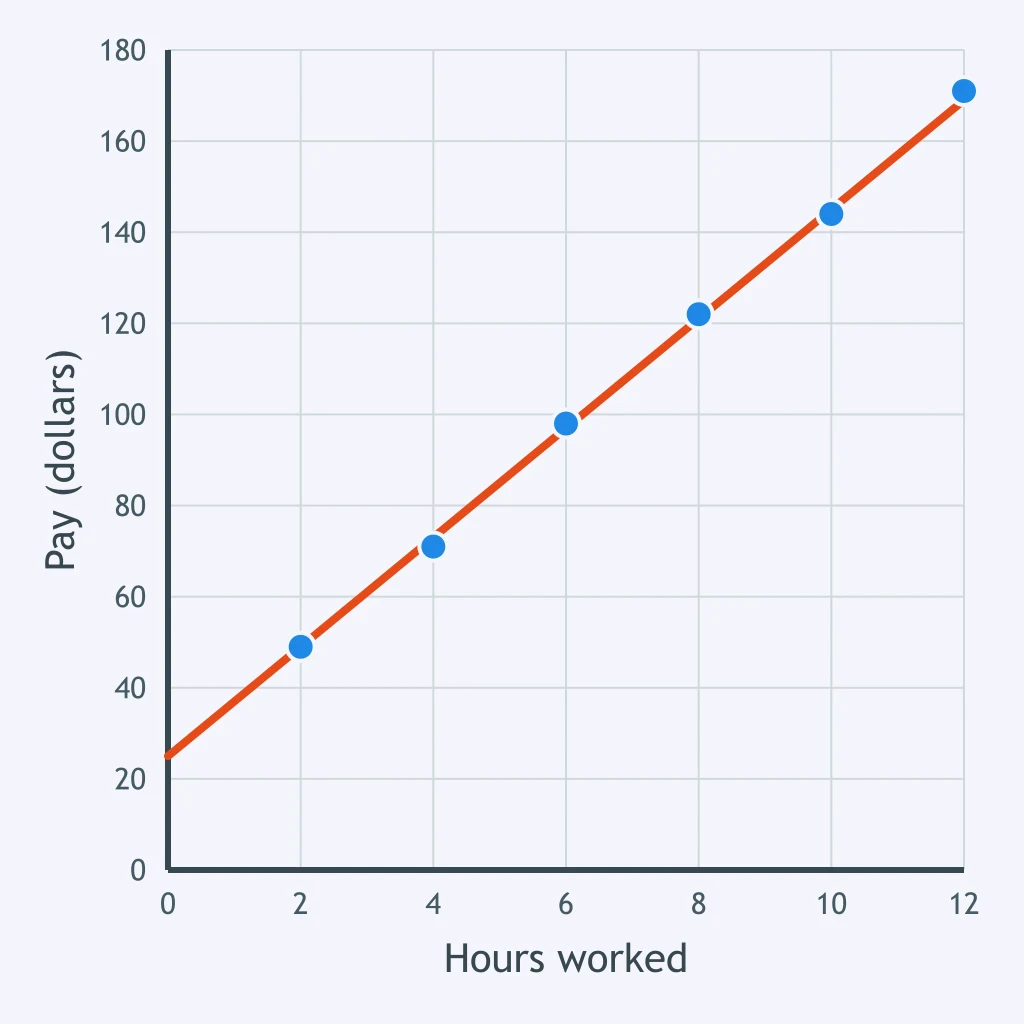
The trend line drawn on the plot is y = 12x + 25. The plot has no reading at 5 hours worked. What pay does the line predict for 5 hours?
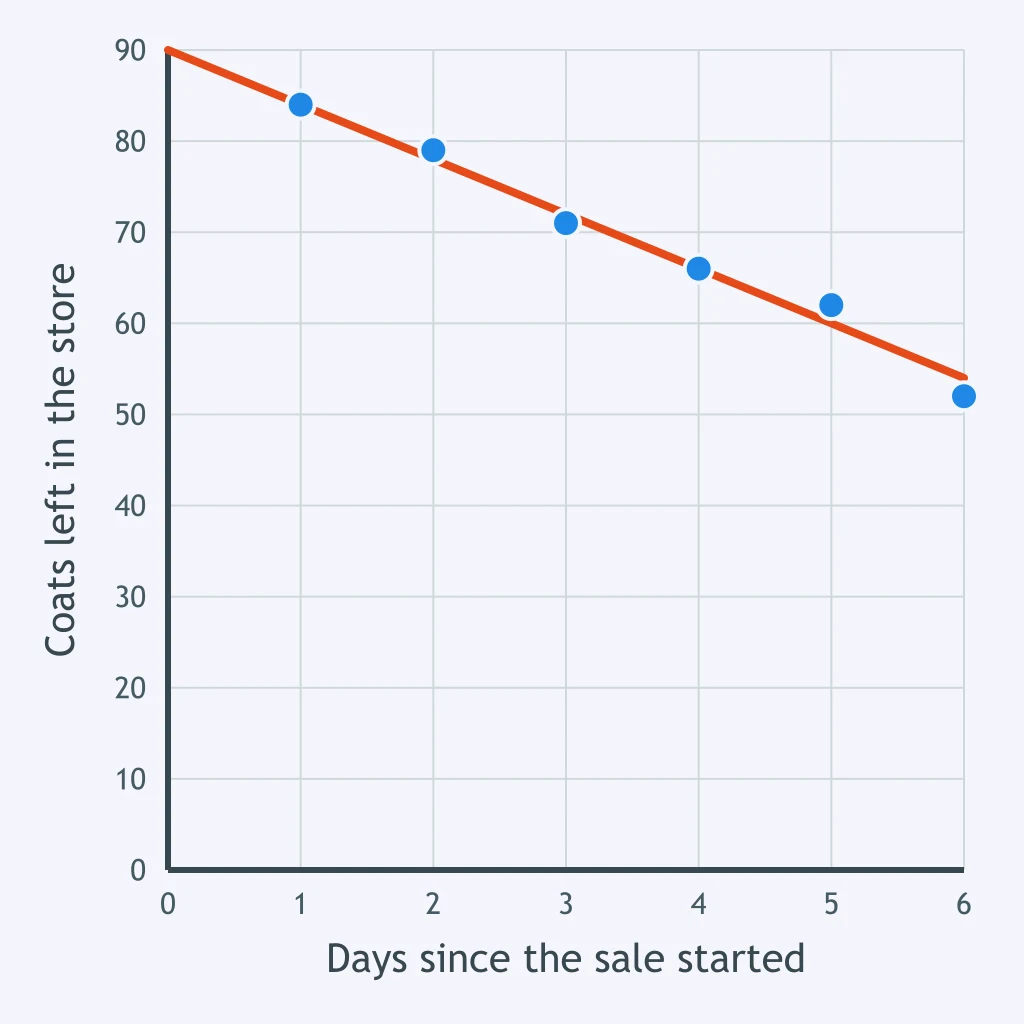
The trend line drawn on the plot is y = -6x + 90. How many coats does the line predict are left in the store 4 days after the sale started?
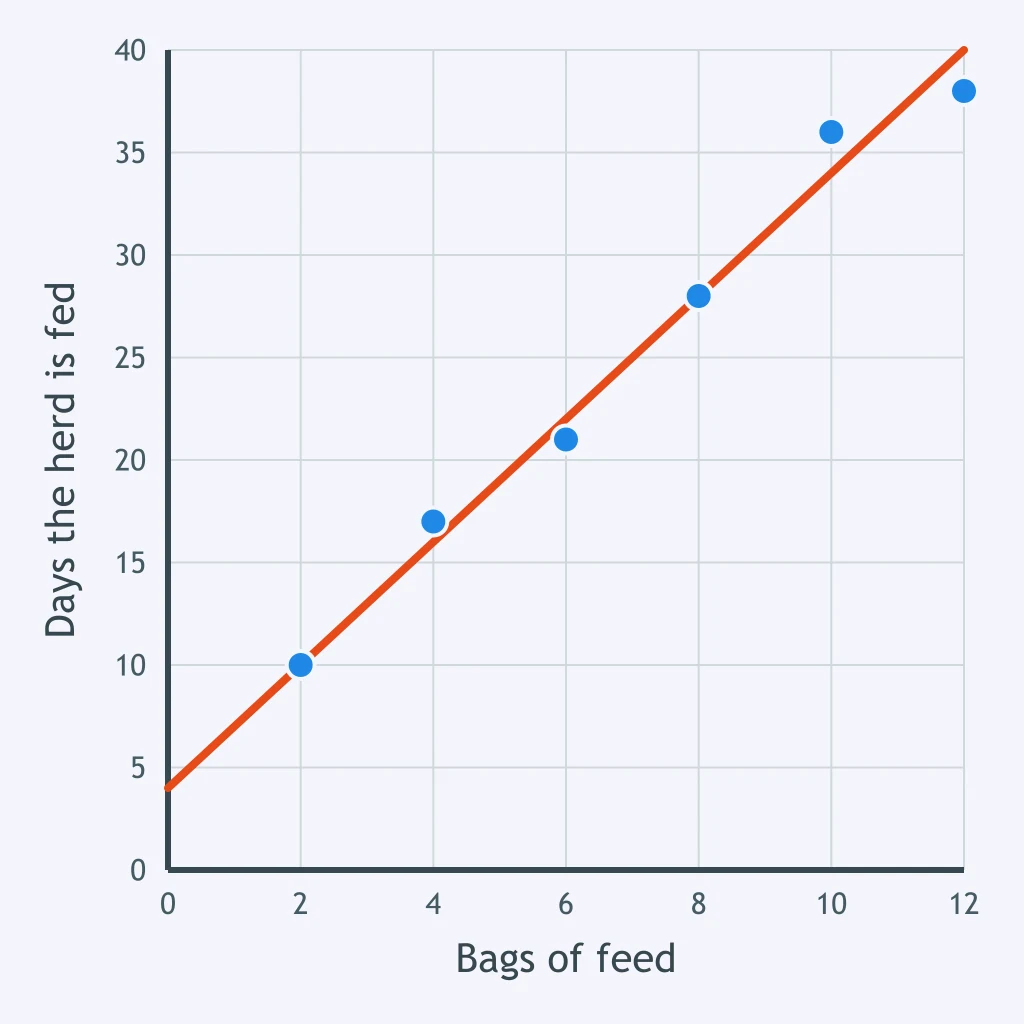
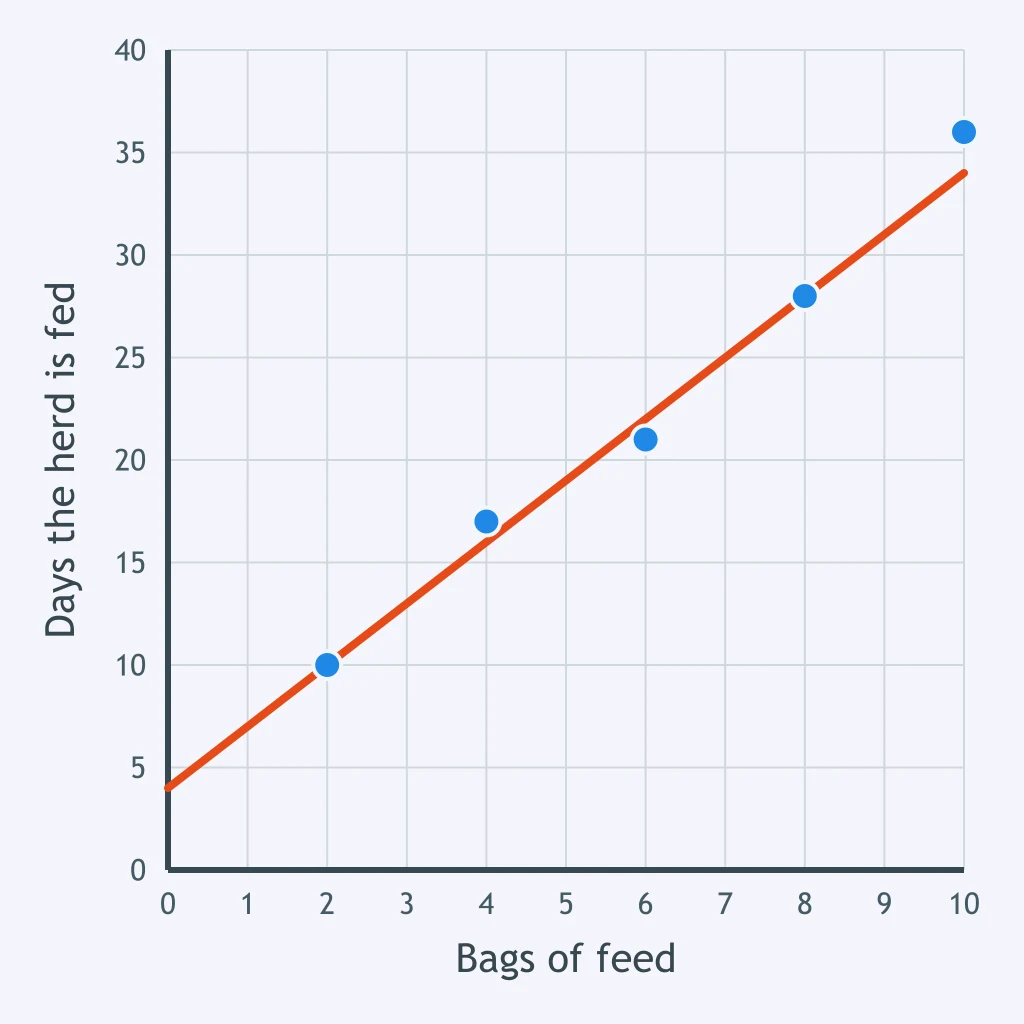
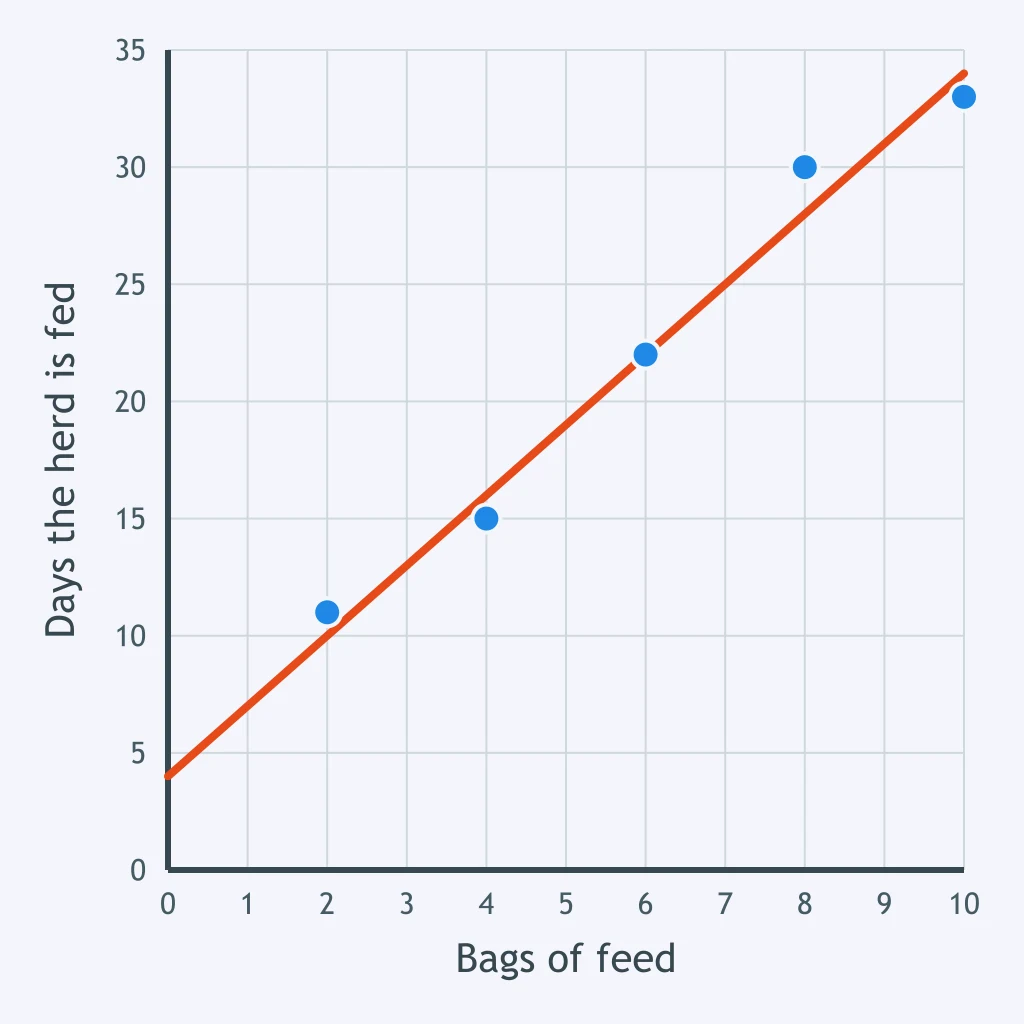
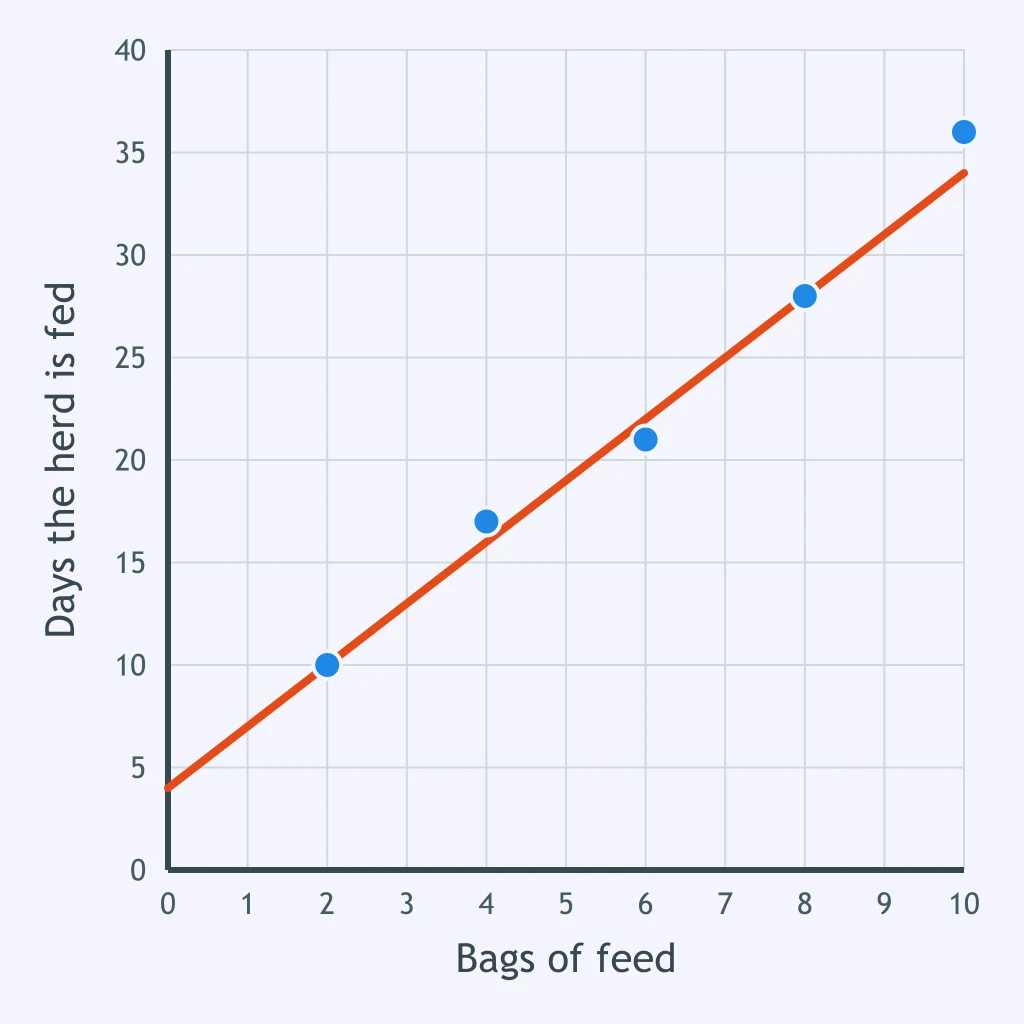
The trend line drawn on the plot is y = 3x + 4. How many days does the line predict the herd is fed with 20 bags of feed, beyond the plotted data?
The plotted data for used cars runs from 1 year to 7 years. Putting 30 years into the trend line y = -3x + 40 gives -50 hundred dollars. What does that show?
The trend line drawn on the plot is y = 4x + 60. What reservoir depth does the line predict after 16 days of rain, beyond the plotted data?
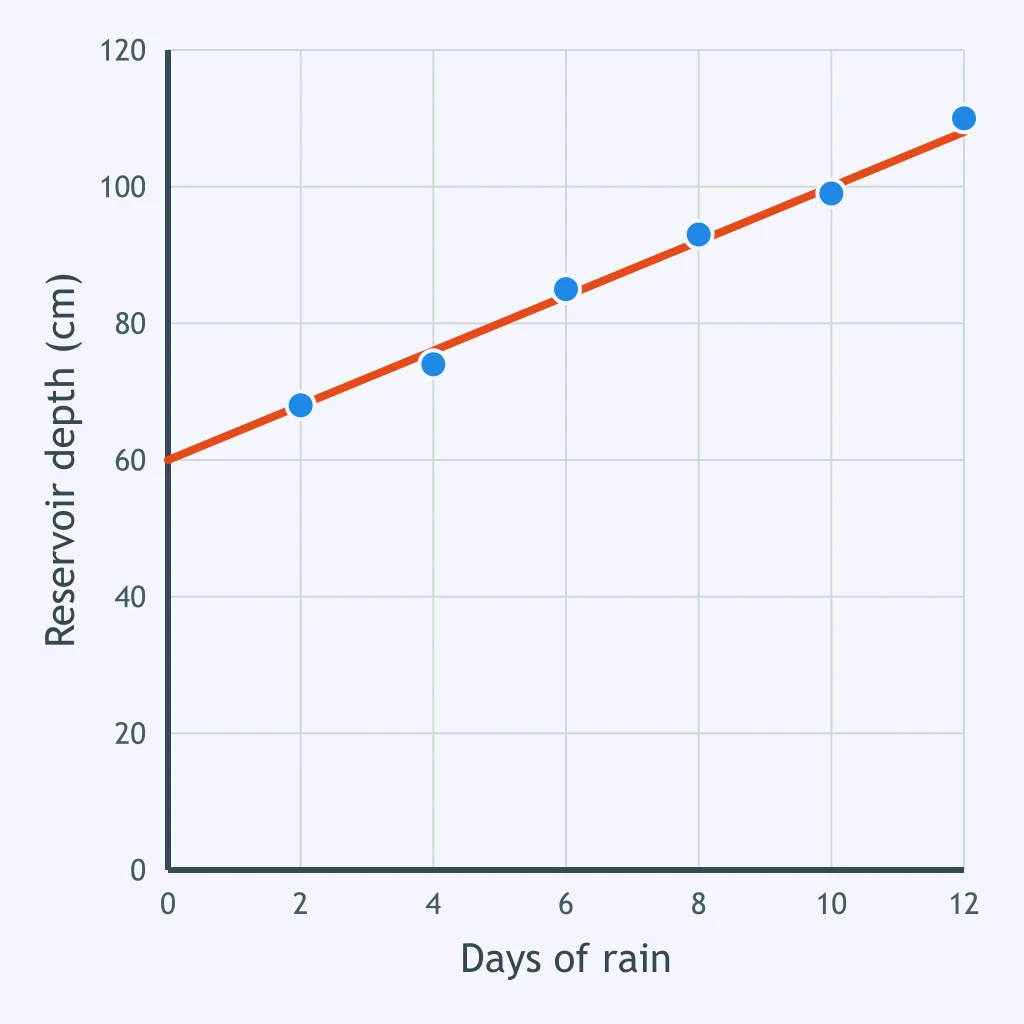
The trend line drawn on the plot is y = -x + 88. The plot has no reading at 21 minutes of exercise a day. What resting pulse does the line predict at 21 minutes?
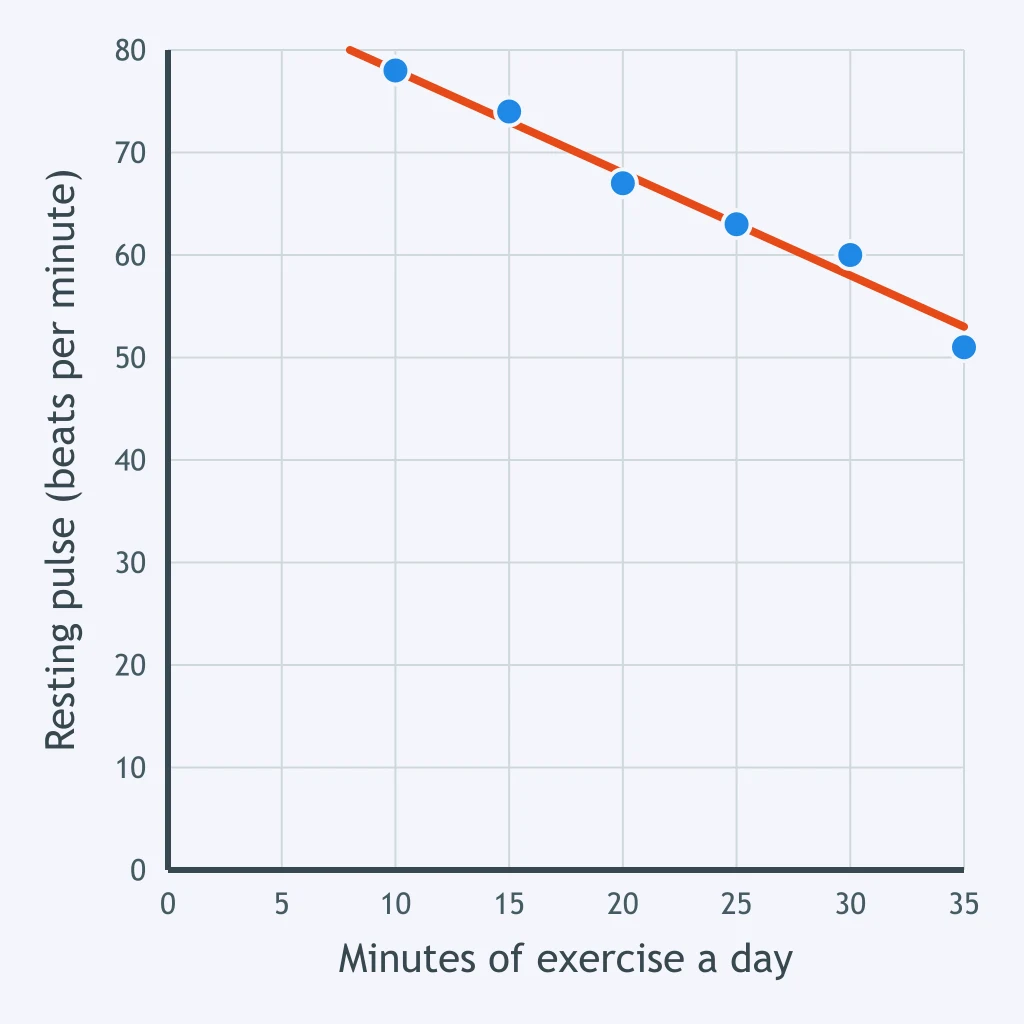
The trend line drawn on the plot is y = 4x + 60. After how many days of rain does the line reach a reservoir depth of 124 cm?
The plotted data for used cars runs from 1 year to 8 years. Putting 30 years into the trend line y = -3x + 40 gives -50 hundred dollars. What does that show?
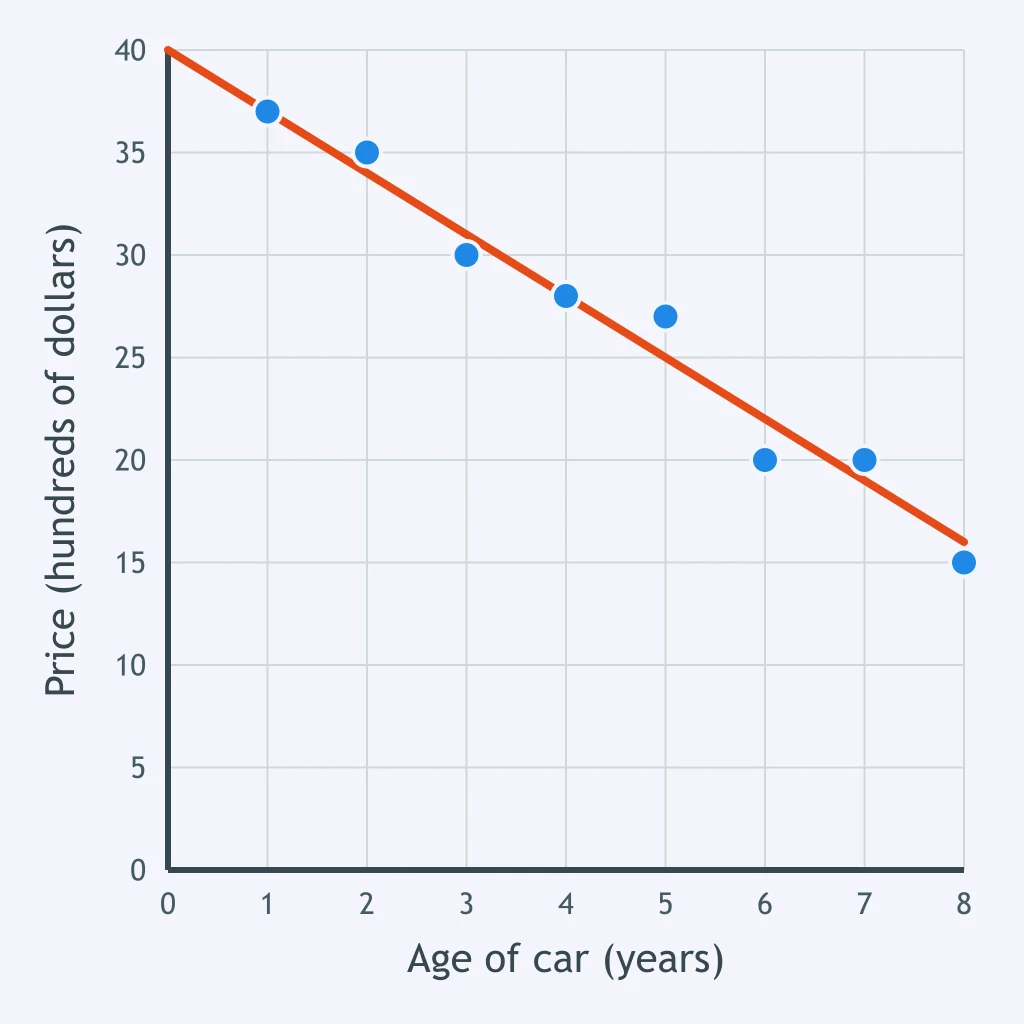
The plotted data for a growing seedling runs from 1 week to 5 weeks. Putting 300 weeks into the trend line y = 5x + 10 gives 1510 cm. What does that show?
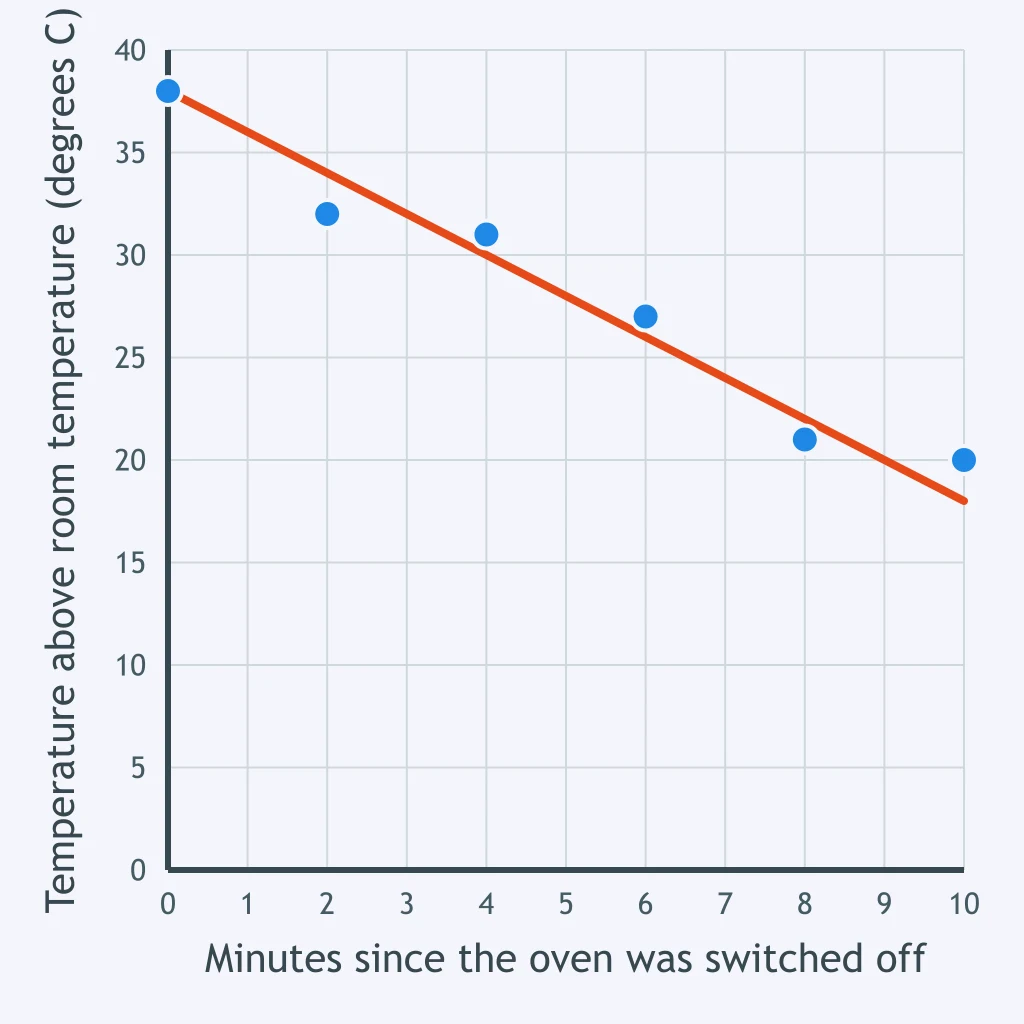
The trend line drawn on the plot is y = -2x + 38. What temperature above room temperature does the line predict 12 minutes after the oven was switched off, beyond the plotted data?
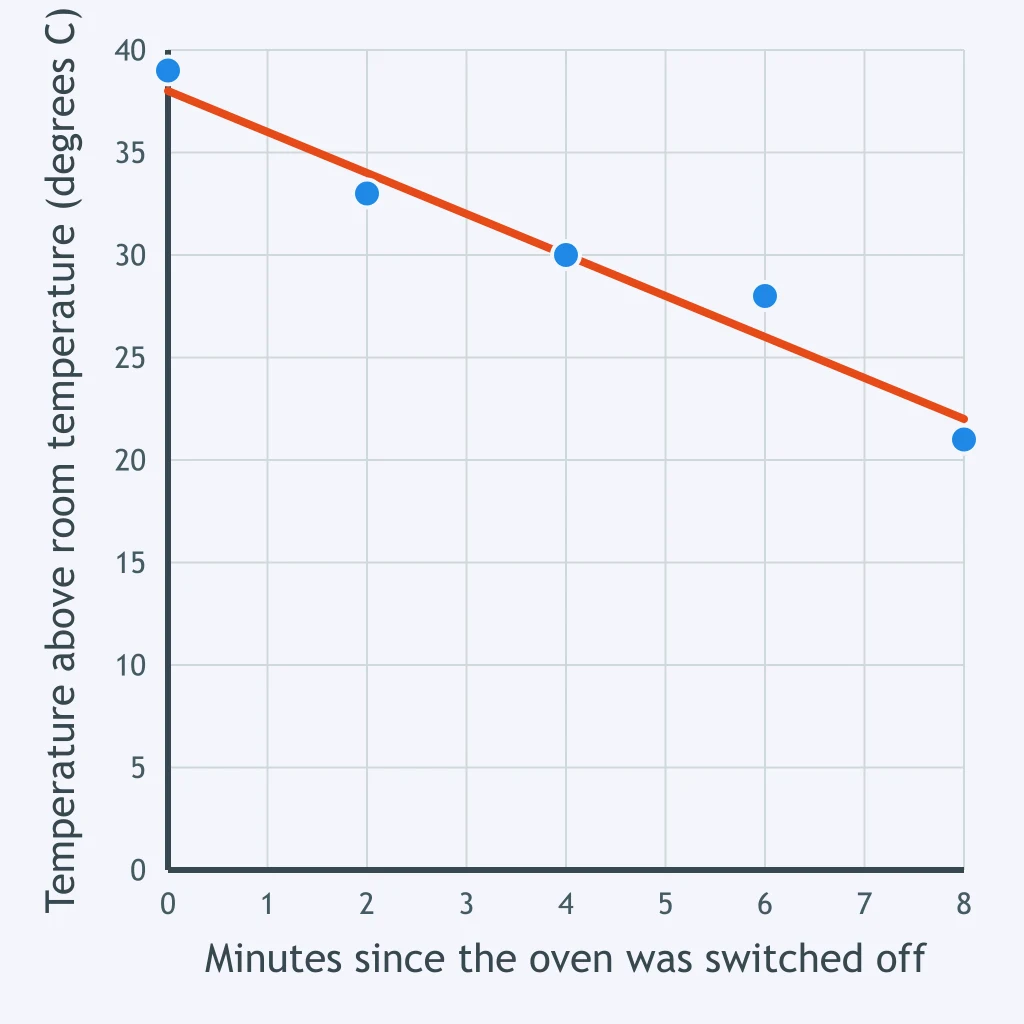
The trend line drawn on the plot is y = -2x + 38. How many minutes after the oven was switched off does the line reach 18 degrees C above room temperature?
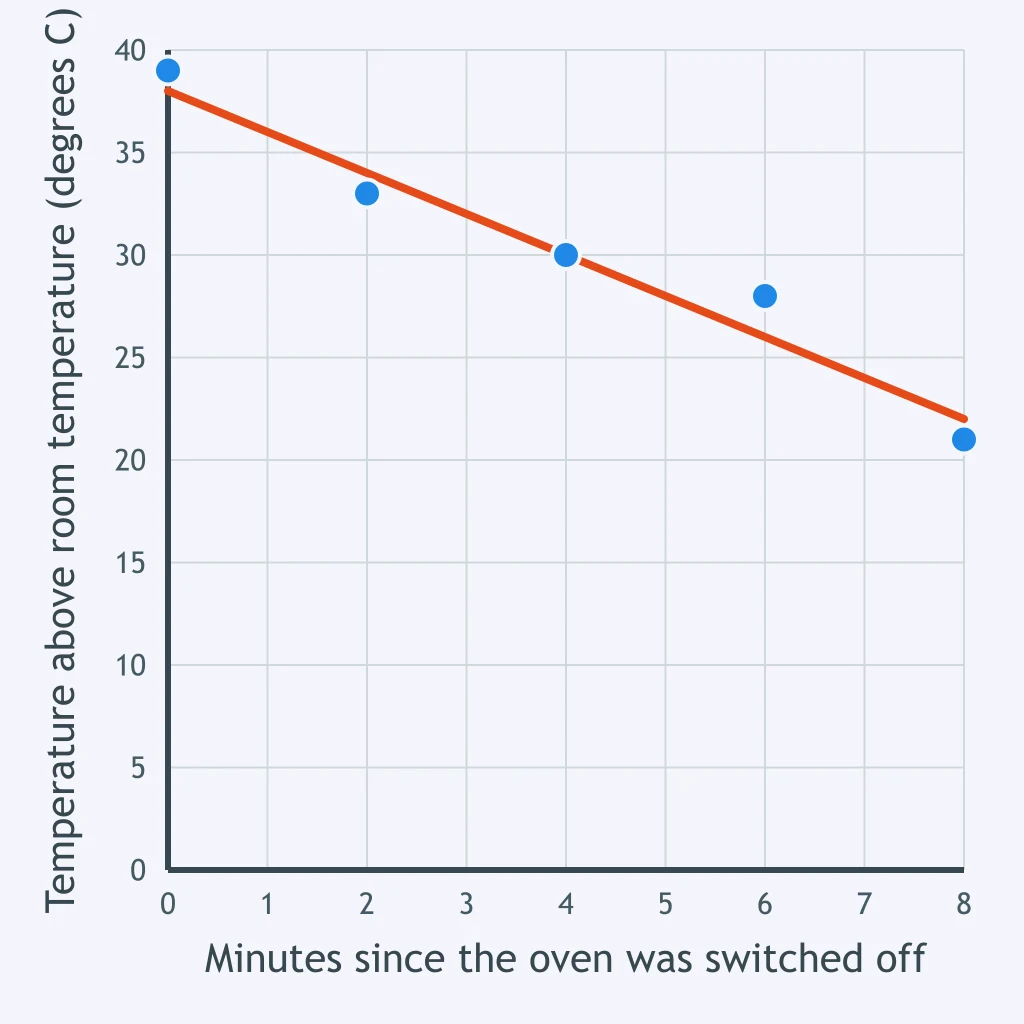
The trend line drawn on the plot is y = -3x + 40. What price does the line predict for a car that is 4 years old?
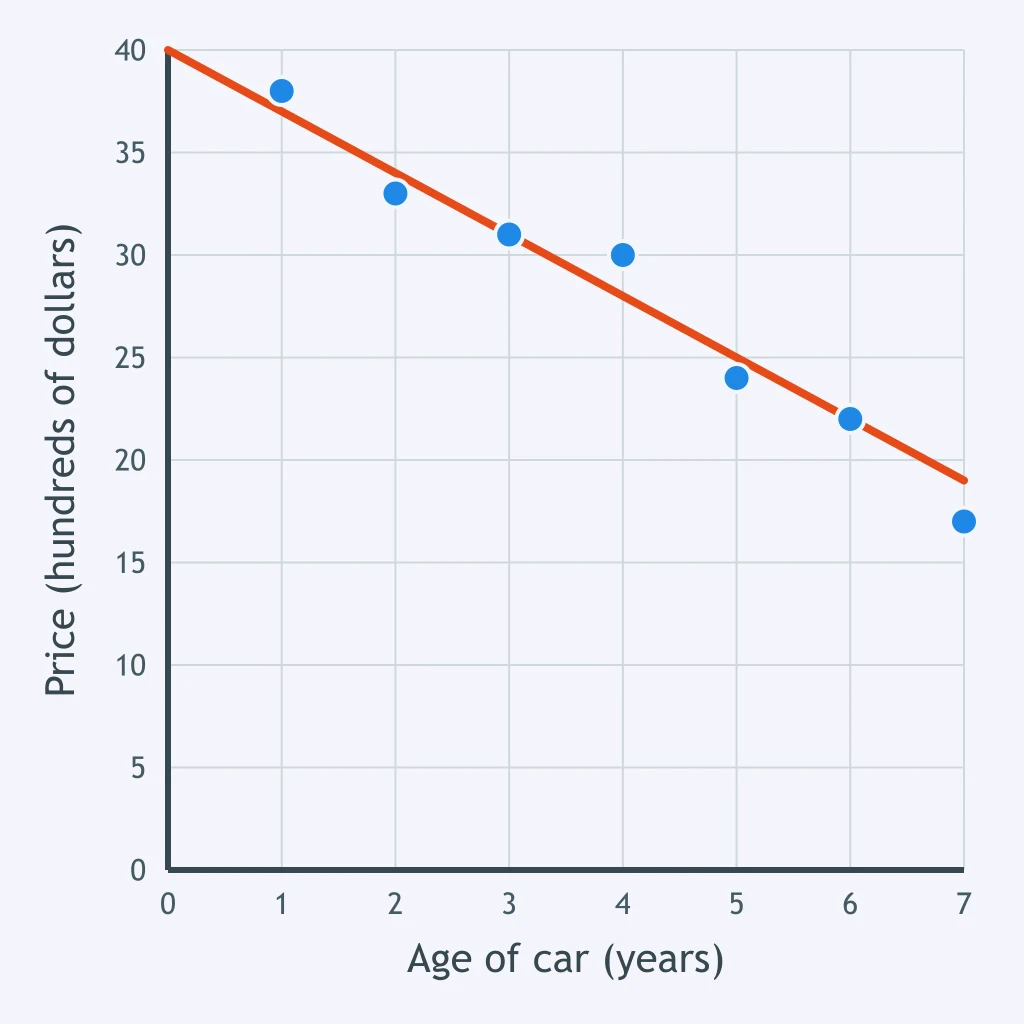
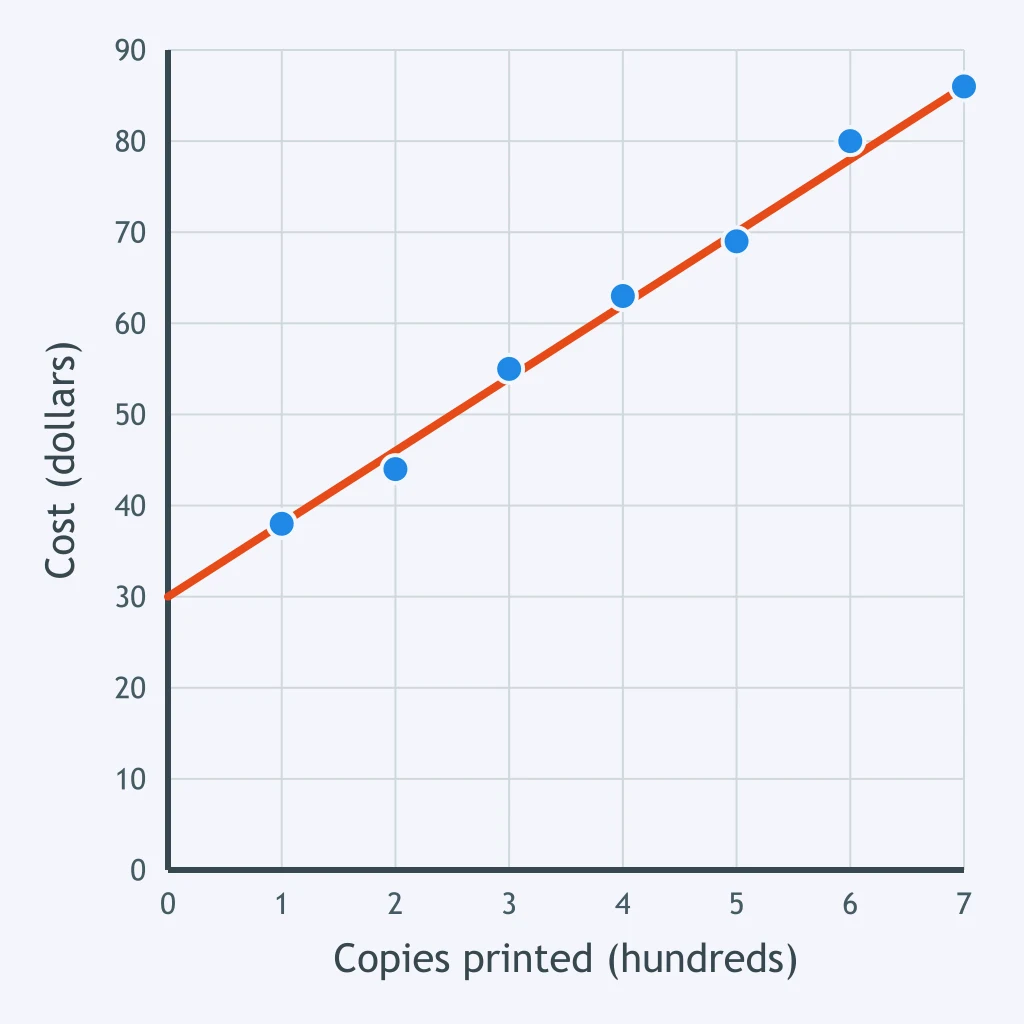
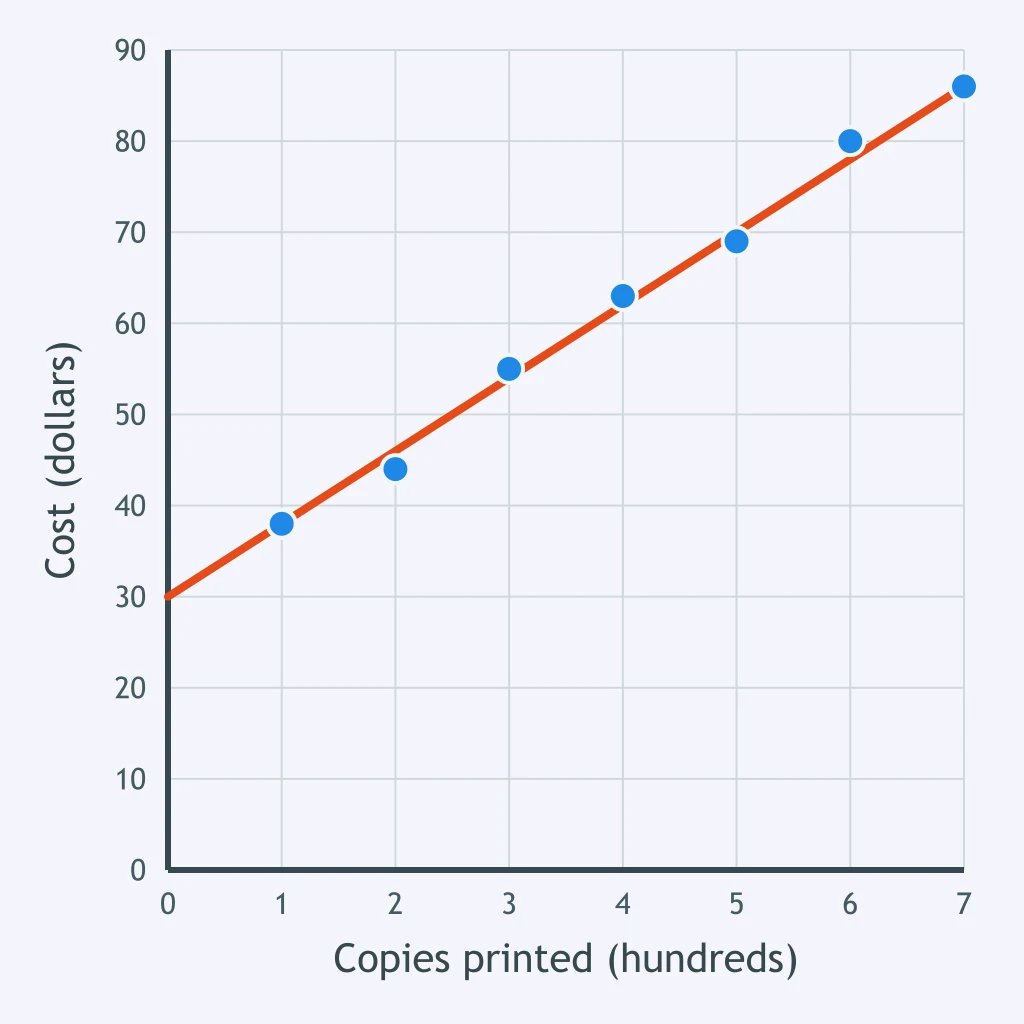
The trend line drawn on the plot is y = 8x + 30. For how many copies printed does the line reach a cost of 102 dollars?
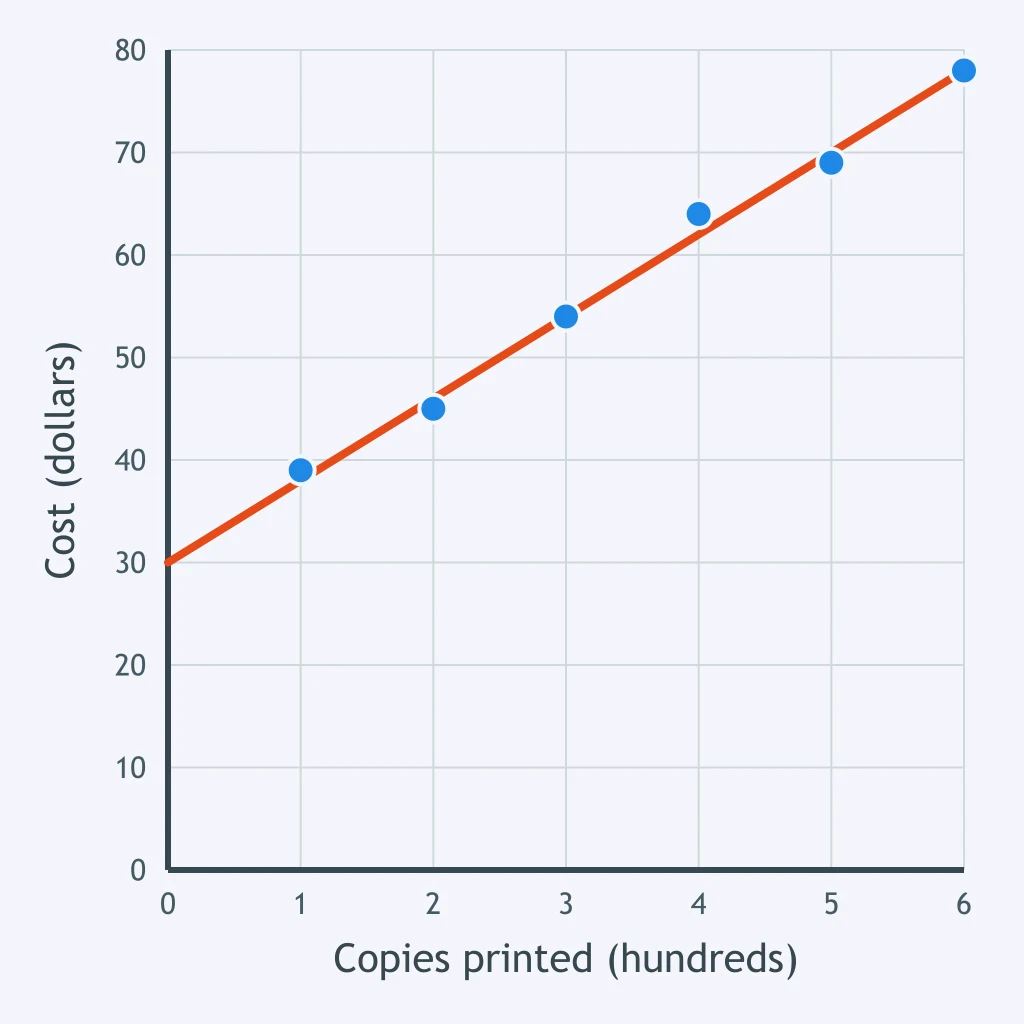
The trend line drawn on the plot is y = 12x + 25. The plot has no reading at 7 hours worked. What pay does the line predict for 7 hours?
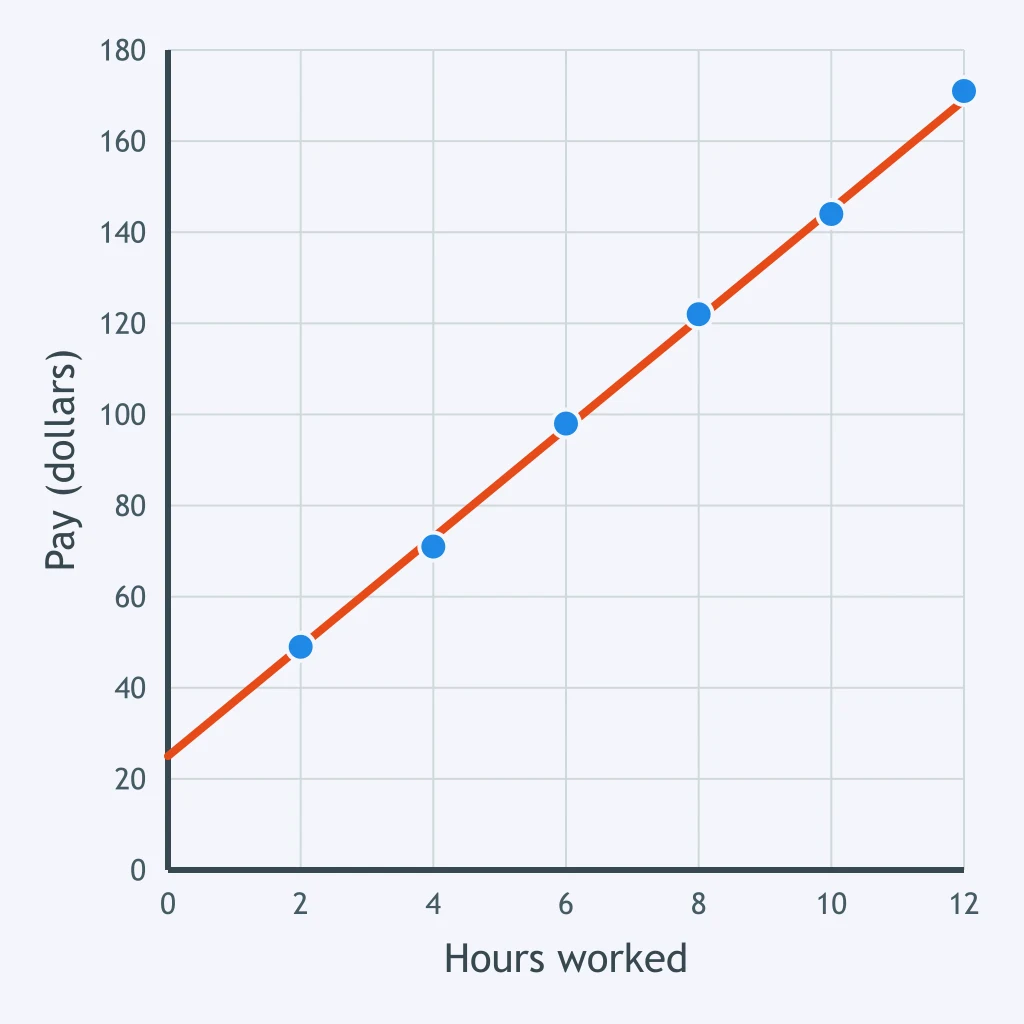
The plotted data for a cooling oven runs from 0 minutes to 10 minutes. Putting 60 minutes into the trend line y = -2x + 38 gives -82 degrees C. What does that show?
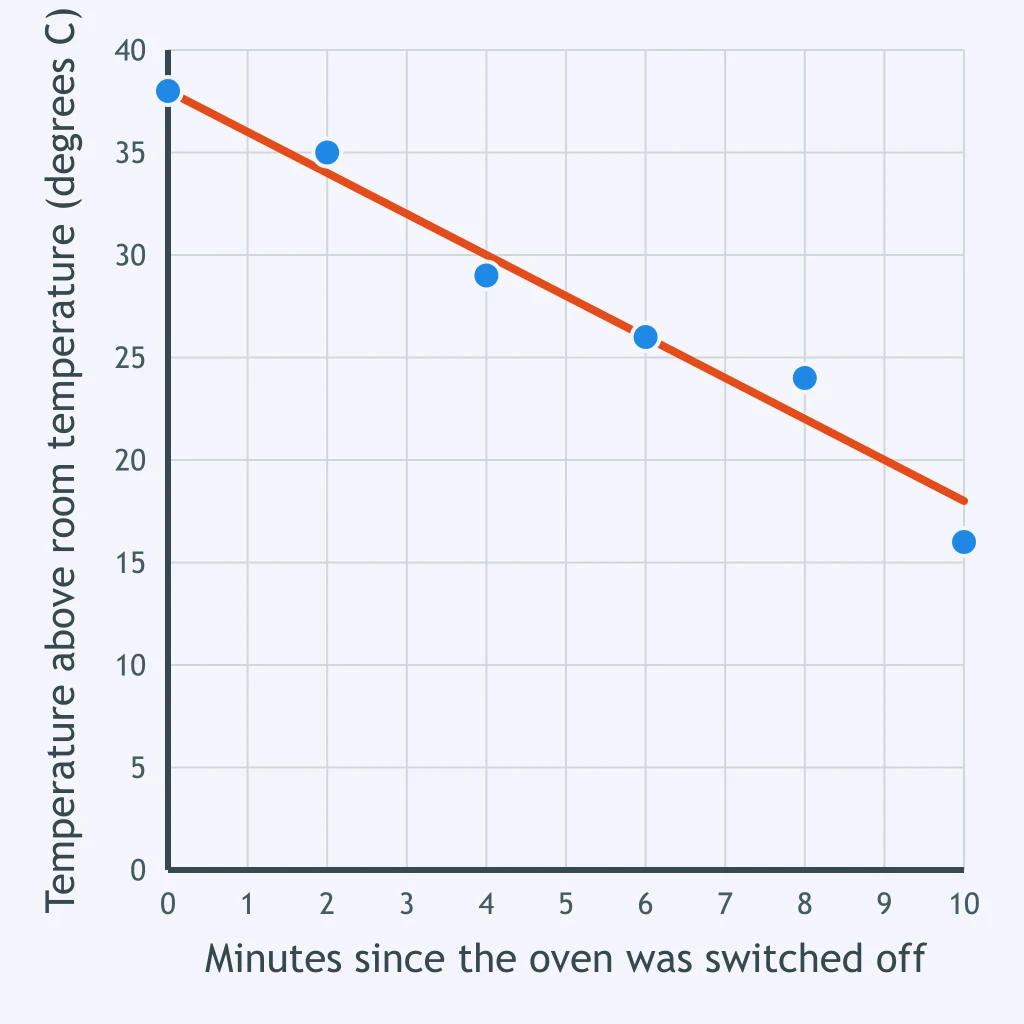
The trend line drawn on the plot is y = -3x + 40. What price does the line predict for a car that is 11 years old, beyond the plotted data?
The trend line drawn on the plot is y = -2x + 38. What temperature above room temperature does the line predict 18 minutes after the oven was switched off, beyond the plotted data?
The trend line drawn on the plot is y = 3x + 19. After how many weeks of training does the line reach 43 push-ups in one minute?
The trend line drawn on the plot is y = 3x + 4. How many bags of feed does the line predict will feed the herd for 40 days?
The trend line drawn on the plot is y = 8x + 30. For how many copies printed does the line reach a cost of 94 dollars?
The trend line drawn on the plot is y = -3x + 40. At what age does the line reach a price of 7 hundred dollars?
The trend line drawn on the plot is y = -2x + 38. What temperature above room temperature does the line predict 14 minutes after the oven was switched off, beyond the plotted data?
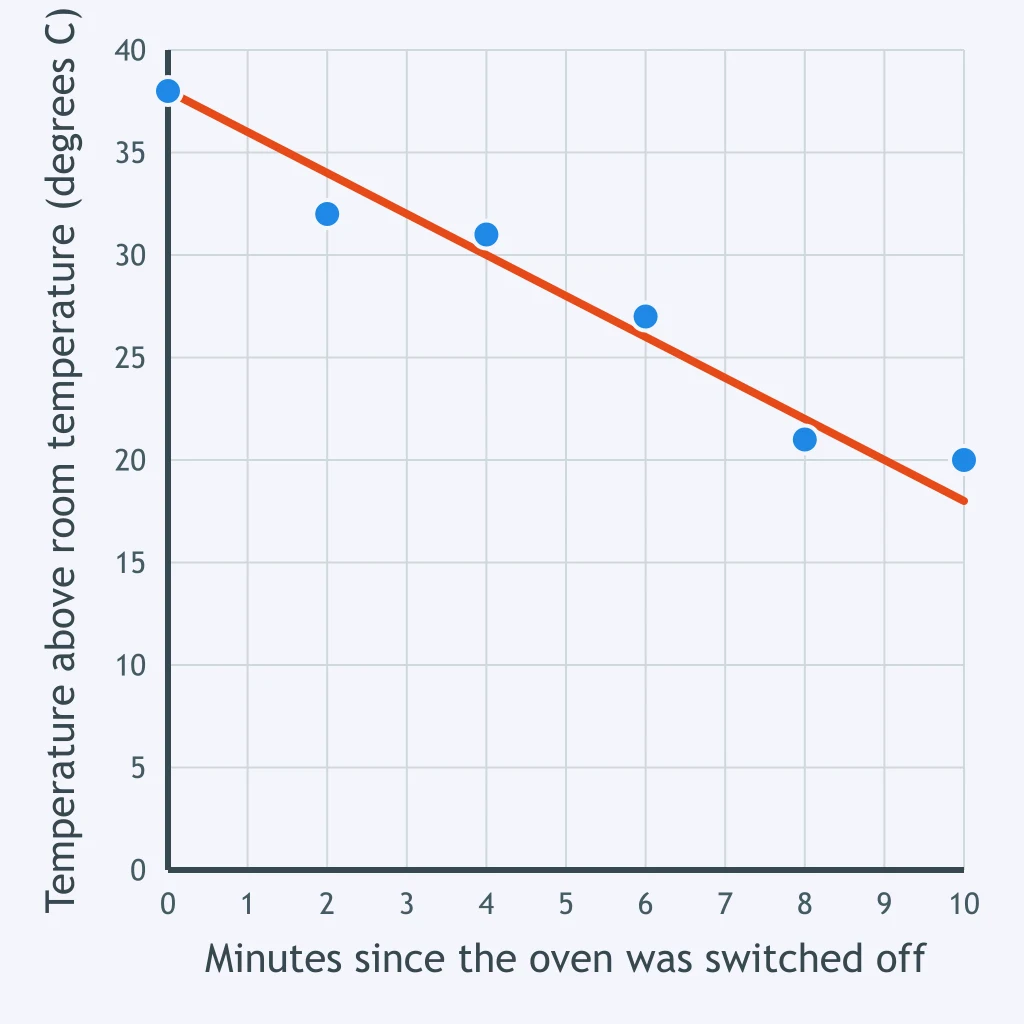
The trend line drawn on the plot is y = -2x + 38. The cooling oven data has no reading at 3 minutes. What temperature above room temperature does the line predict there?
The plotted data for one athlete runs from 1 week to 6 weeks. Putting 200 weeks into the trend line y = 3x + 19 gives 619 push-ups. What does that show?
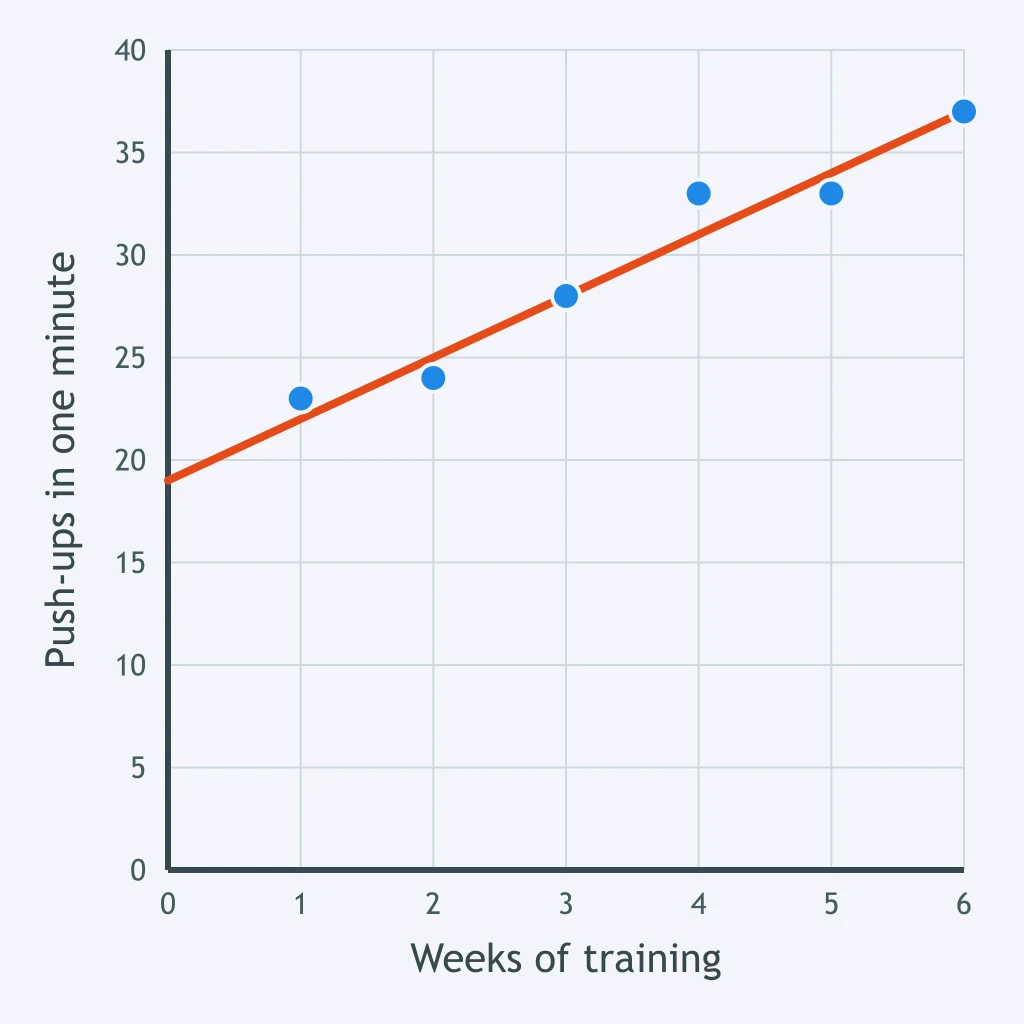
The trend line drawn on the plot is y = 3x + 4. The feed data has no reading at 7 bags. How many days of feeding does the line predict there?
The trend line drawn on the plot is y = -3x + 40. What price does the line predict at 9 years, beyond the used cars data that was plotted?
The trend line drawn on the plot is y = -1x + 88. At what daily exercise does the line reach a resting pulse of 38 beats per minute?
The trend line drawn on the plot is y = 3x + 19. What push-up count does the line predict at 8 weeks, beyond the athlete's data that was plotted?
The trend line drawn on the plot is y = 12x + 25. At what hours worked does the line reach a pay of 241 dollars?
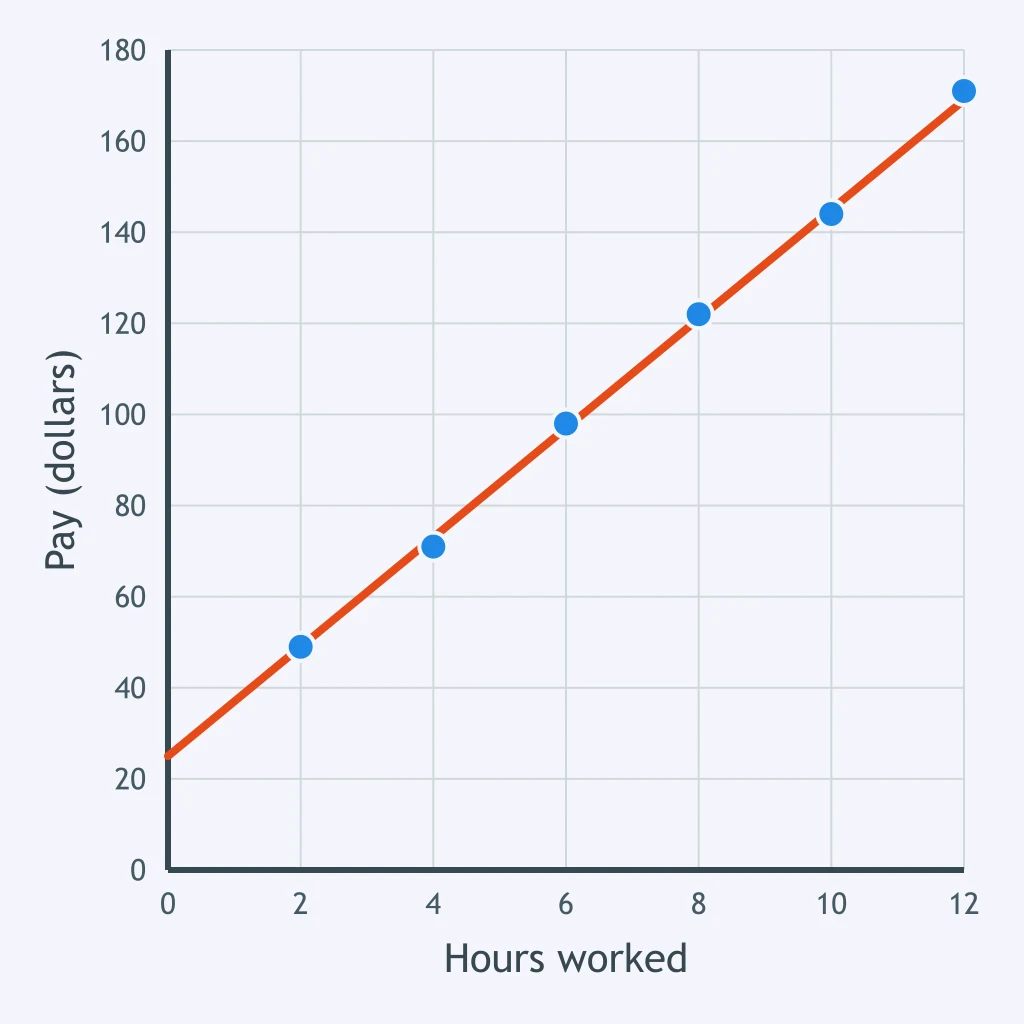
The trend line drawn on the plot is y = 3x + 4. The feed data has no reading at 7 bags. How many days of feeding does the line predict there?
The trend line drawn on the plot is y = 8x + 30. What cost does the line predict at 9 hundred copies, beyond the print runs data that was plotted?
Crack the passcode before the zombies get in.
Answer, then swat bugs for bonus points.
Race through questions at your own speed.
Same question on every screen. Fastest wins.

Pick a tile, answer, hit bonuses and steals.
Writing the Equation of a Trend Line
20 questions