Loading
by BlastRoom
Practice reading data visualizations and selecting charts that fit a data set.
#computer_science

25 questions
One question set, multiple game modes. Tap any game to see it in action. Not sure which to pick?
Answer to place stones and capture territory.
Outrun the snow together.
Earn blasts, then hunt the other team.
Answer to earn energy, then climb.

The class blasts through walls together.
Bid on mystery lots. Most money wins.
Sell tours. Nice, standard, or a total scam.

Answer, restock, and serve the rush.
More correct answers pulls the rope your way.
Answer, then shoot down the alien wave.
Answer, then tap to leap the frozen ridge.
The bar graph shows how many students chose each computer science project topic. How many chose Robotics?

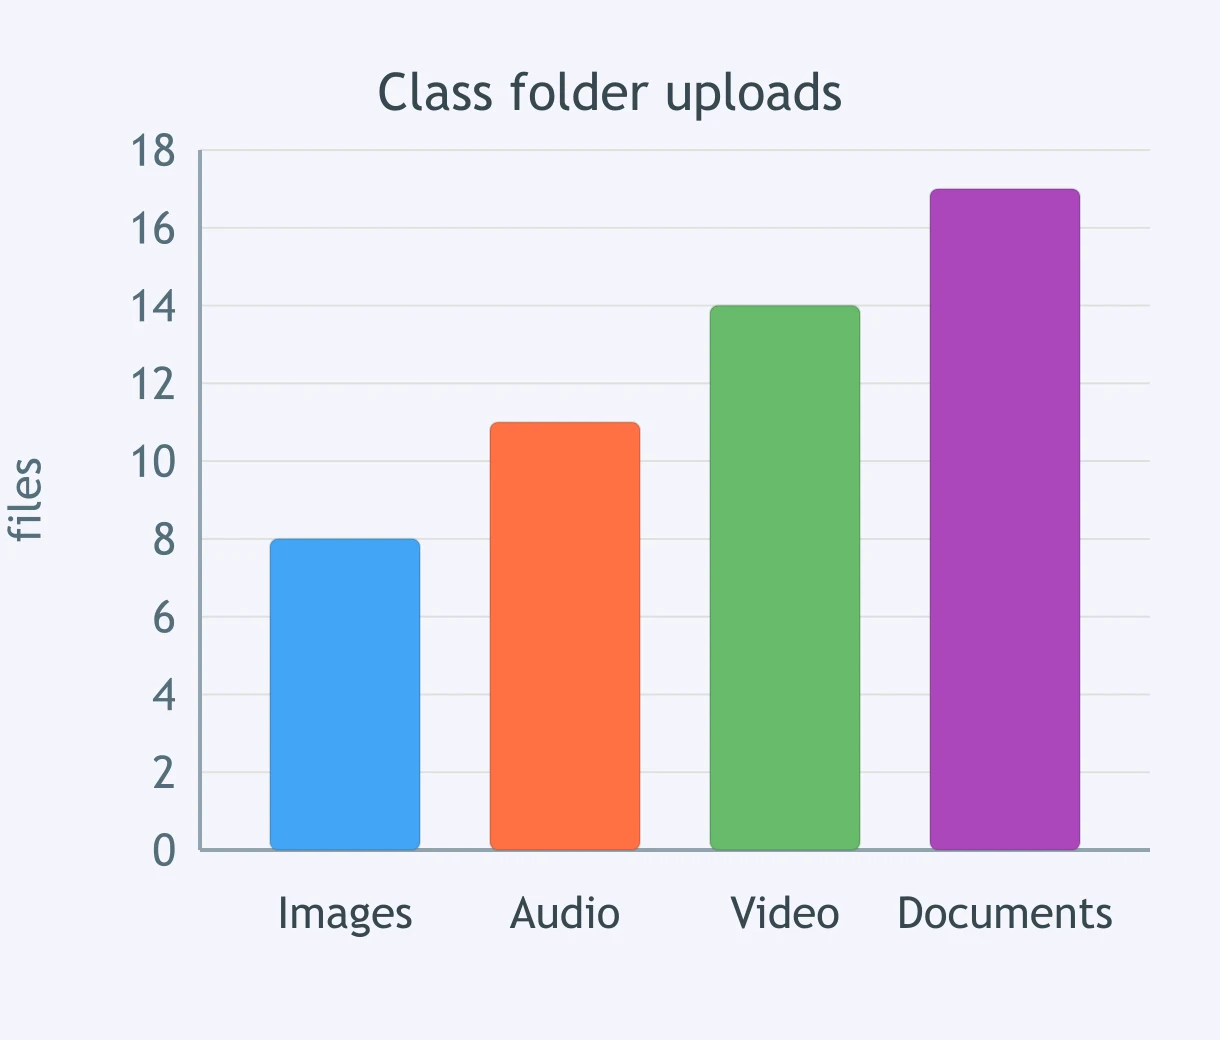
Use the bar graph of files submitted to each class folder. How many files are in the Video folder?
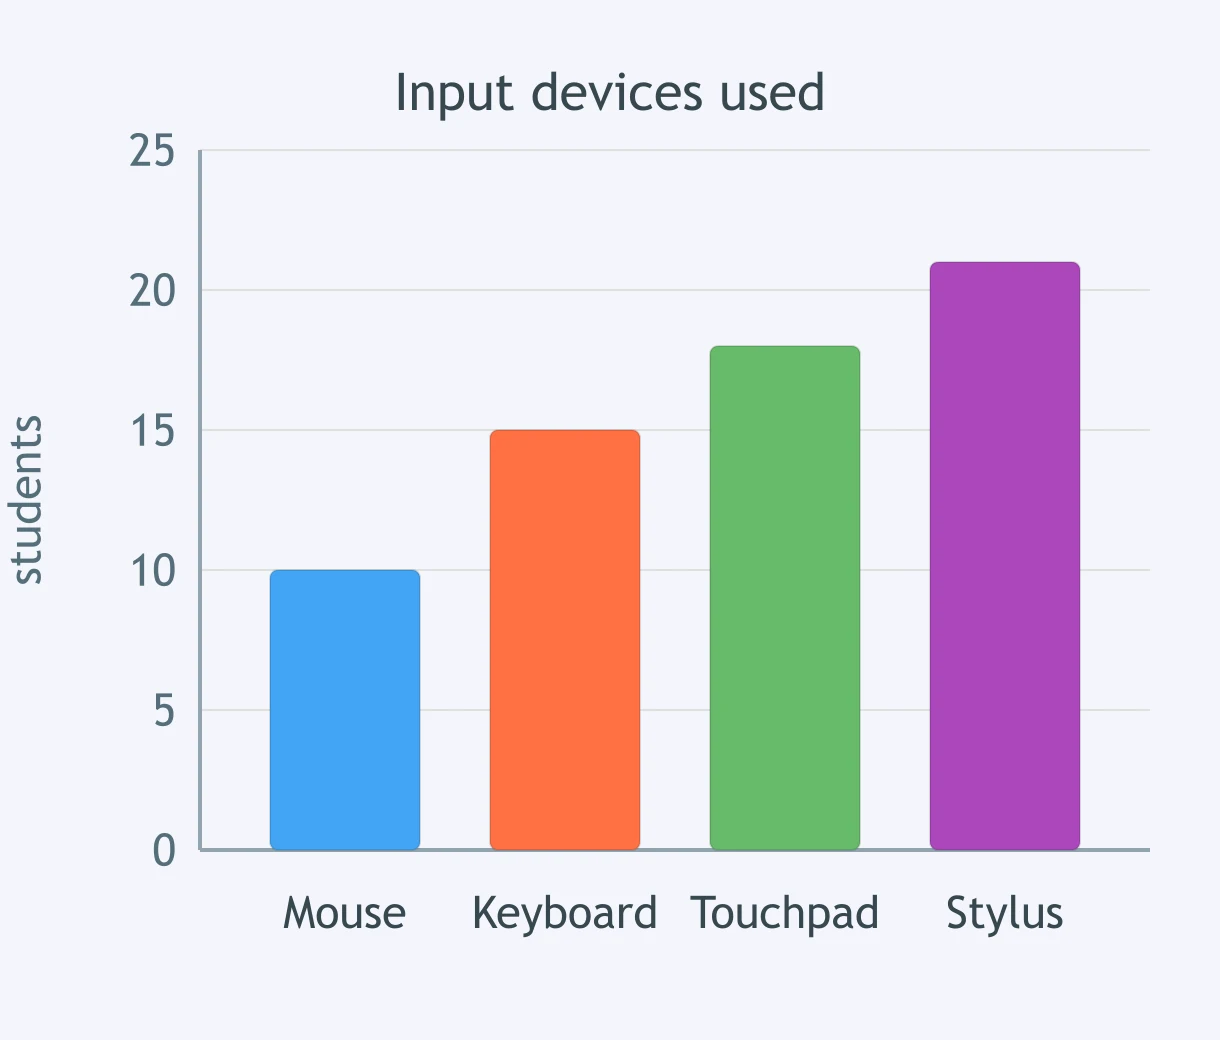
The graph shows the number of students using each input device. What value is shown for Touchpad?
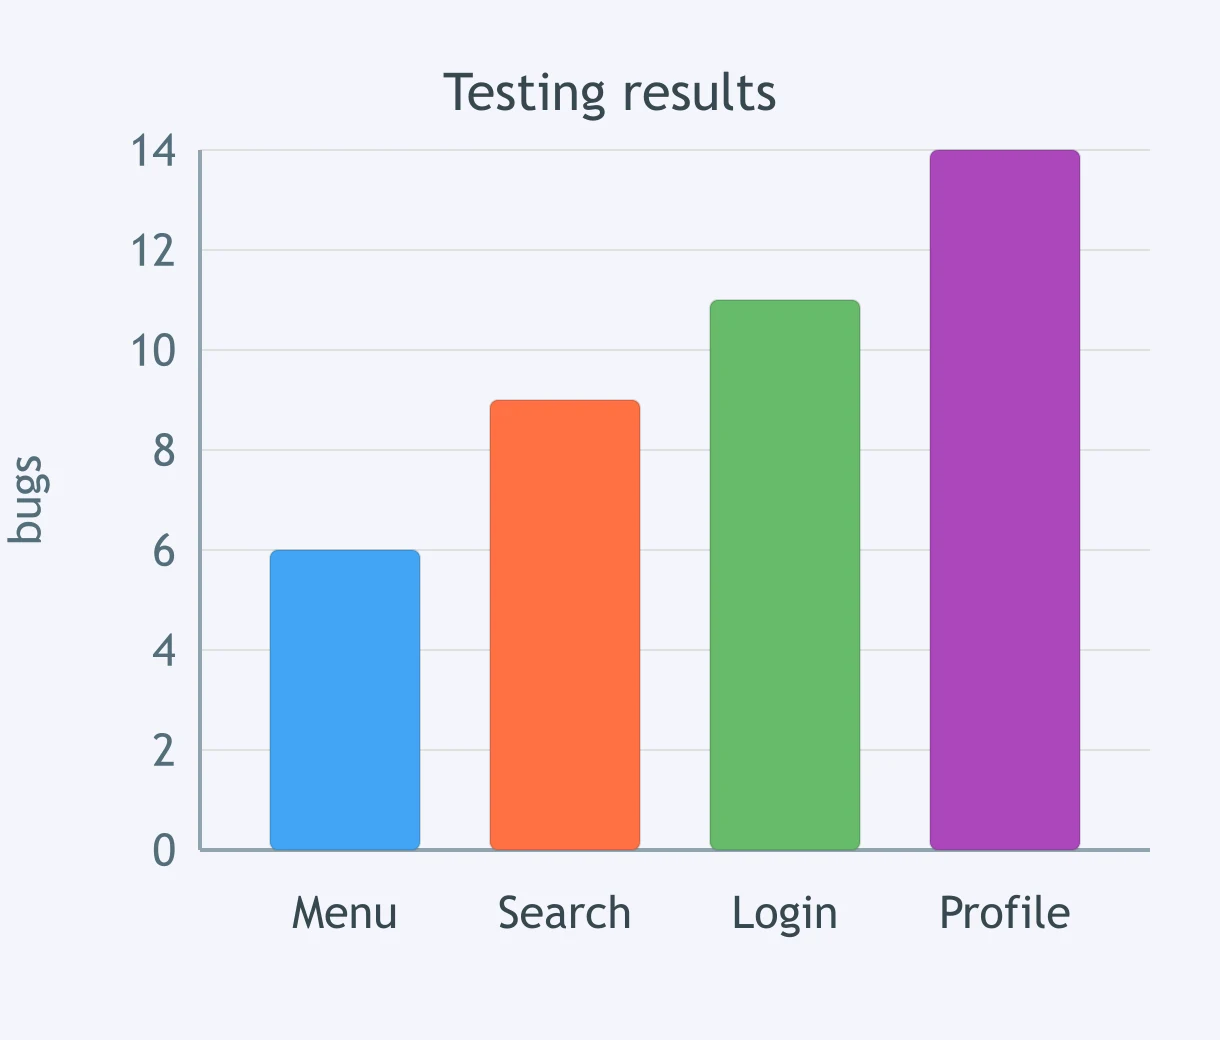
Look at the bar graph of bugs found during testing. How many bugs were found in the Login feature?
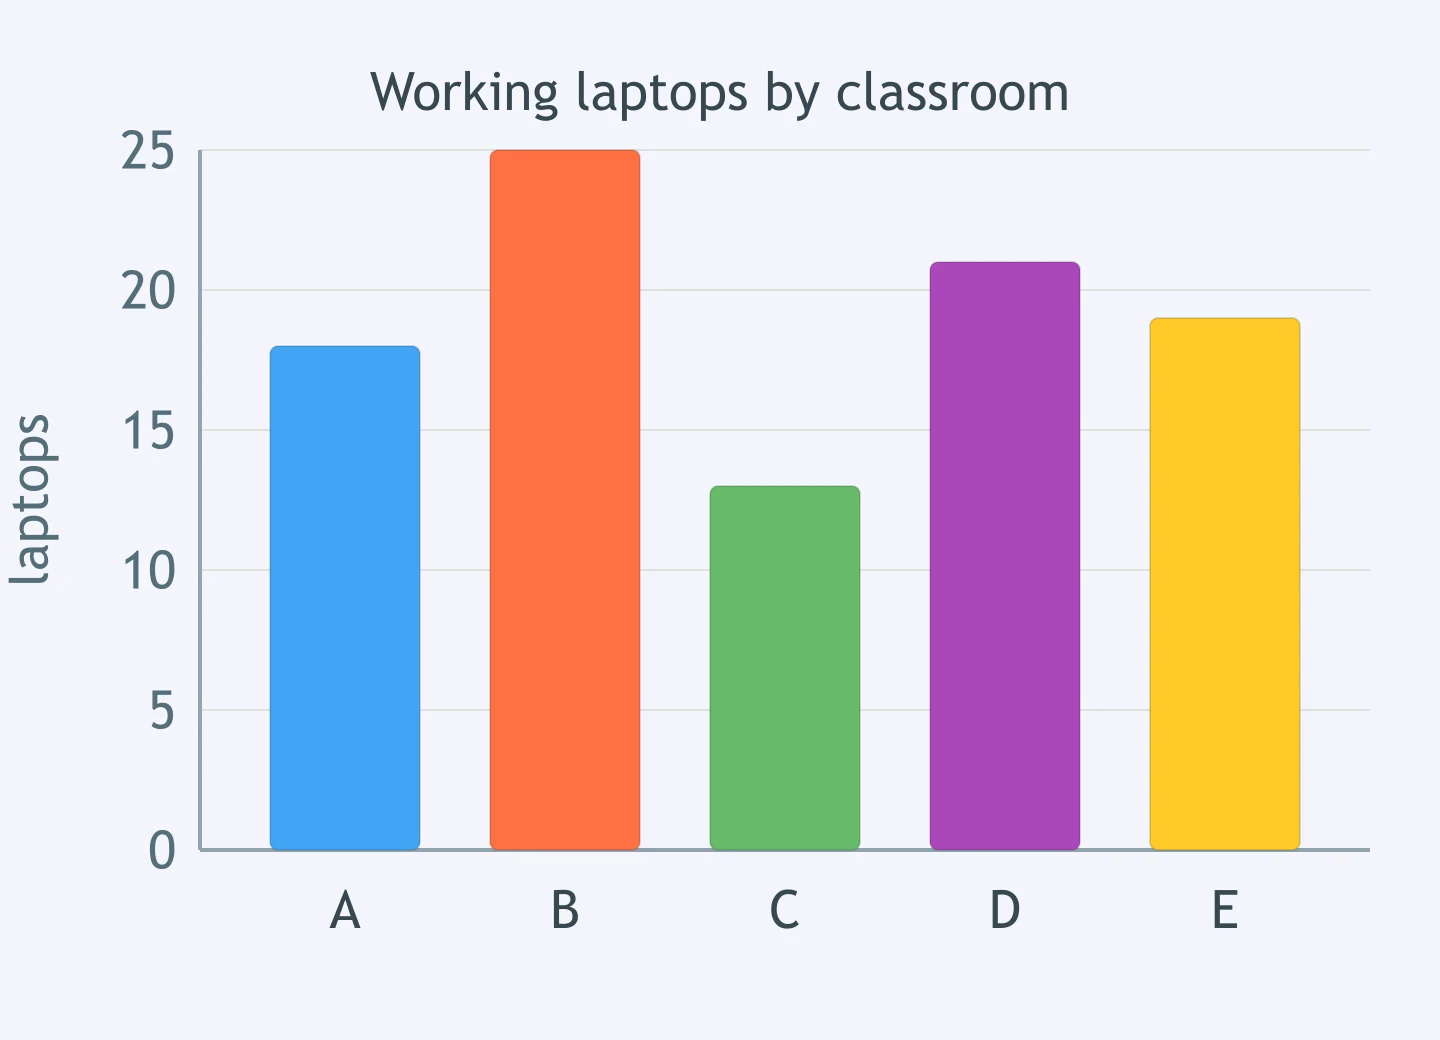
The bars show working laptops in five classrooms. How many more laptops does the classroom with the most have than the classroom with the fewest?
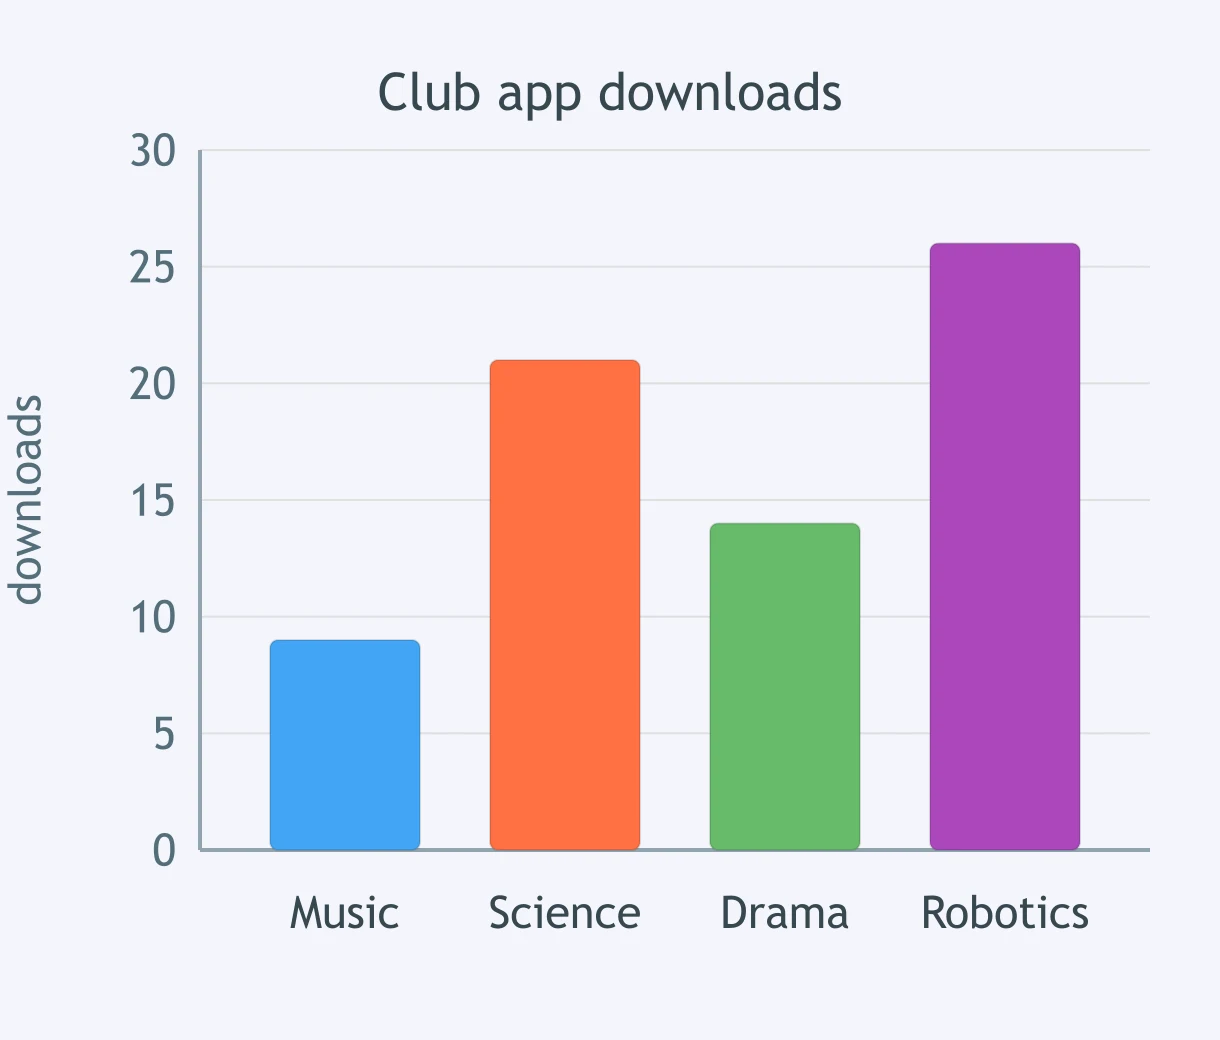
A bar graph shows the number of app downloads from four school clubs. What is the difference between the highest and lowest totals?
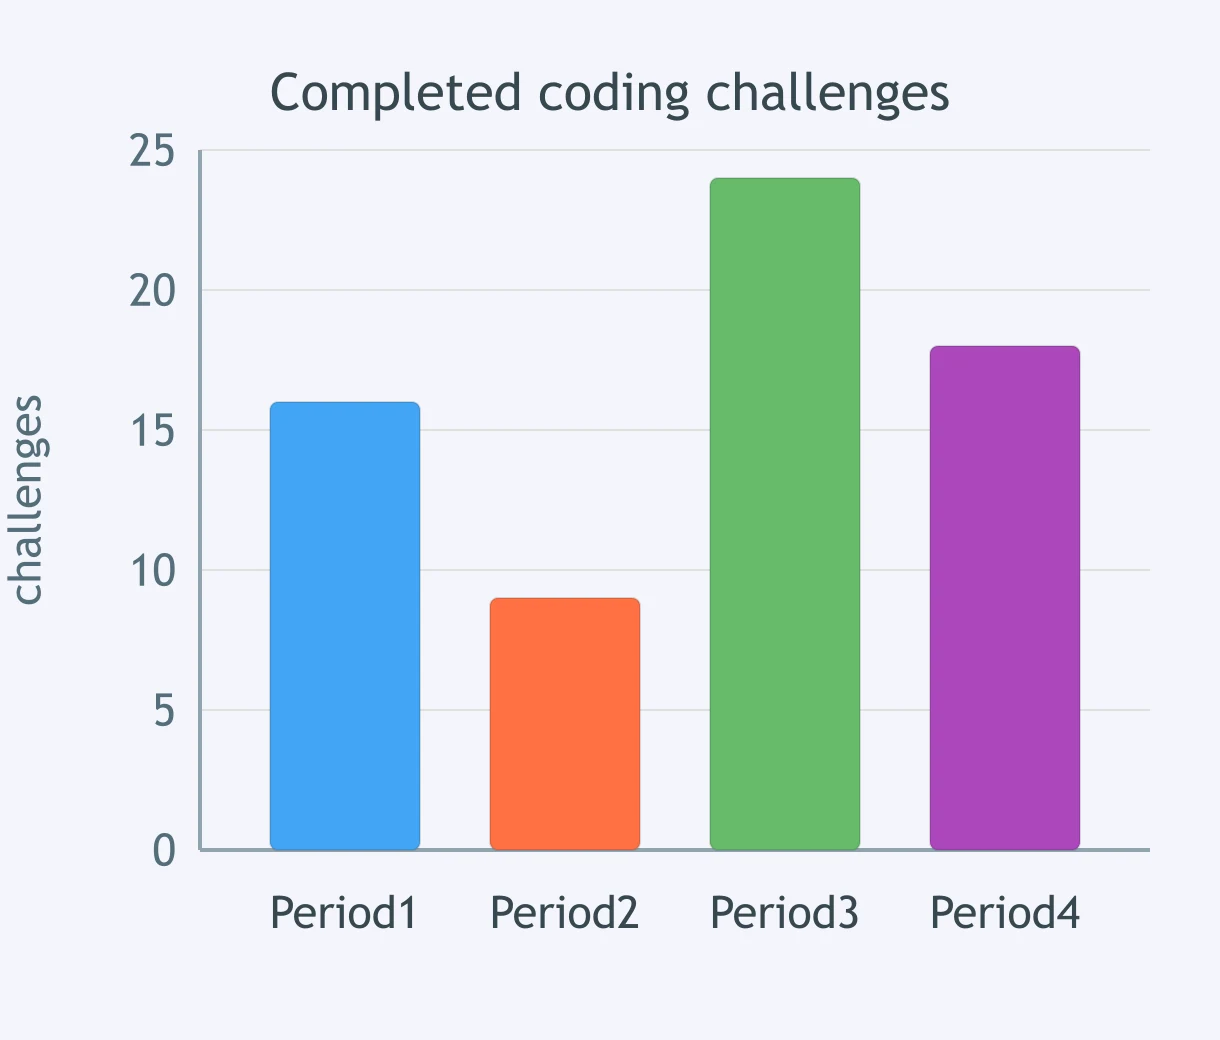
The graph compares completed coding challenges across four periods. By how many challenges does the highest period exceed the lowest period?
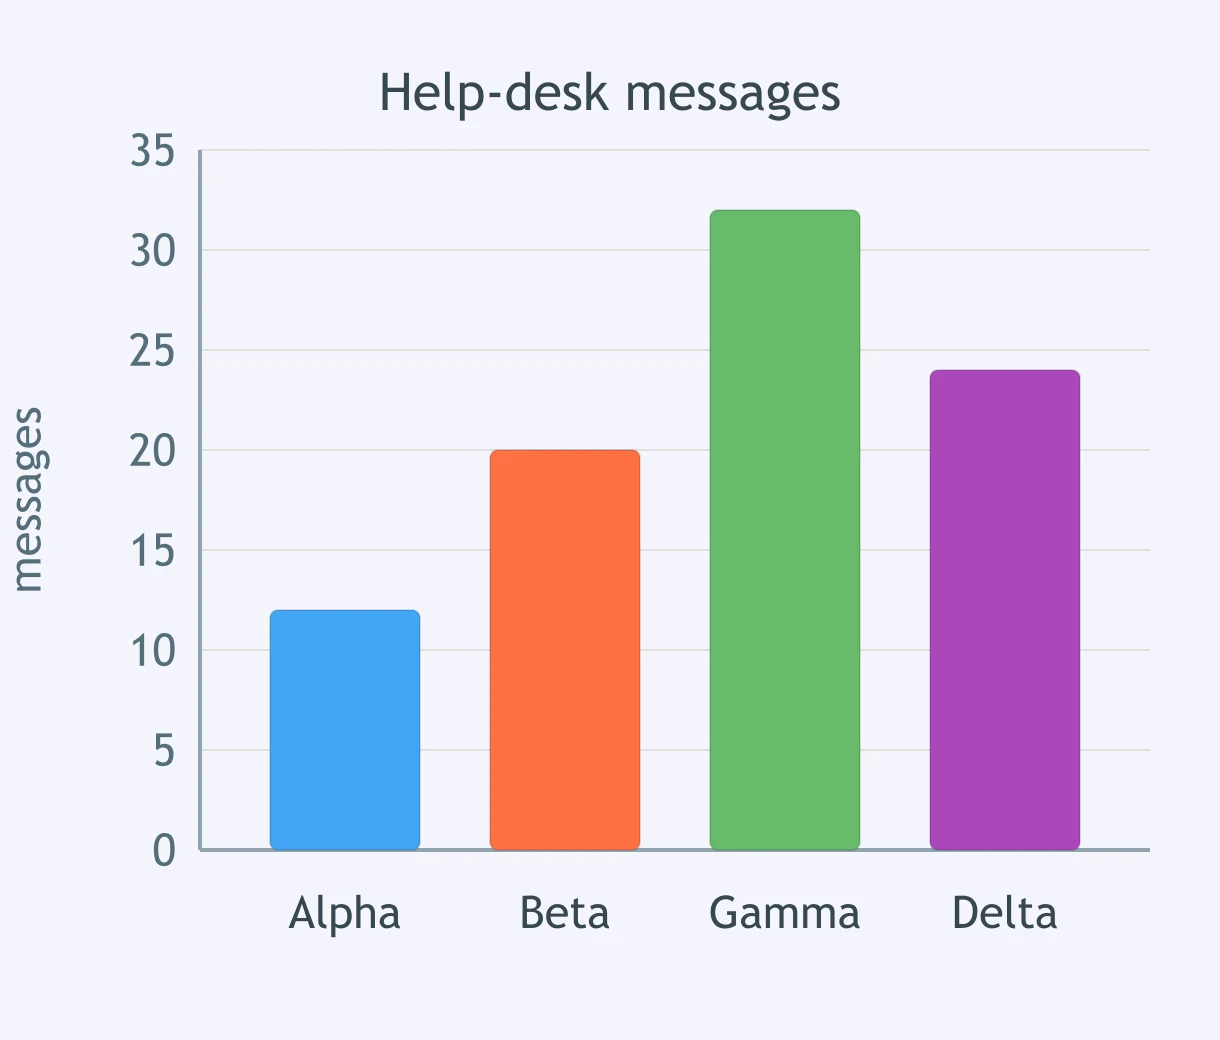
A bar graph shows messages received by four help-desk teams. What is the difference between the largest and smallest counts?
The line graph shows daily server requests. Between which consecutive days did requests increase the most?
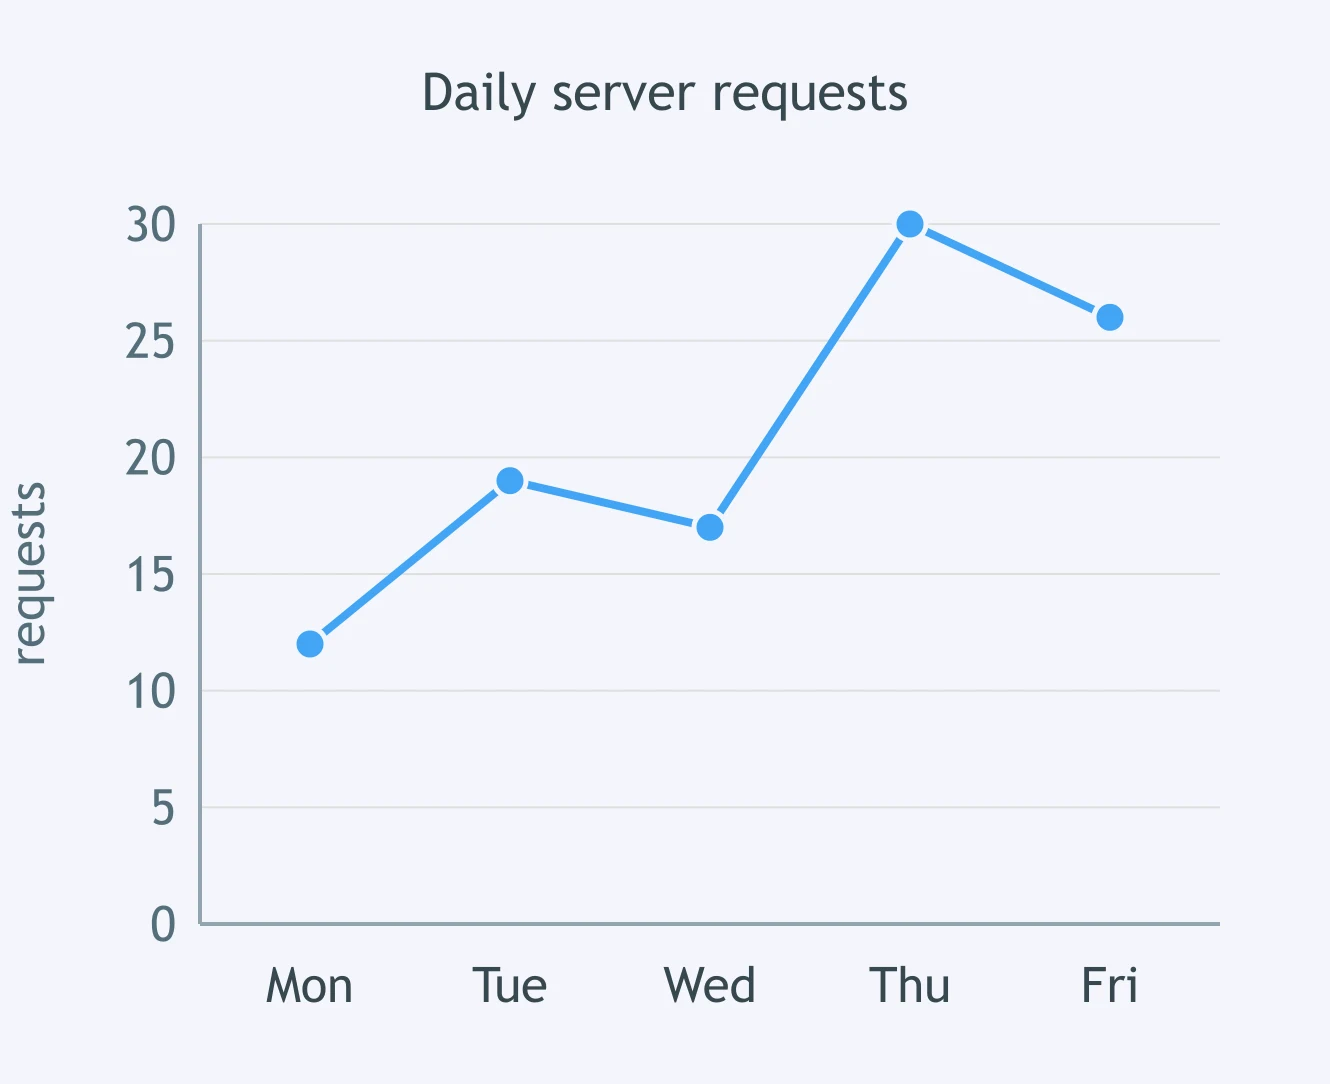
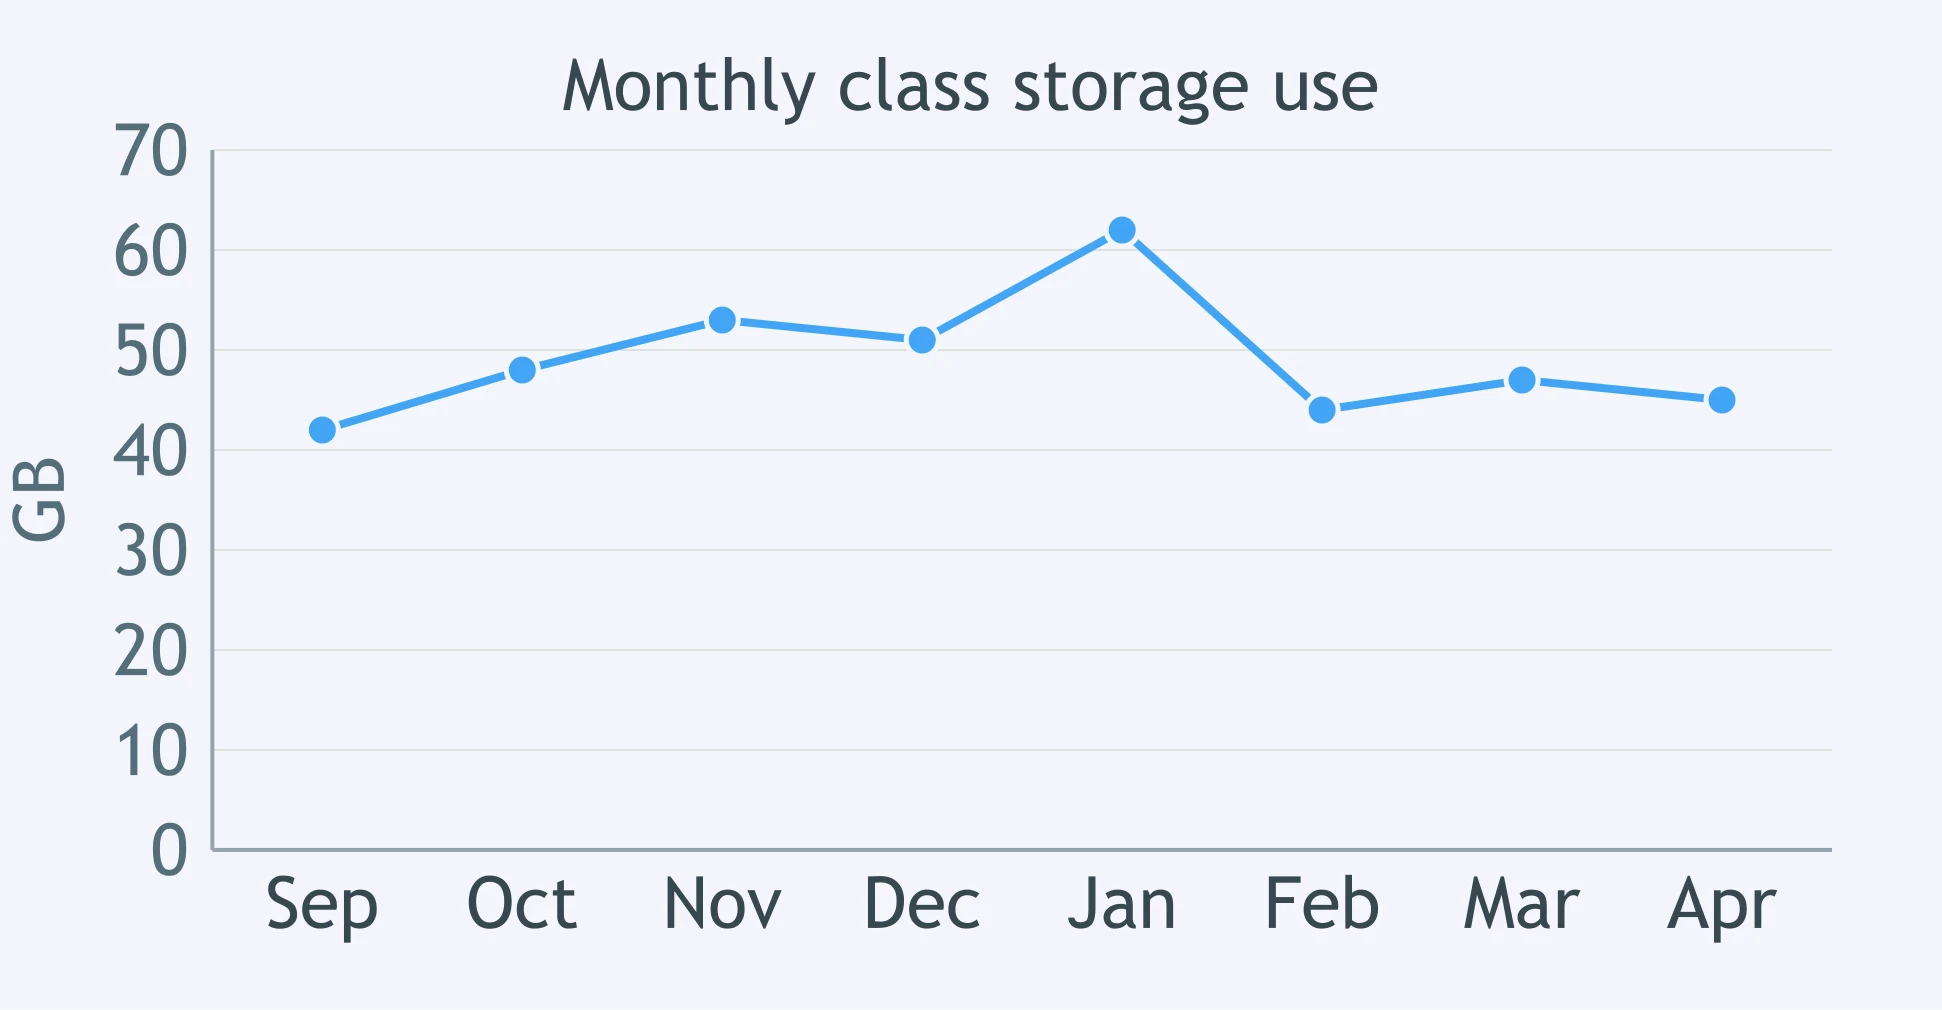
The line graph tracks a class's data storage use each month. During which interval did storage use fall the most?
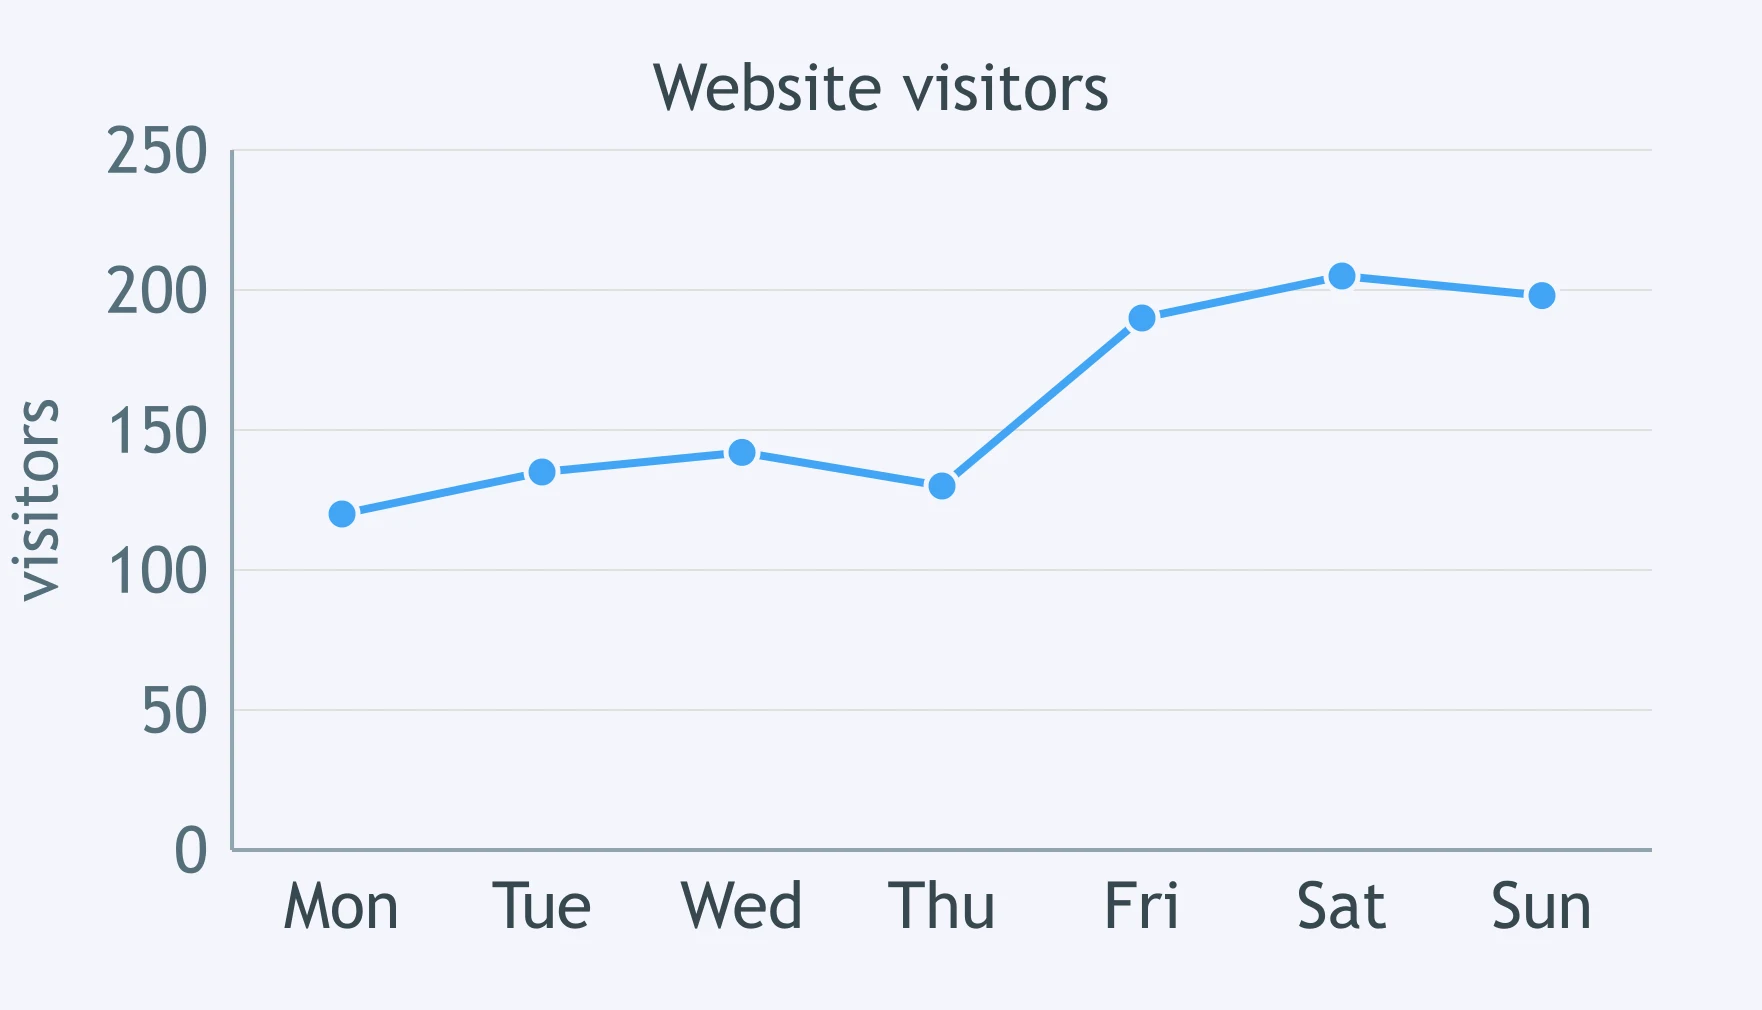
The line graph shows the number of website visitors during a week. Between which two consecutive days was the largest increase?
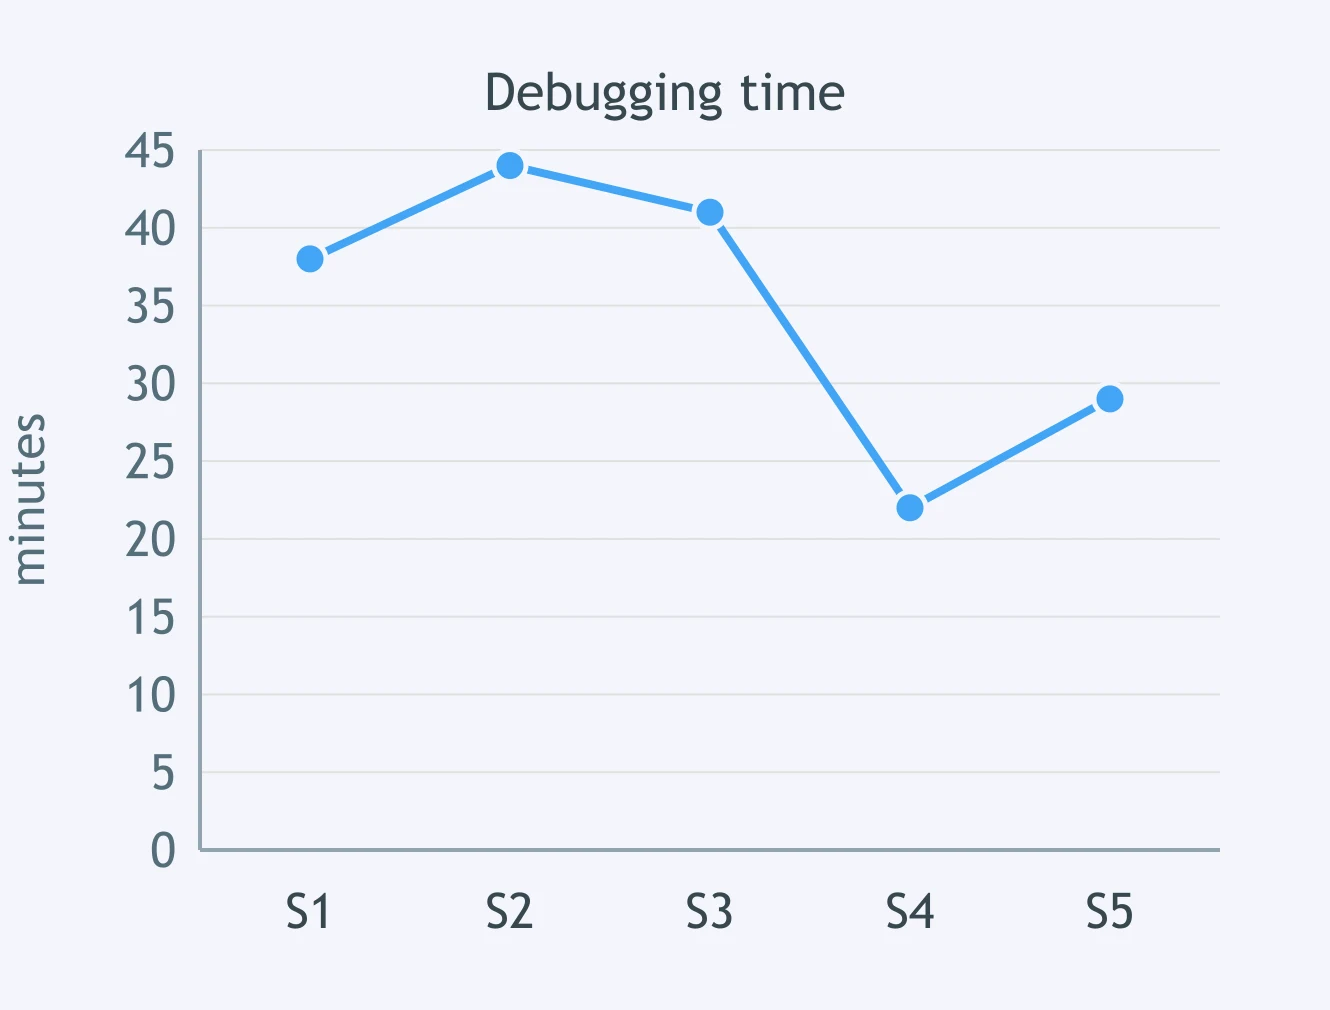
A line graph tracks minutes spent debugging over five sessions. When did the time decrease the most from one session to the next?
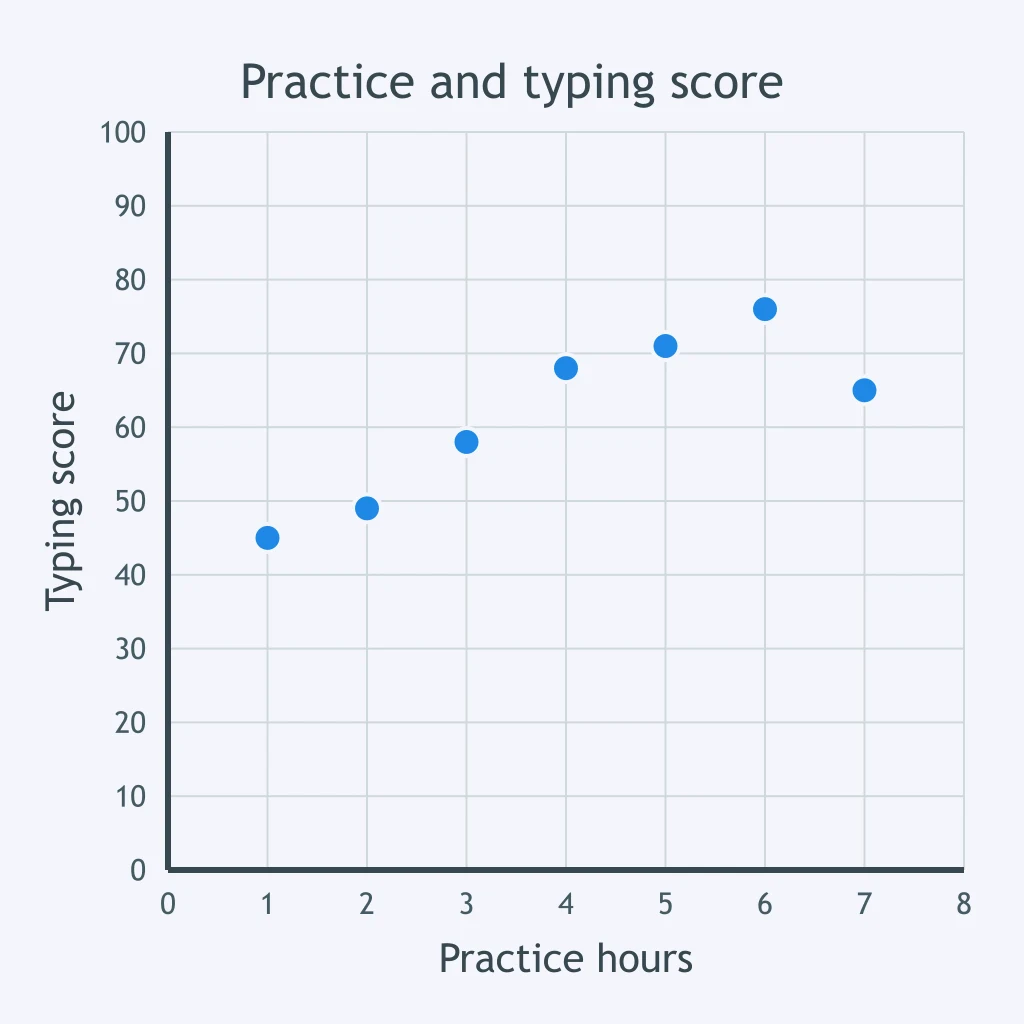
Each point plots one student's weekly keyboard-practice time against typing-test score. What pattern do the points show?
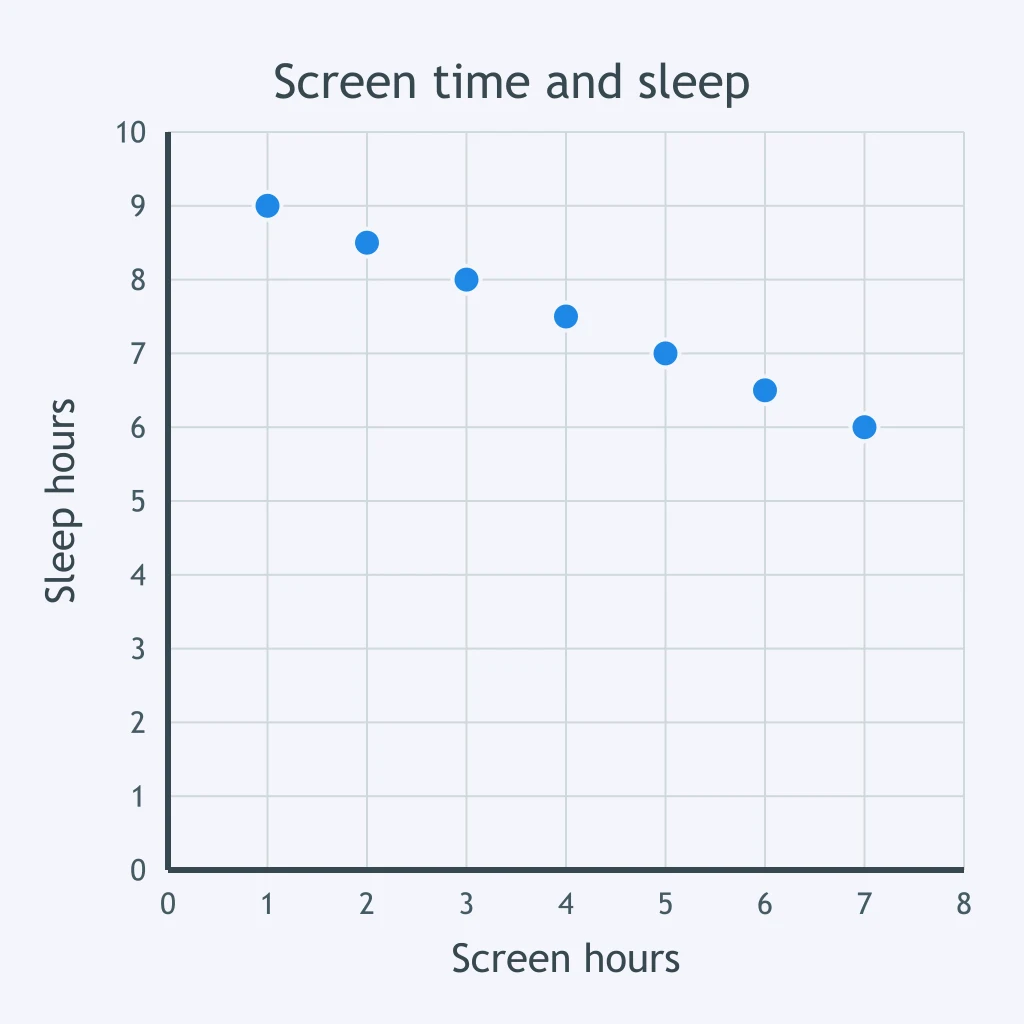
The scatter plot compares daily screen time and hours of sleep for several students. Which relationship is shown?
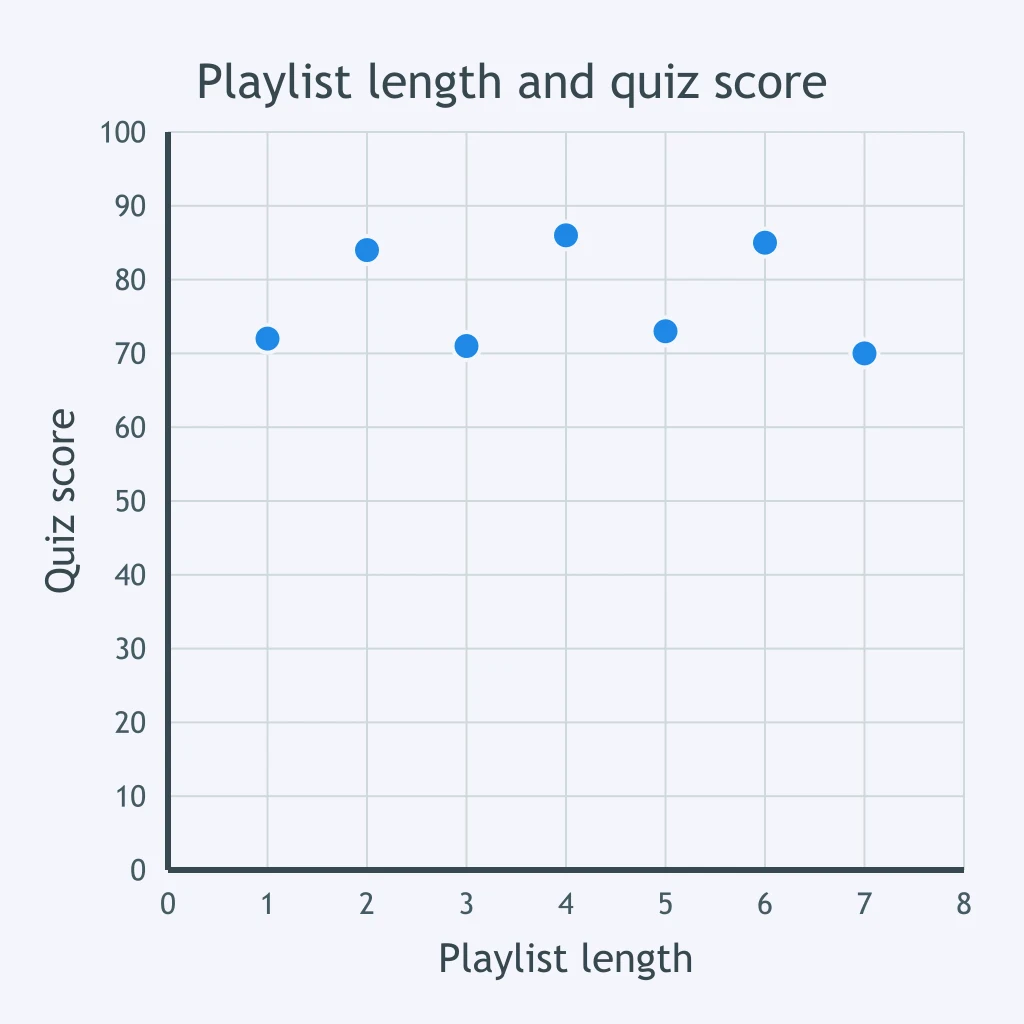
Each point compares a student's playlist length with that student's quiz score. What does the scatter plot suggest?
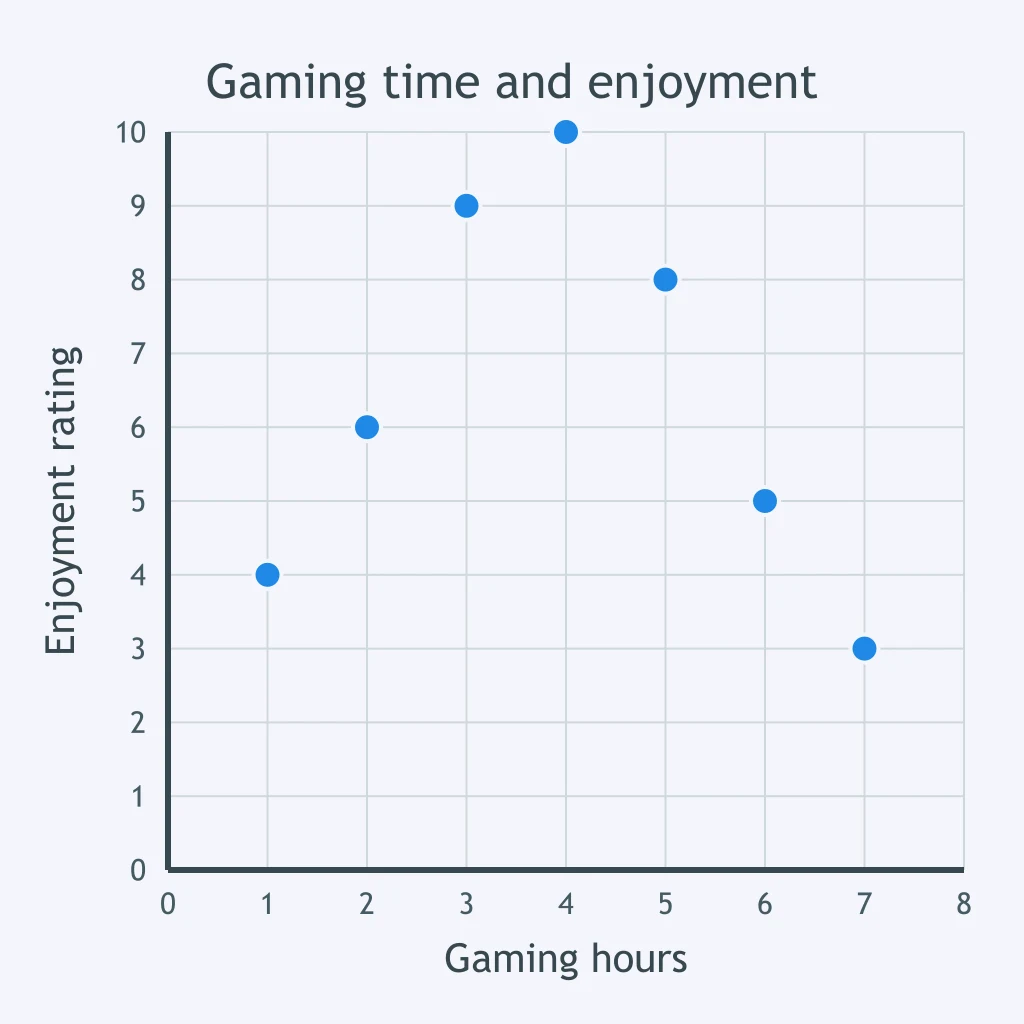
The scatter plot compares daily gaming time with self-reported enjoyment ratings. Which description fits the plotted pattern?
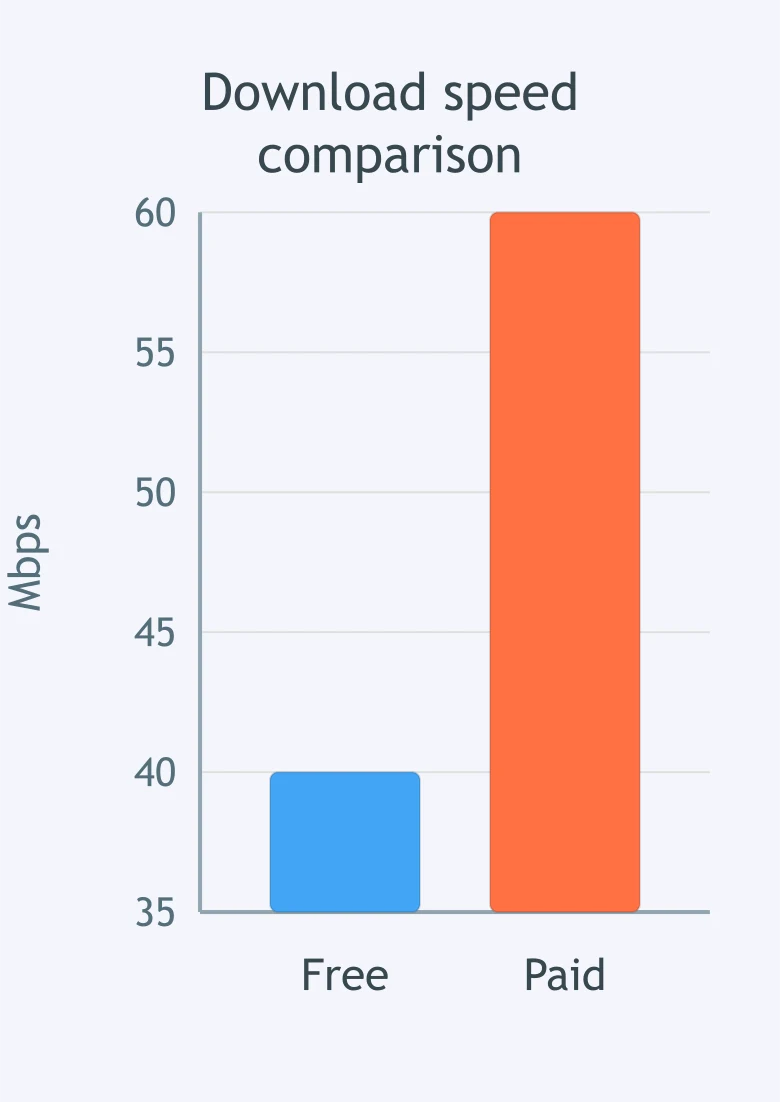
An advertisement compares the download speeds of a free plan and a paid plan using a truncated vertical axis. Reading the axis values, the paid plan is how many times the free plan's speed?
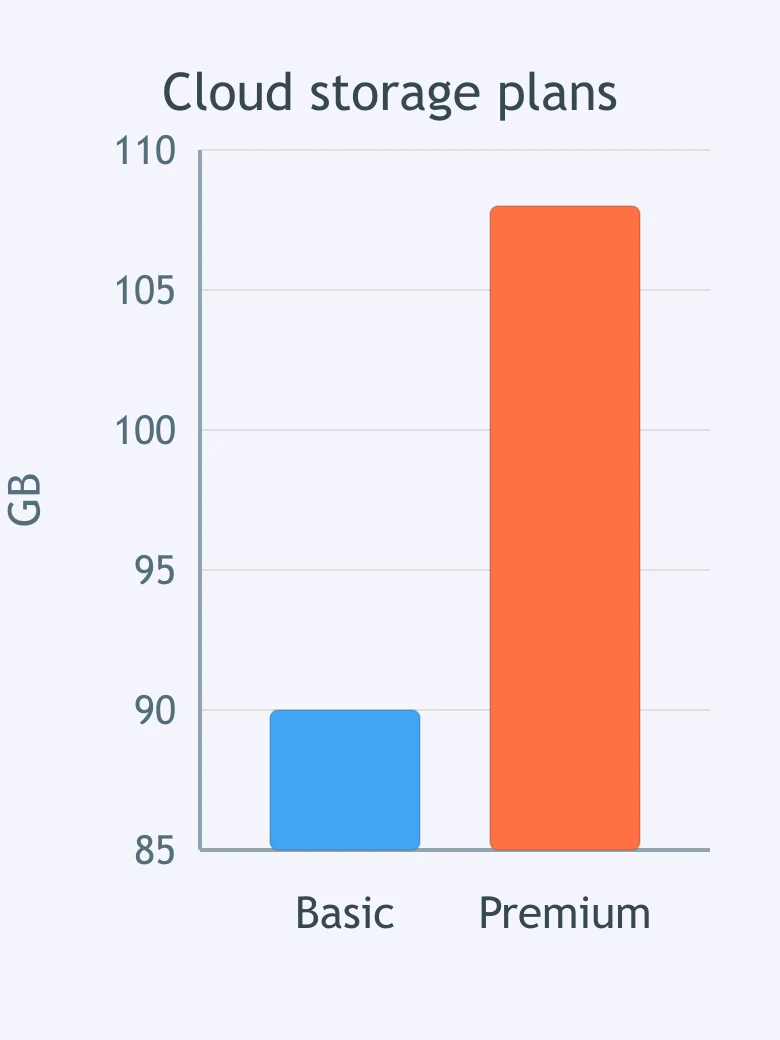
A chart uses a truncated axis to compare two cloud-storage plans. Based on the axis values, the Premium plan provides how many times the storage of the Basic plan?
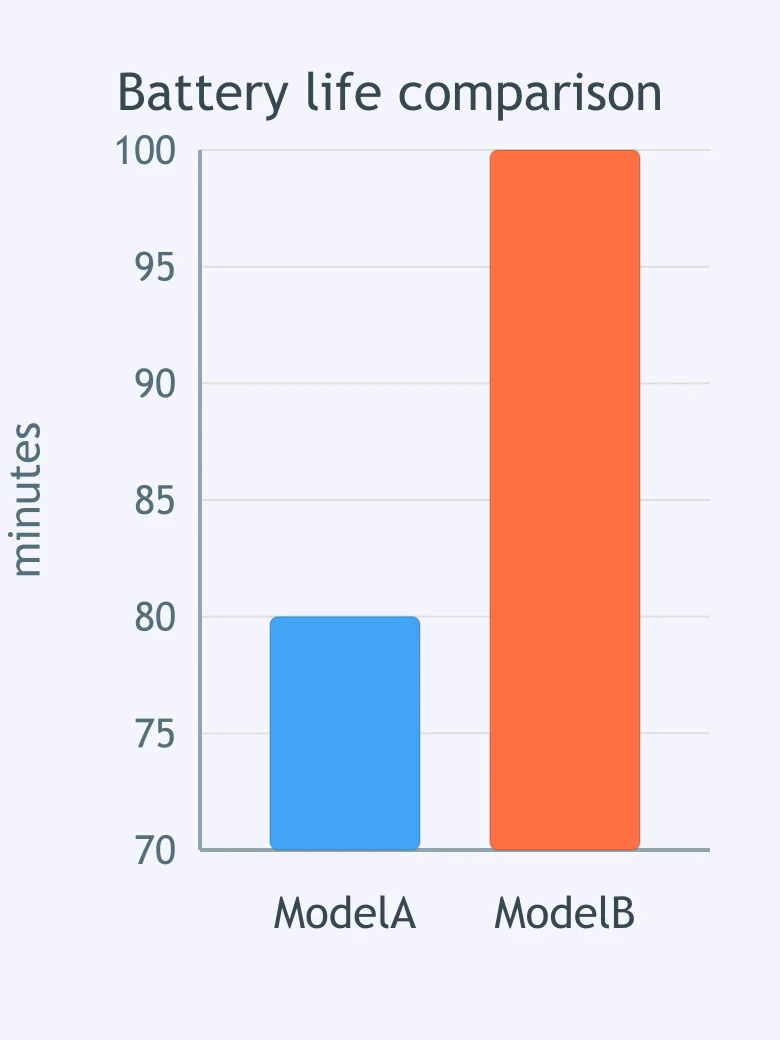
The bars compare two computer models' battery life, but the vertical axis is truncated. Reading the axis values, Model B lasts how many times as long as Model A?
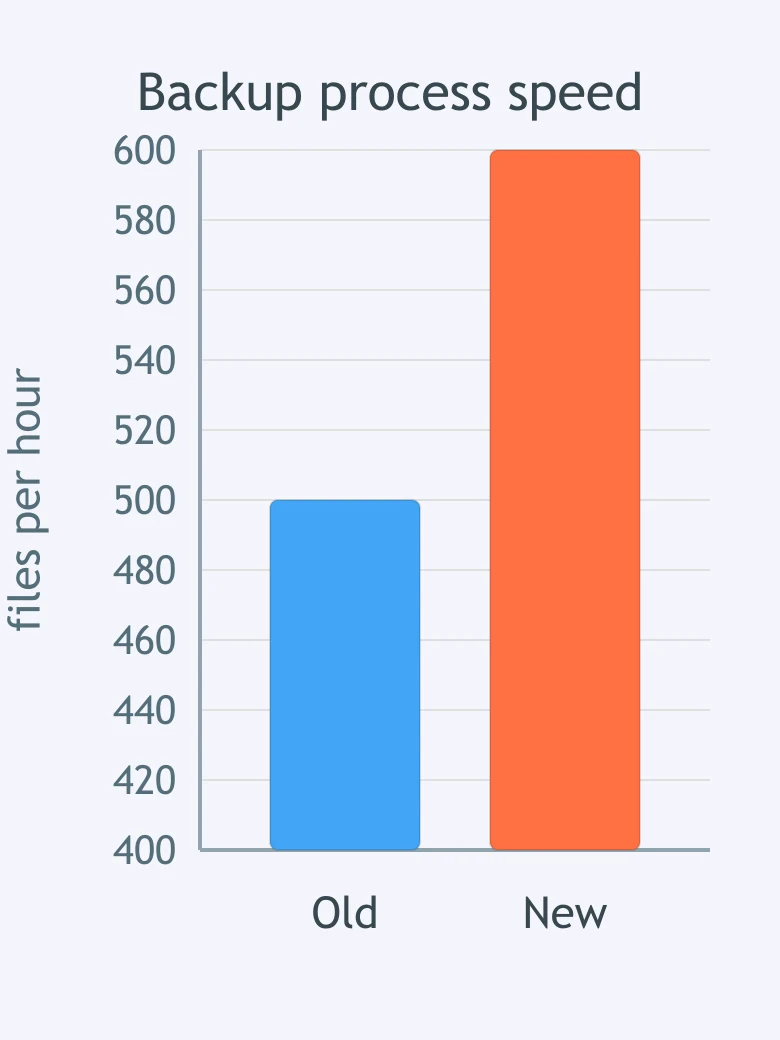
A chart with a truncated vertical axis compares an old and new backup process. Reading the values on the axis, the new process is how many times as fast as the old process?
A class records how many students selected each programming-project topic, with every student counted once. Which chart best displays the category counts?
A website records its number of visitors every day for a month. Which visualization best shows how the visitor count changes over time?
A teacher wants to examine whether students who spend more hours practicing keyboarding tend to earn different typing-test scores. Which chart fits this data set?
A school tracks the number of devices connected to its Wi-Fi network at the end of each month. Which chart should it use to show the trend during the year?
A survey asks each student to choose one preferred coding environment from four named choices. Which chart best compares the response totals?
Crack the passcode before the zombies get in.
Answer, then swat bugs for bonus points.
Race through questions at your own speed.
Same question on every screen. Fastest wins.

Pick a tile, answer, hit bonuses and steals.
Data Privacy, Bias and Who Owns Your Data
25 questions