Loading
by BlastRoom
Center, spread and shape — and what a graph is actually telling you.
#psychology
25 questions
One question set, multiple game modes. Tap any game to see it in action. Not sure which to pick?
Answer to place stones and capture territory.
Outrun the snow together.
Earn blasts, then hunt the other team.
Answer to earn energy, then climb.

The class blasts through walls together.
Bid on mystery lots. Most money wins.
Sell tours. Nice, standard, or a total scam.

Answer, restock, and serve the rush.
More correct answers pulls the rope your way.
Answer, then shoot down the alien wave.
Answer, then tap to leap the frozen ridge.
A teacher records reaction times of 3, 5, 7, 9, and 11 seconds. What is the mean reaction time?
For test scores 70, 74, 76, 78, and 98, what is the median?
A survey gives anxiety ratings of 2, 4, 4, 5, 7, and 9. What is the mode?
Quiz scores are 4, 6, 6, 7, 9, 10, and 100. Which measure of center best represents the typical score?
Which measure of center is found by adding all values and dividing by the number of values?
A memory test has scores of 12, 15, 18, and 22. What is the range?
Two groups both have a mean score of 80. Group A has SD 2, and Group B has SD 12. What does Group B's larger SD mean?
Class A scores are 78, 79, 80, 81, 82. Class B scores are 60, 70, 80, 90, 100. Which class has the larger standard deviation?
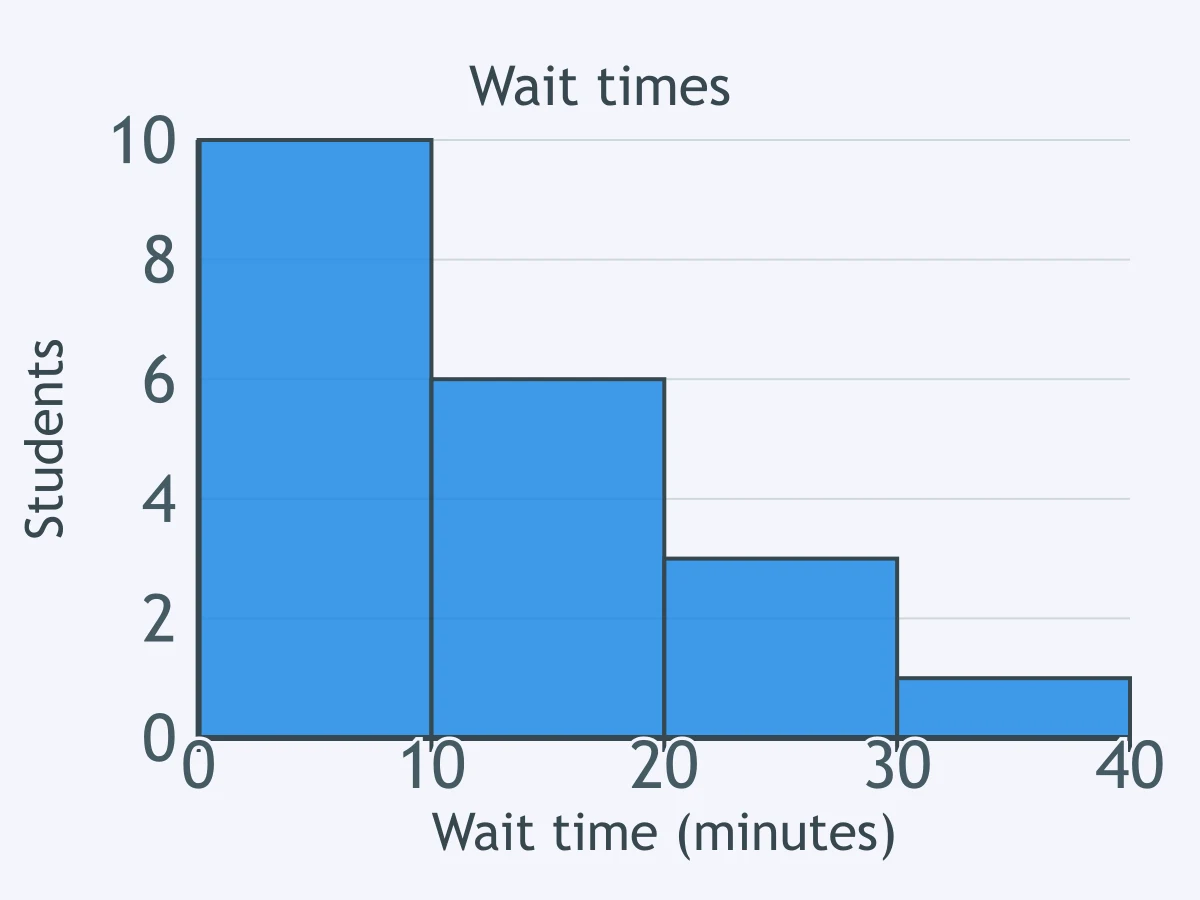
Use the histogram of wait times. The distribution is best described as what shape?
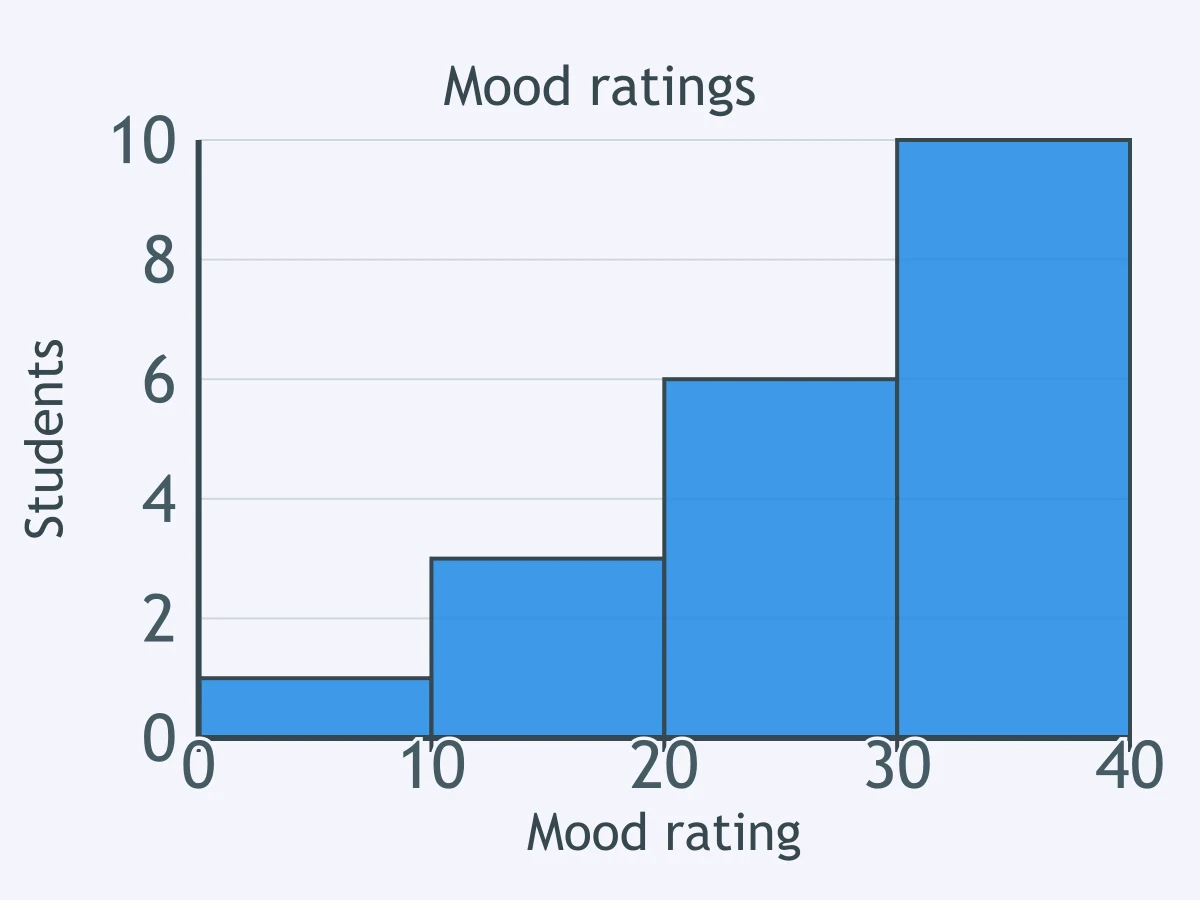
Use the histogram of mood ratings. The distribution is best described as what shape?
Use the histogram of test scores. The distribution is best described as what shape?
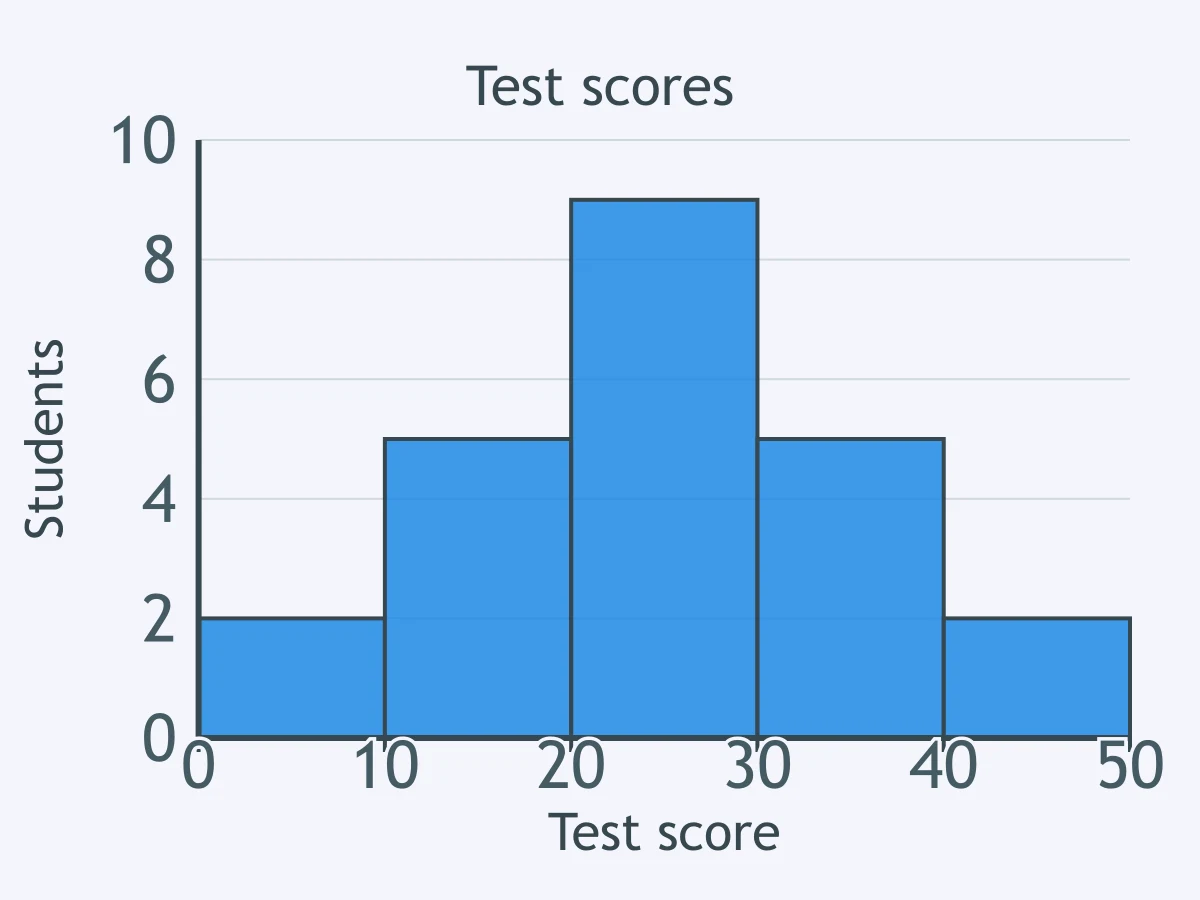
Use the histogram of reaction times. The distribution is best described as what shape?
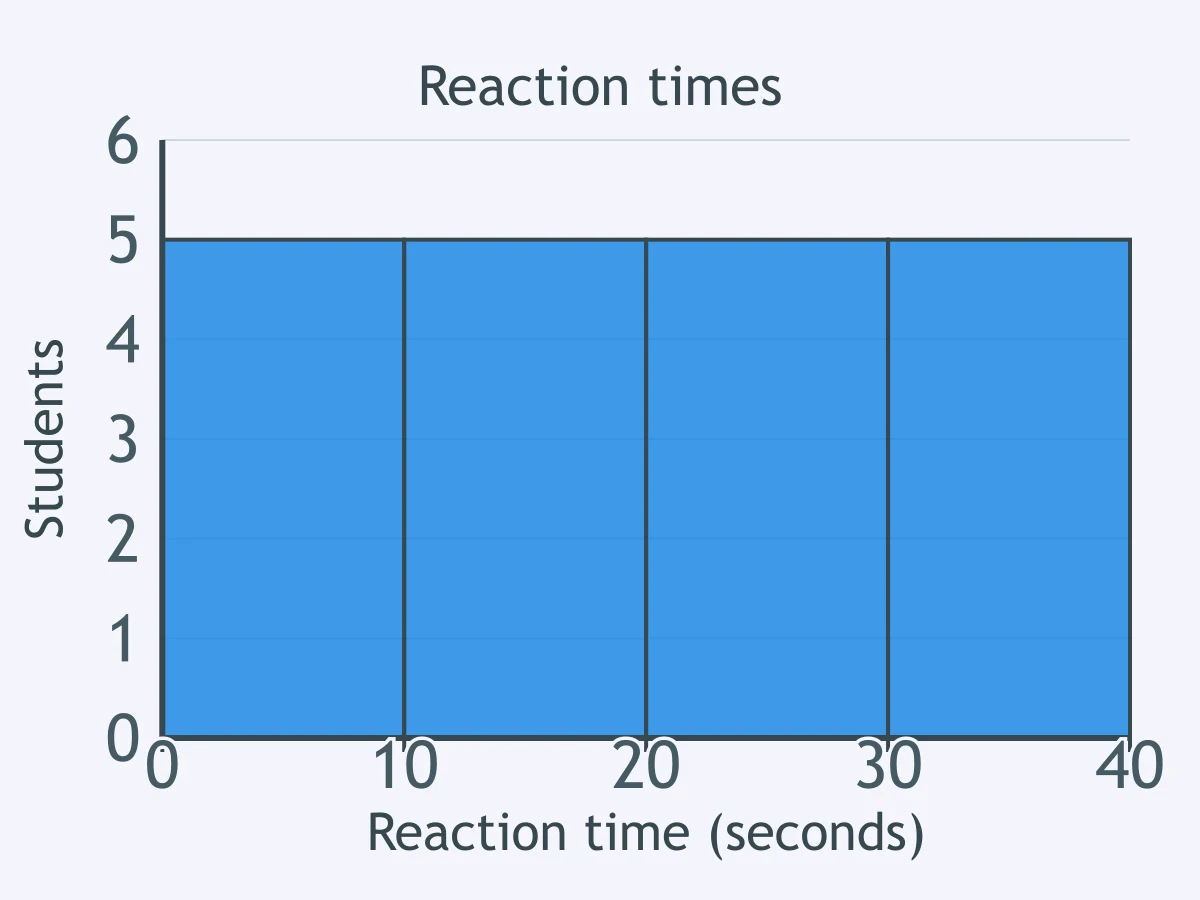
Use the normal curve. The shaded band spans one standard deviation below to one above the mean. About what share of cases is shaded?
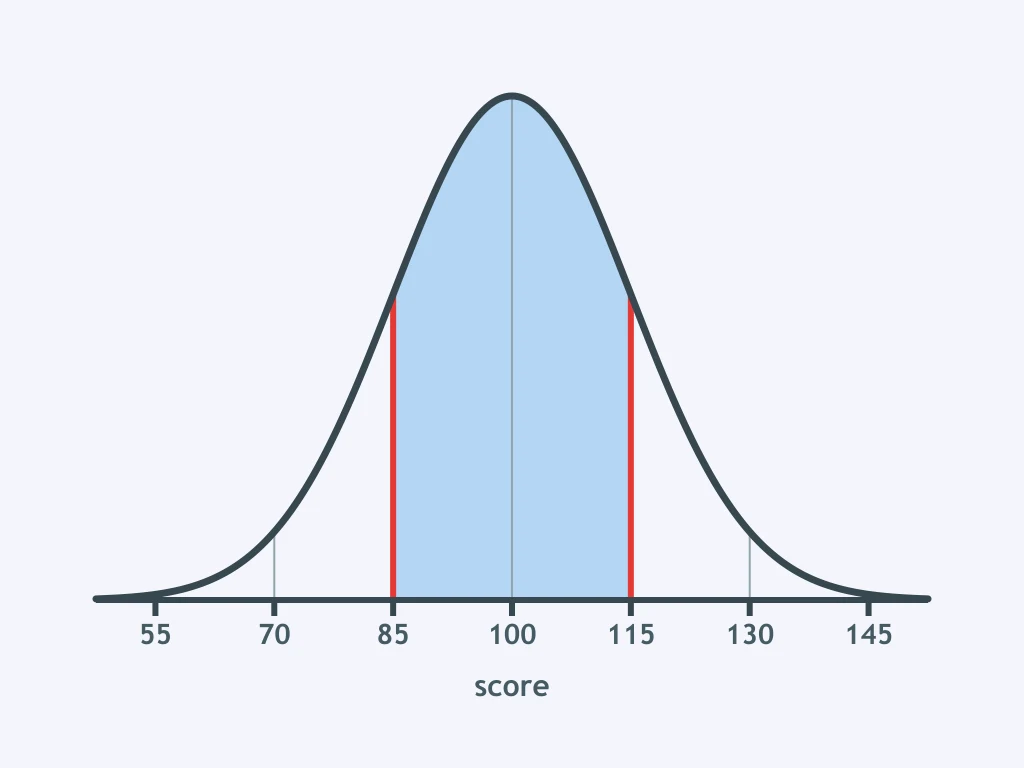
Use the normal curve. About what share of cases lie above the marked score two standard deviations above the mean?
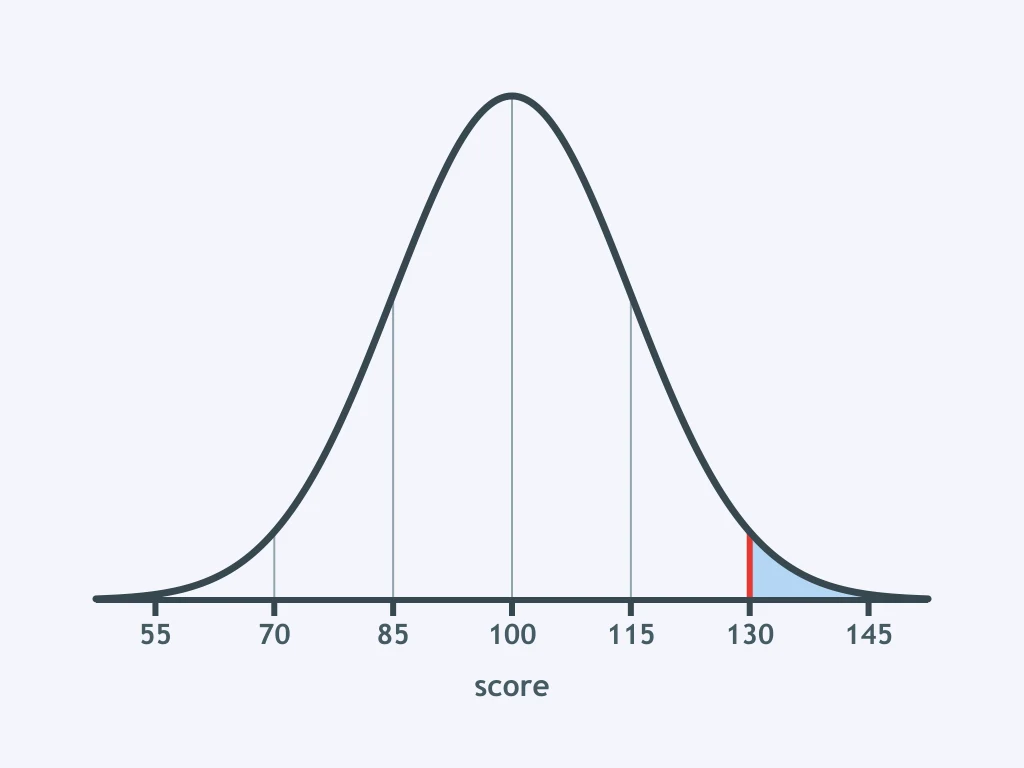
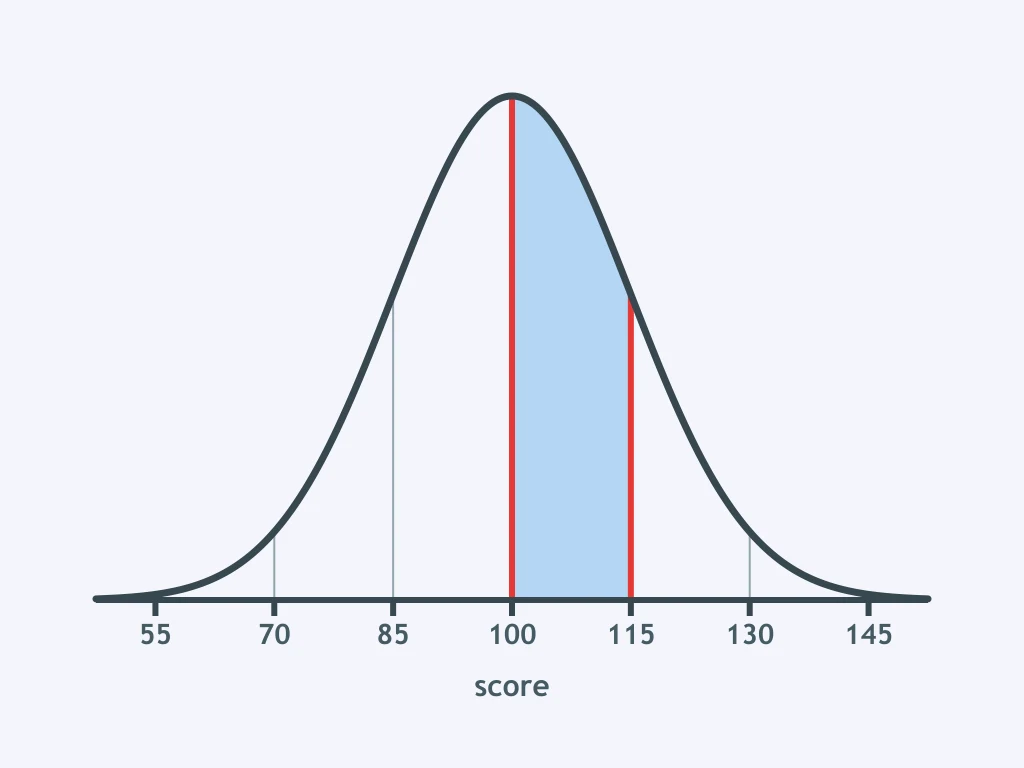
Use the normal curve. The shaded band runs from the mean to one standard deviation above it. About what share of cases is shaded?
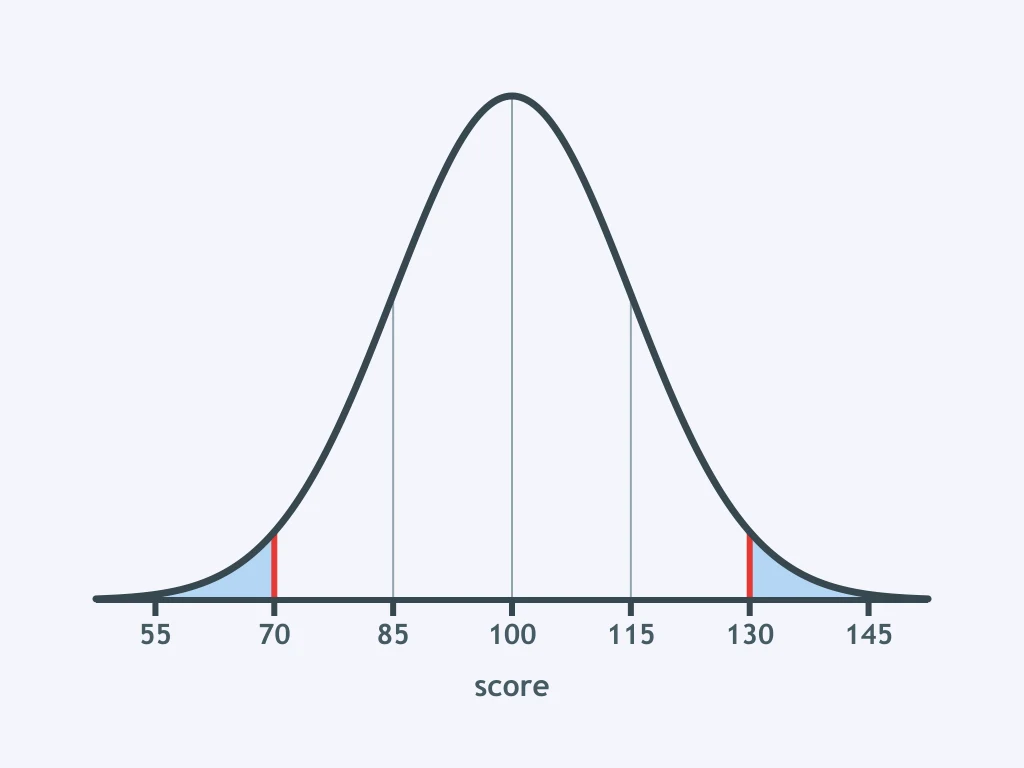
Use the normal curve. The shaded tails lie beyond two standard deviations from the mean. About what share of cases is shaded?
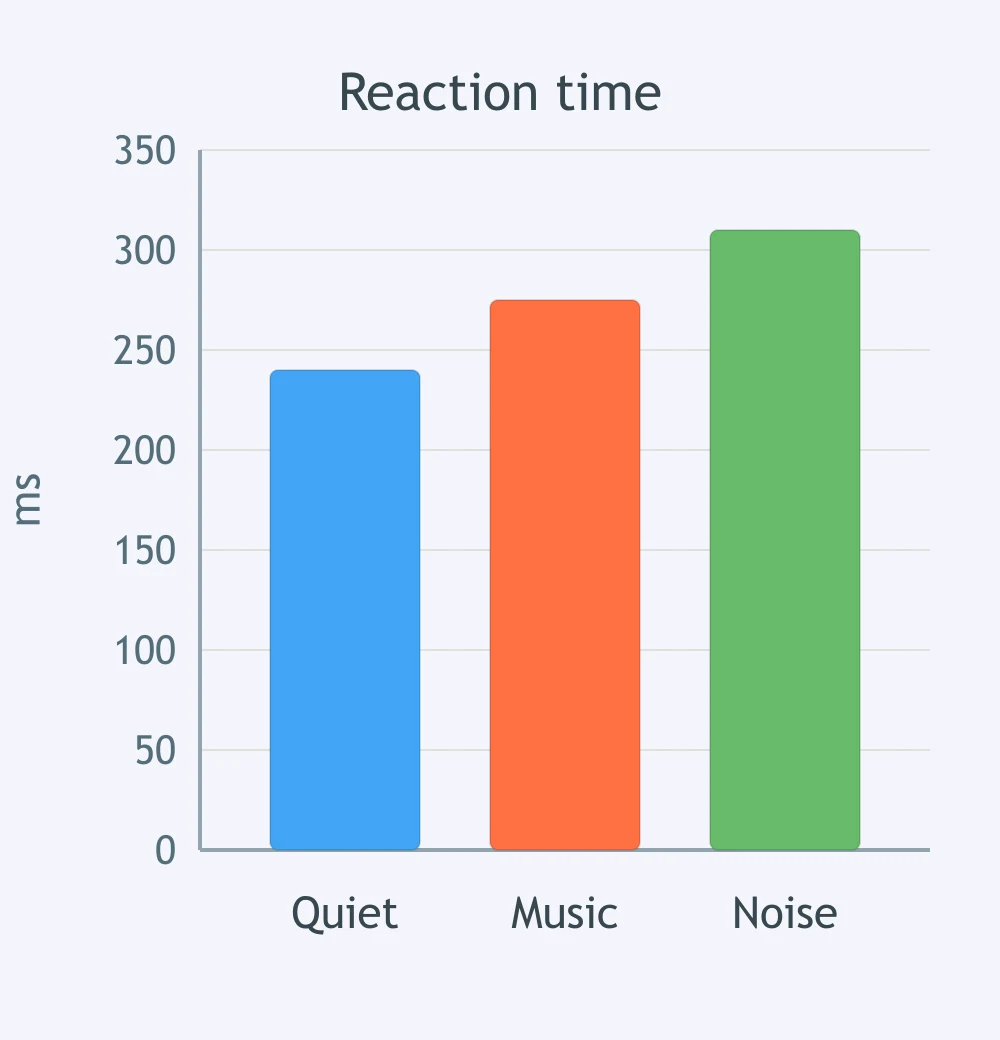
Use the bar graph. Which condition had the slowest mean reaction time?
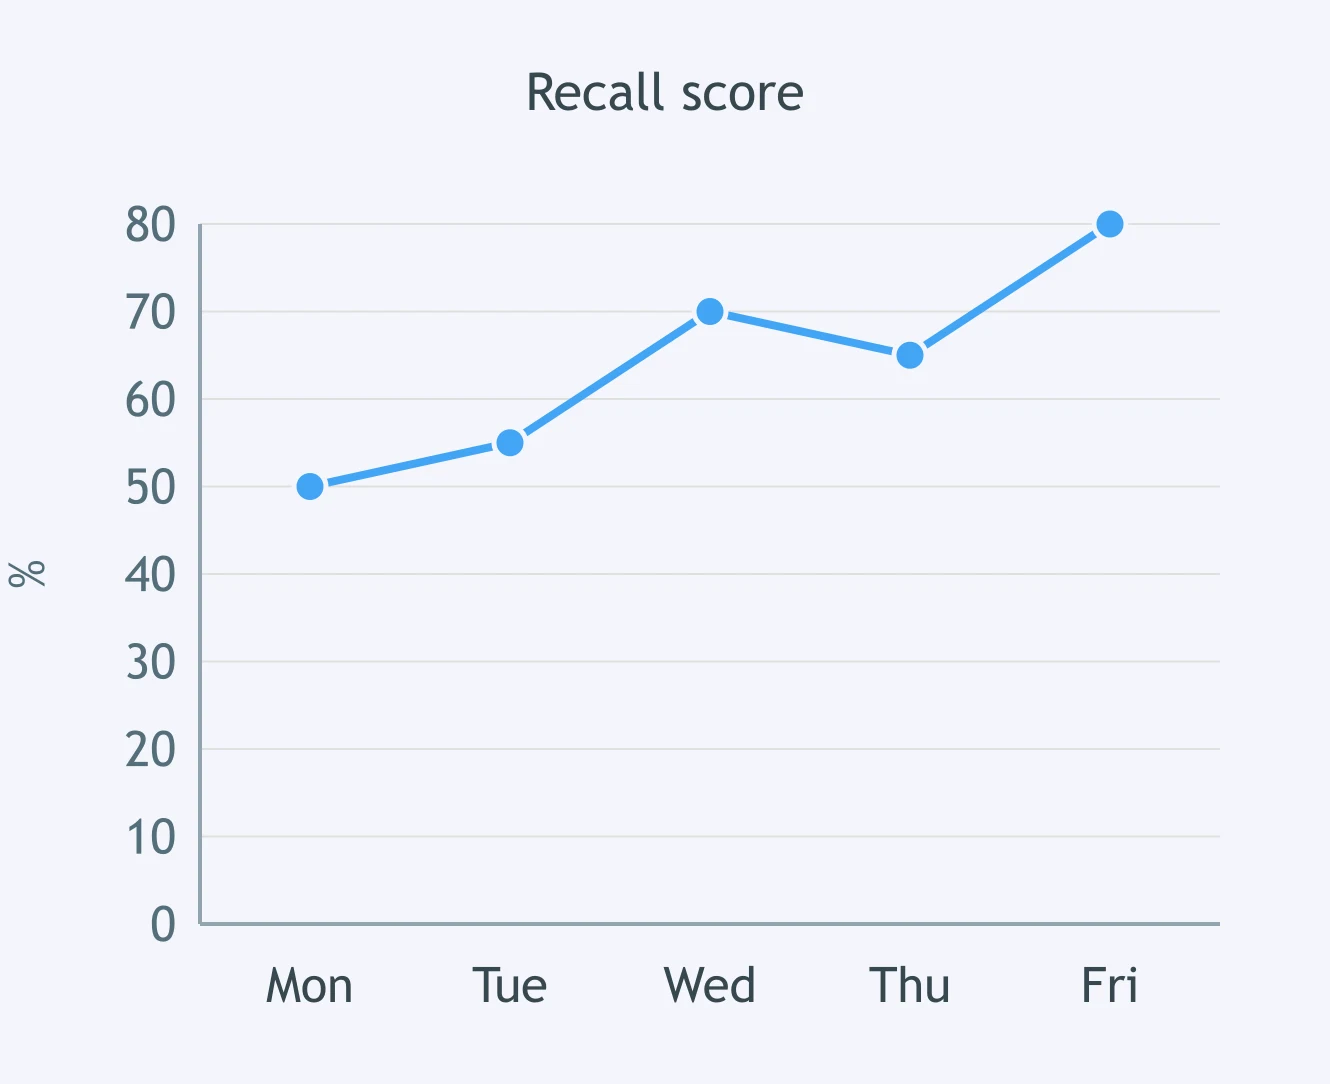
Use the line graph. On which day was the recall score highest?
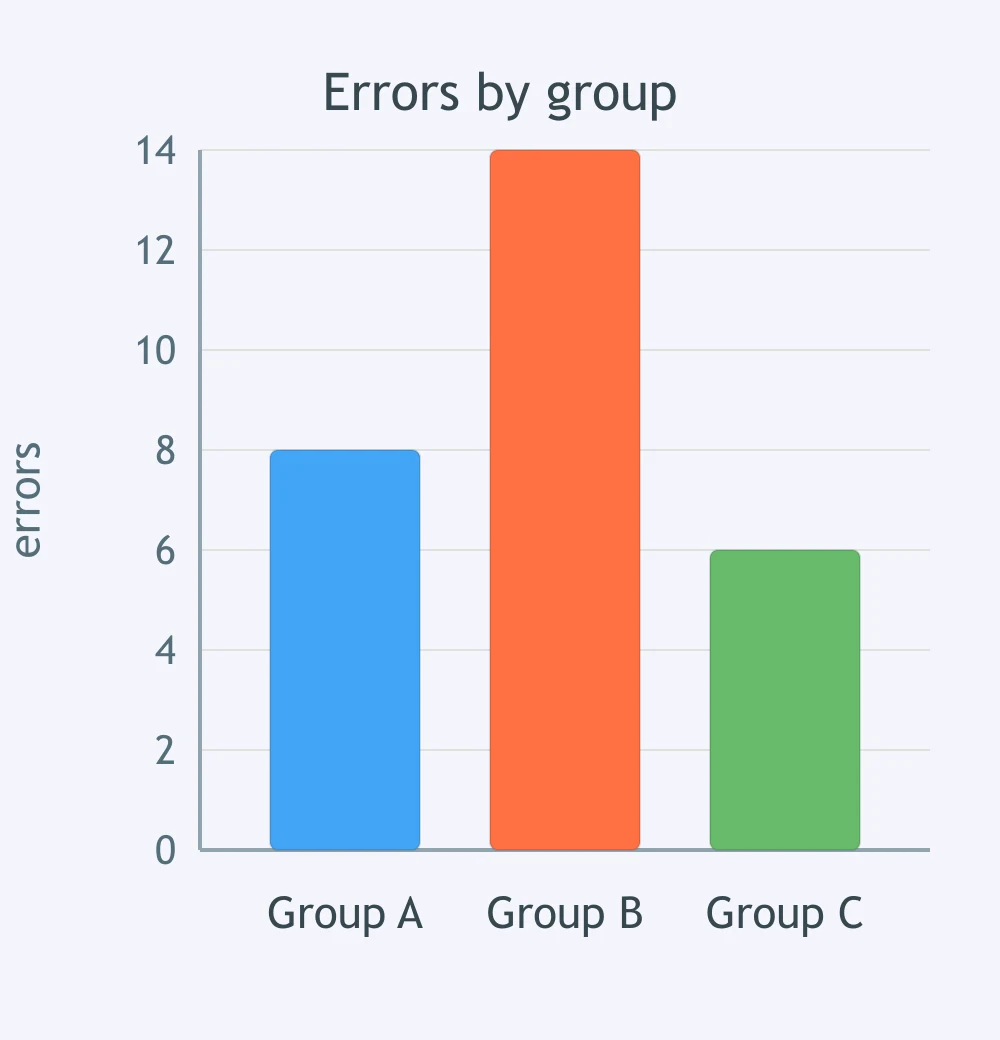
Use the bar graph. Which group made the fewest errors?
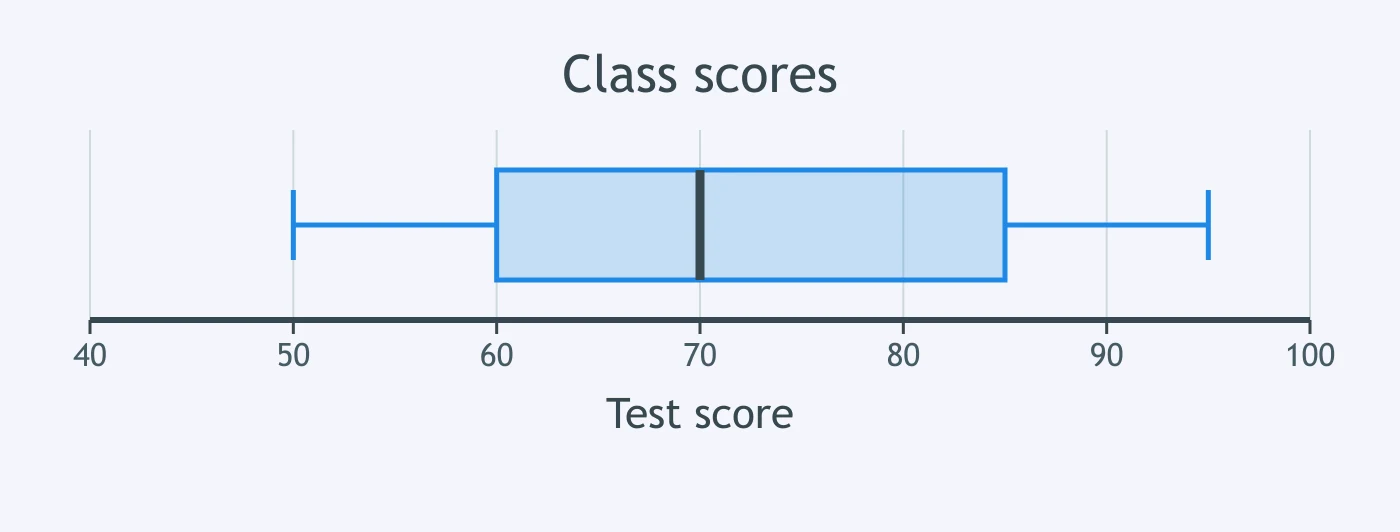
Use the boxplot. What is the approximate range of the scores?
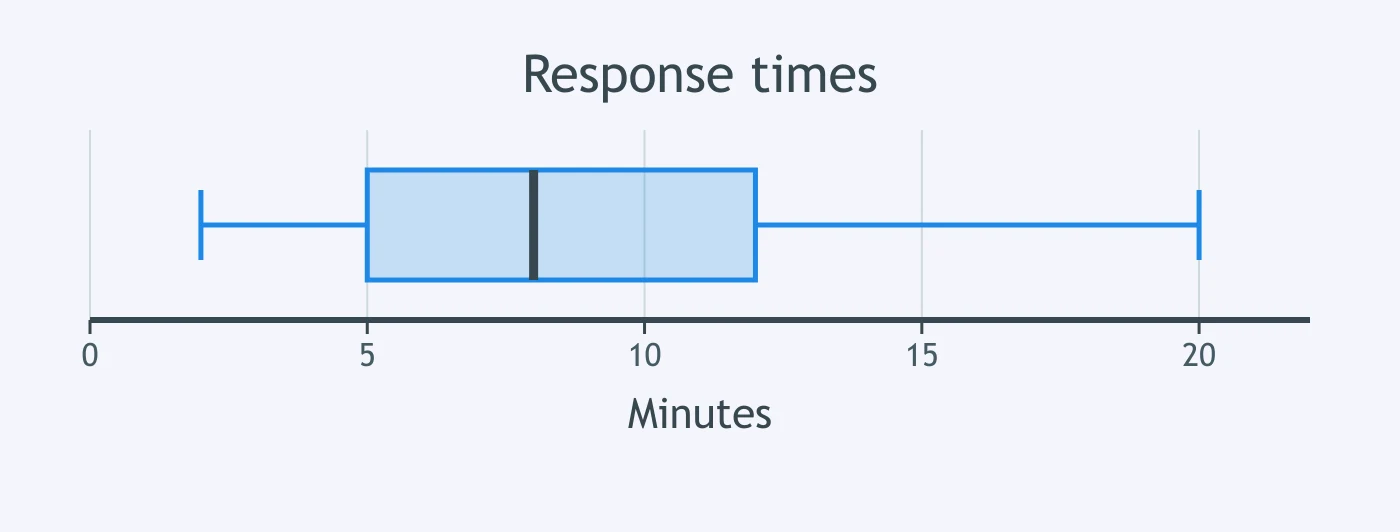
Use the boxplot. What is the approximate interquartile range?
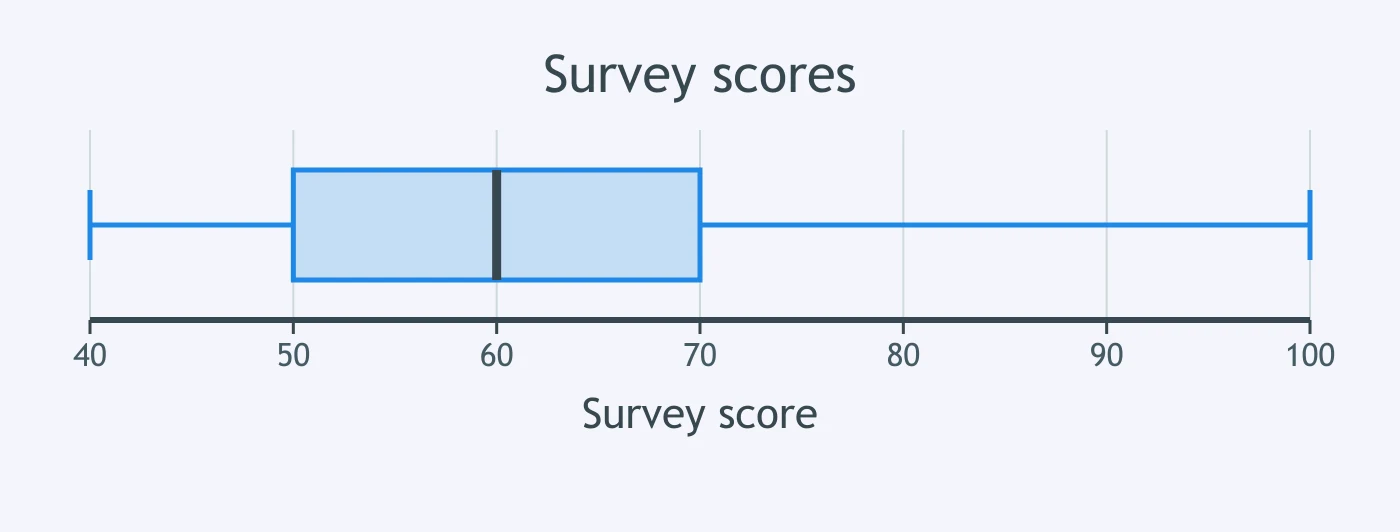
Use the boxplot. About how wide is the middle 50 percent of the survey scores?
Use the scatterplot of study hours and quiz scores. The relationship is best described as what?
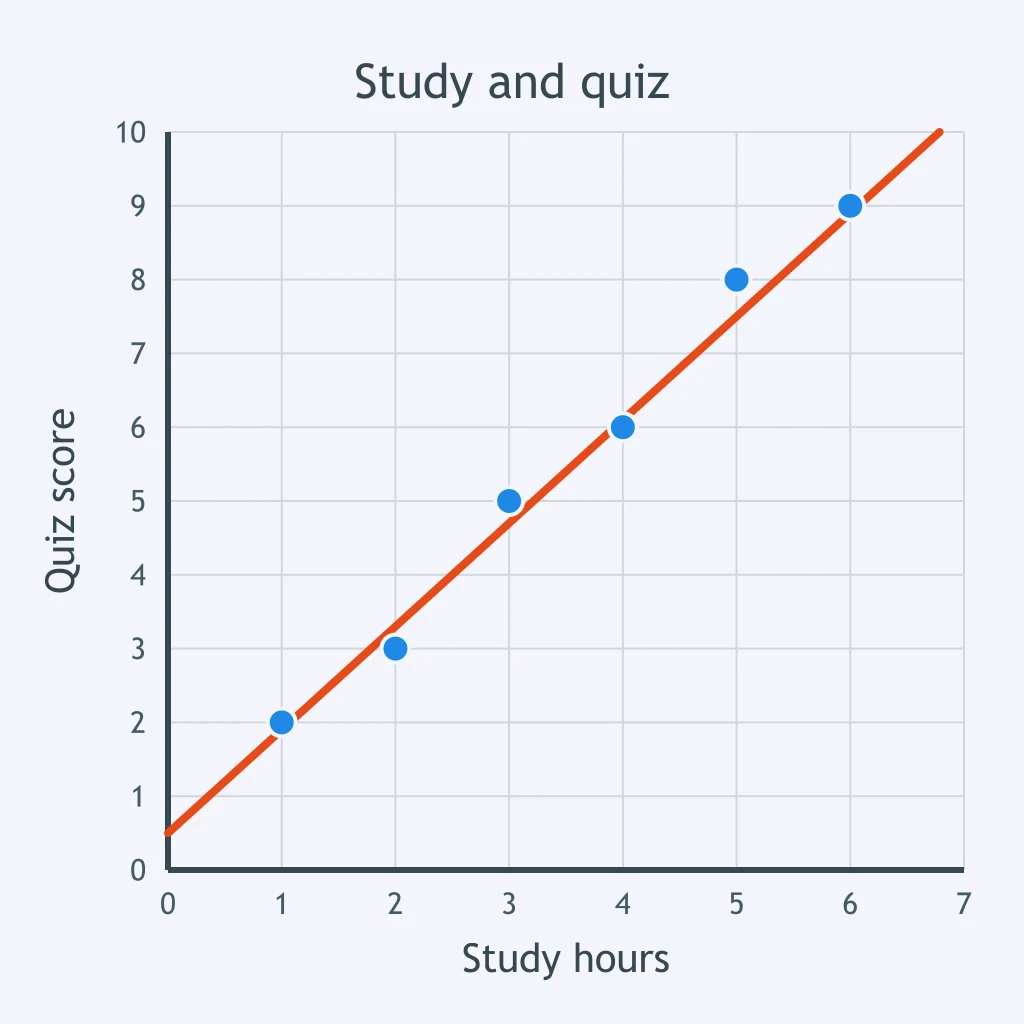
Use the scatterplot of sleep hours and errors. The relationship is best described as what?
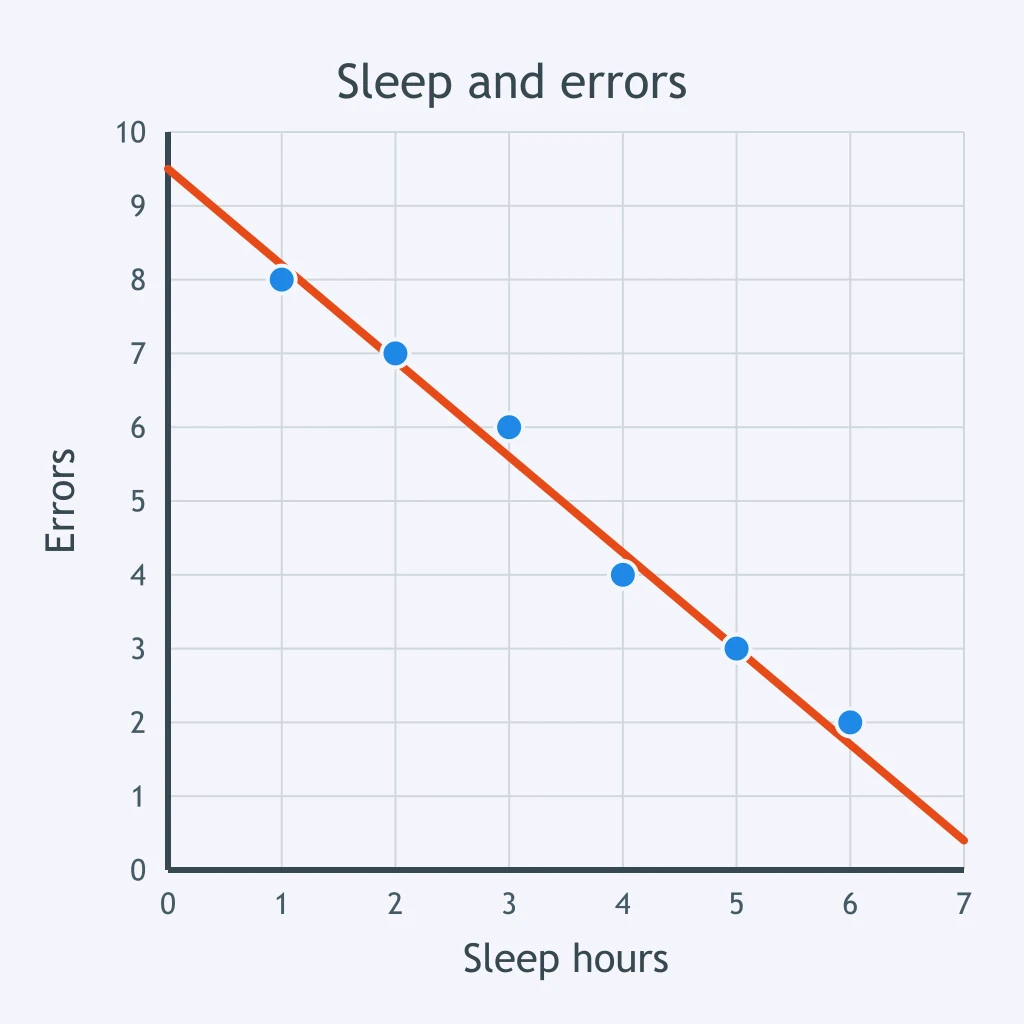
Use the scatterplot of text messages and test scores. The relationship is best described as what?
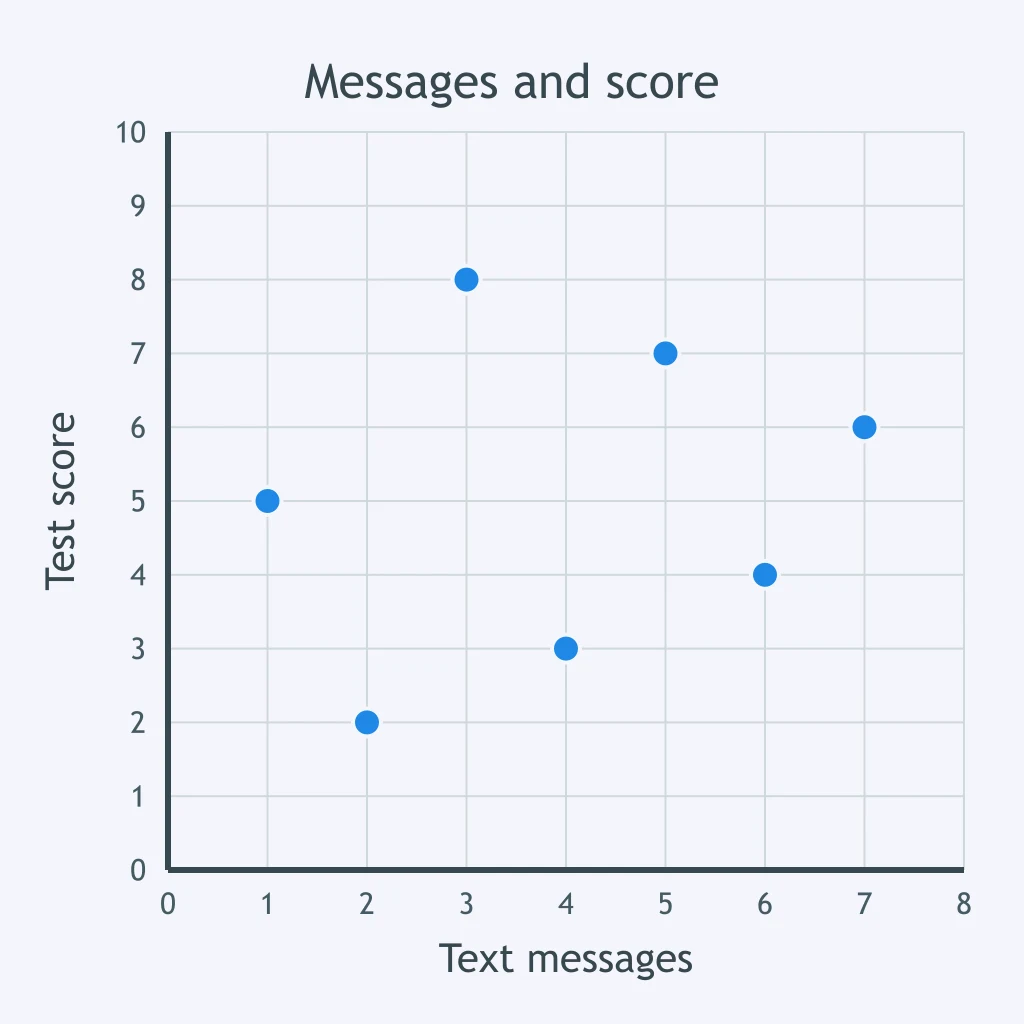
Crack the passcode before the zombies get in.
Answer, then swat bugs for bonus points.
Race through questions at your own speed.
Same question on every screen. Fastest wins.

Pick a tile, answer, hit bonuses and steals.
Heredity, Environment and Evolution
20 questions