Loading
by BlastRoom
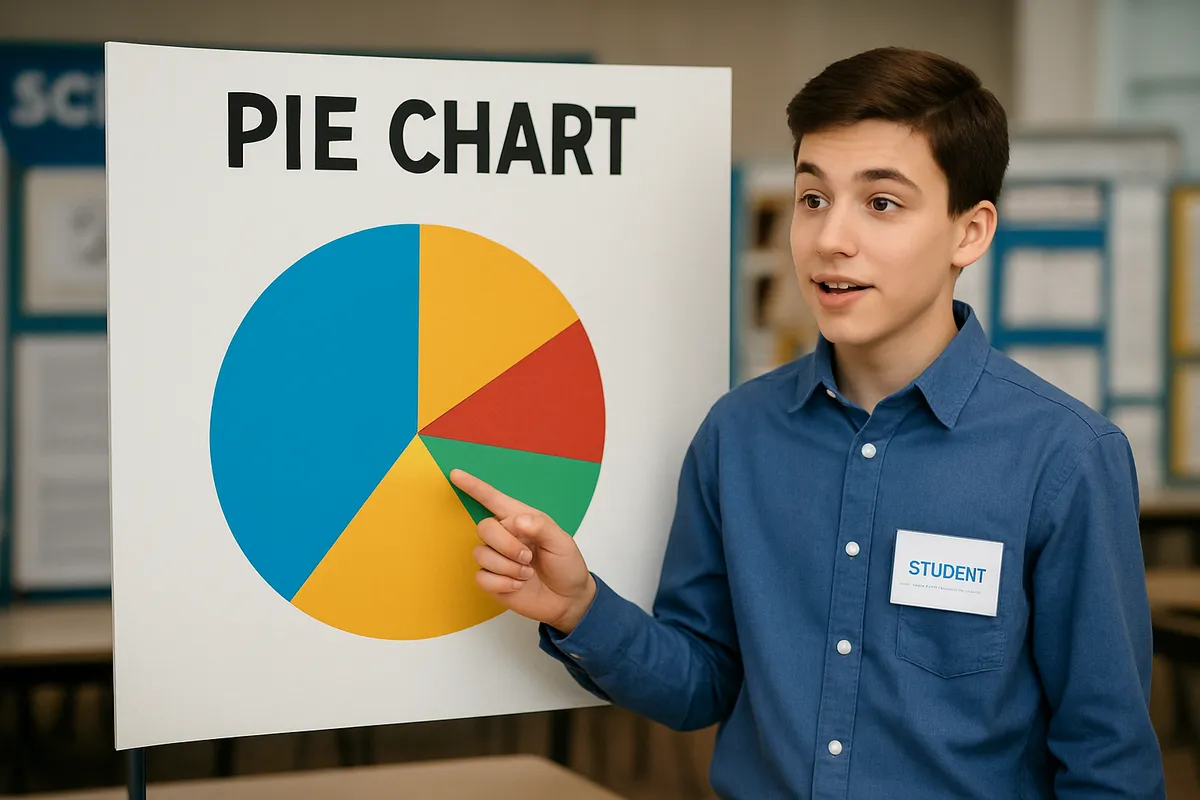
Read circle graphs to compare parts and totals.
#us_grade_7_math
40 questions
One question set, multiple game modes. Tap any game to see it in action. Not sure which to pick?
Answer to place stones and capture territory.
Outrun the snow together.
Earn blasts, then hunt the other team.
Answer to earn energy, then climb.

The class blasts through walls together.
Bid on mystery lots. Most money wins.
Sell tours. Nice, standard, or a total scam.

Answer, restock, and serve the rush.
More correct answers pulls the rope your way.
Answer, then shoot down the alien wave.
Answer, then tap to leap the frozen ridge.
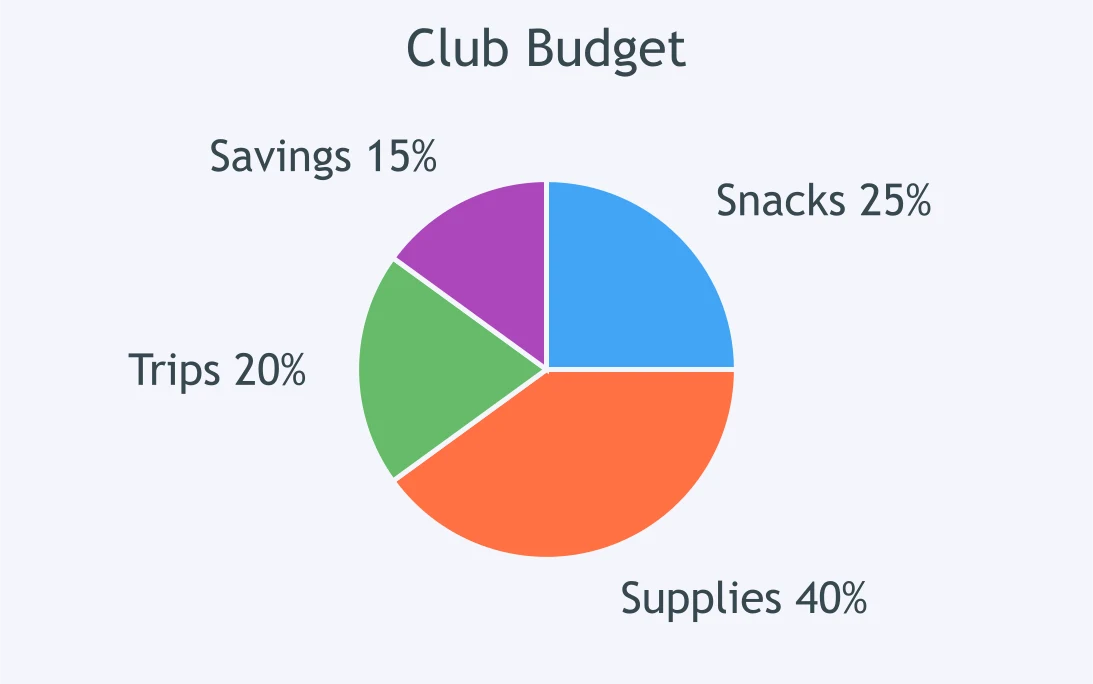
Use the Club Budget circle graph. The total budget is $600. How much is for Supplies?
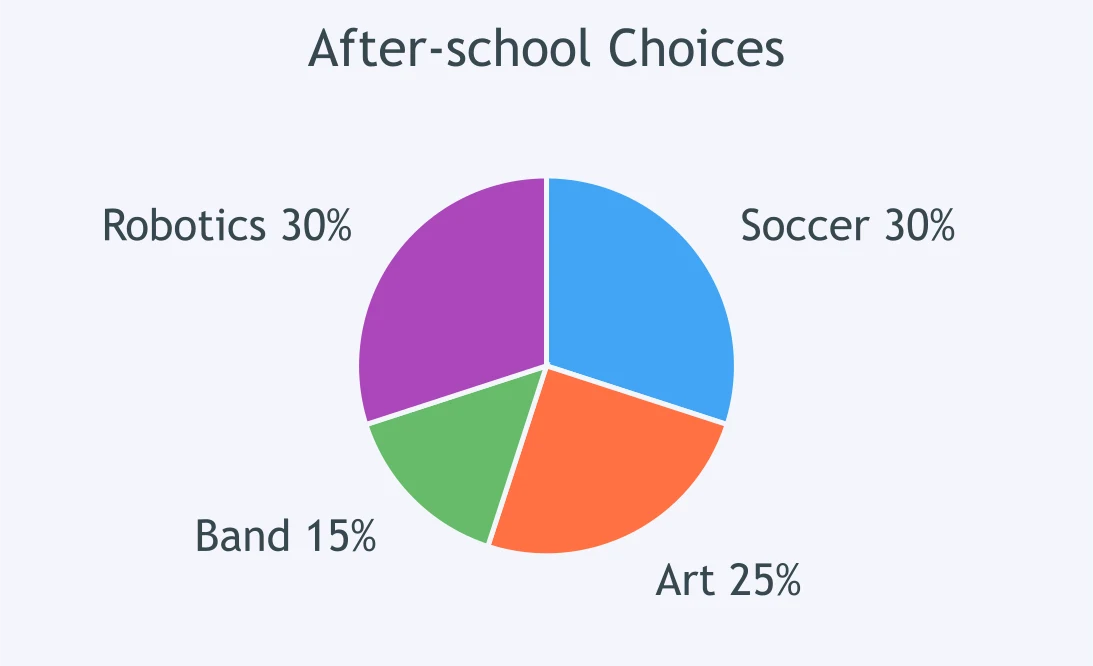
The After-school Choices circle graph shows student responses. If 180 students responded, how many chose Art?
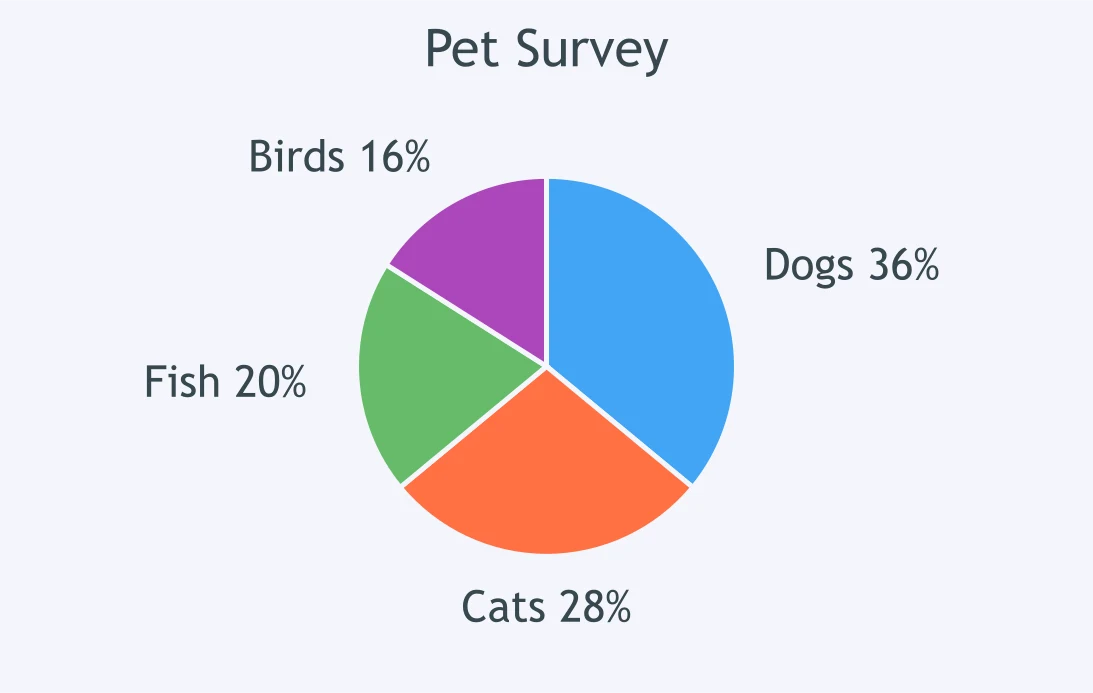
The Pet Survey circle graph shows the pets by type. Out of 250 pets, how many are Cats?
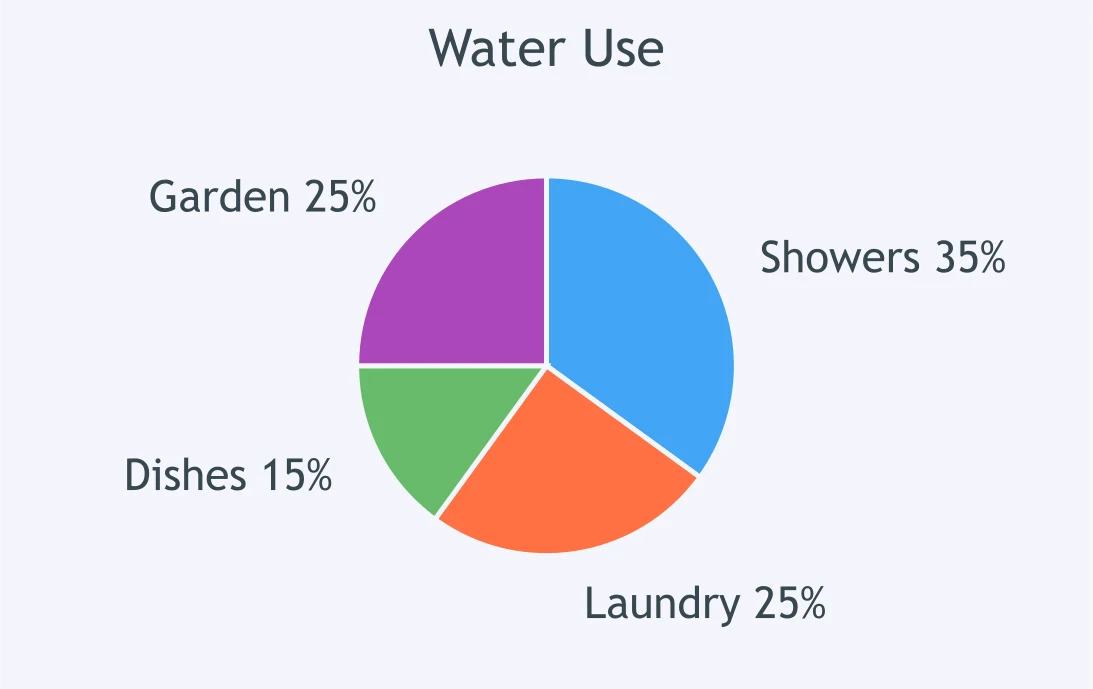
A circle graph shows Water Use by category. The total is 800 liters. How many liters are Showers?
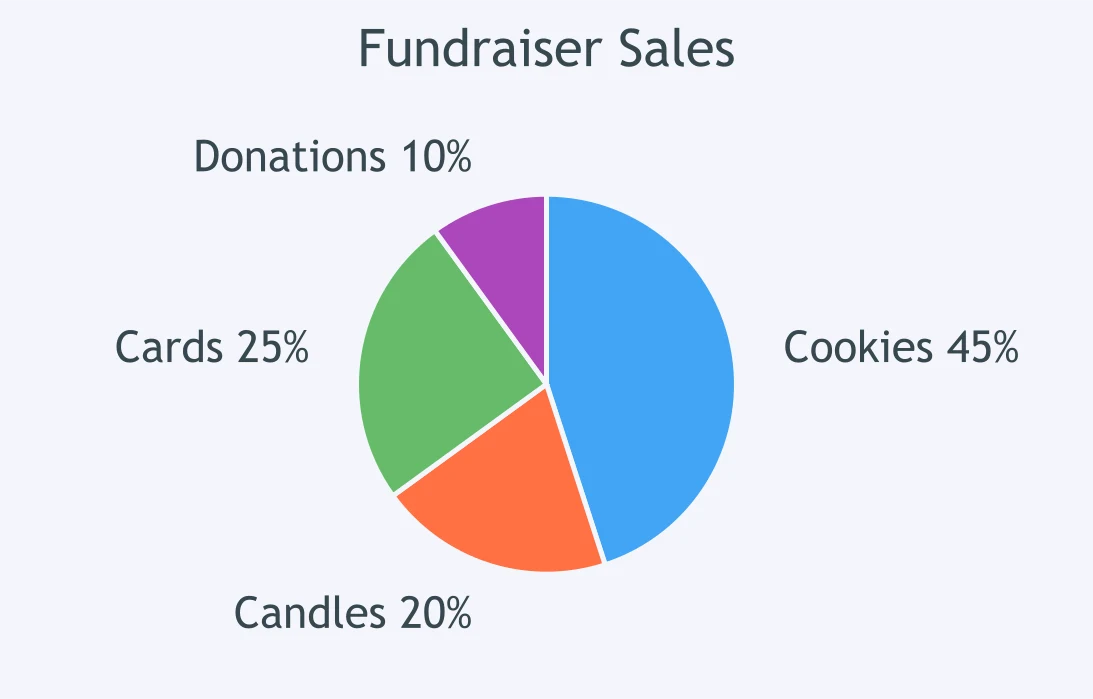
The Fundraiser Sales circle graph shows how sales were divided. Total sales are $900. How much came from Cards?
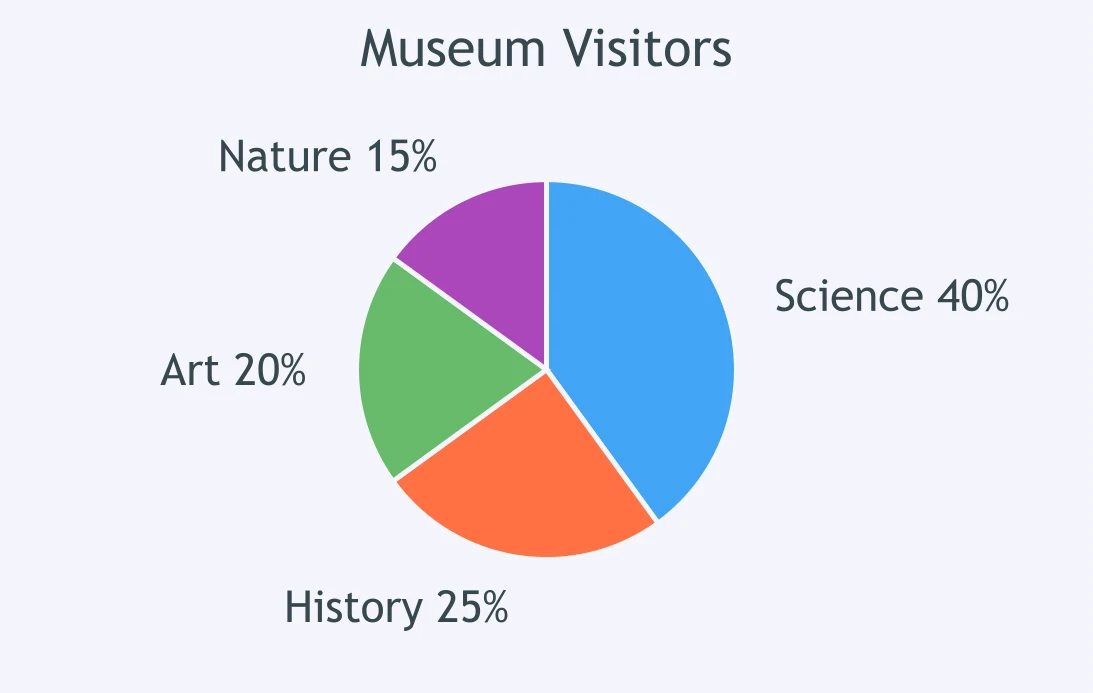
A museum circle graph shows visitors by exhibit area. If 360 visitors came, how many visited Nature?
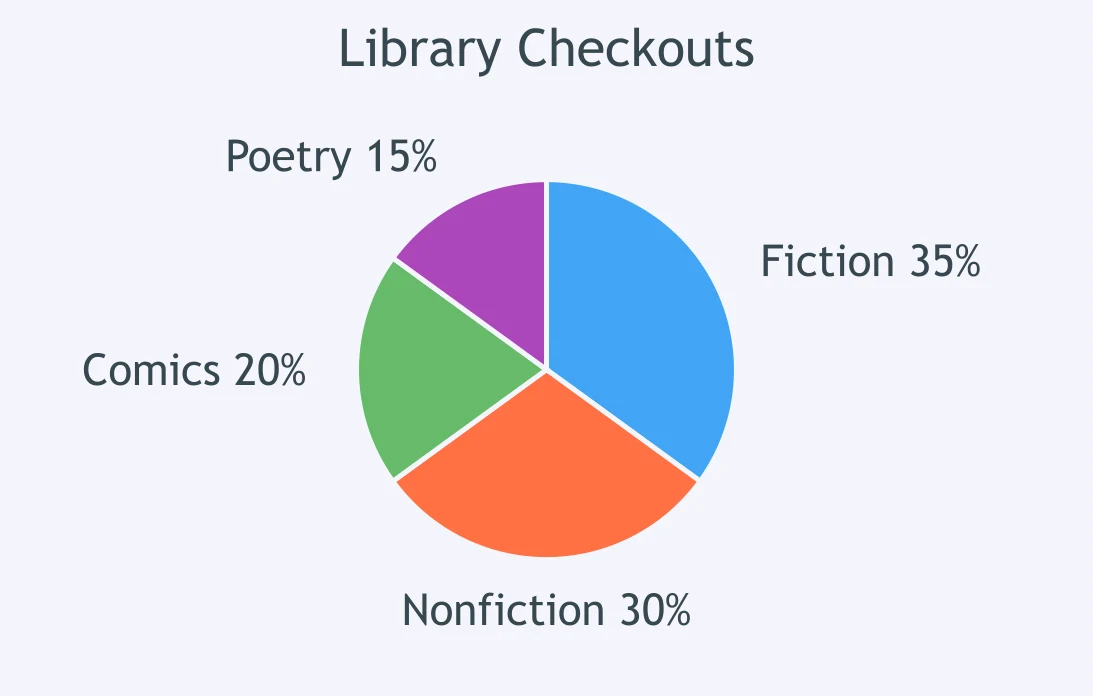
The Library Checkouts circle graph shows checkout categories. With 420 checkouts, how many were Nonfiction?
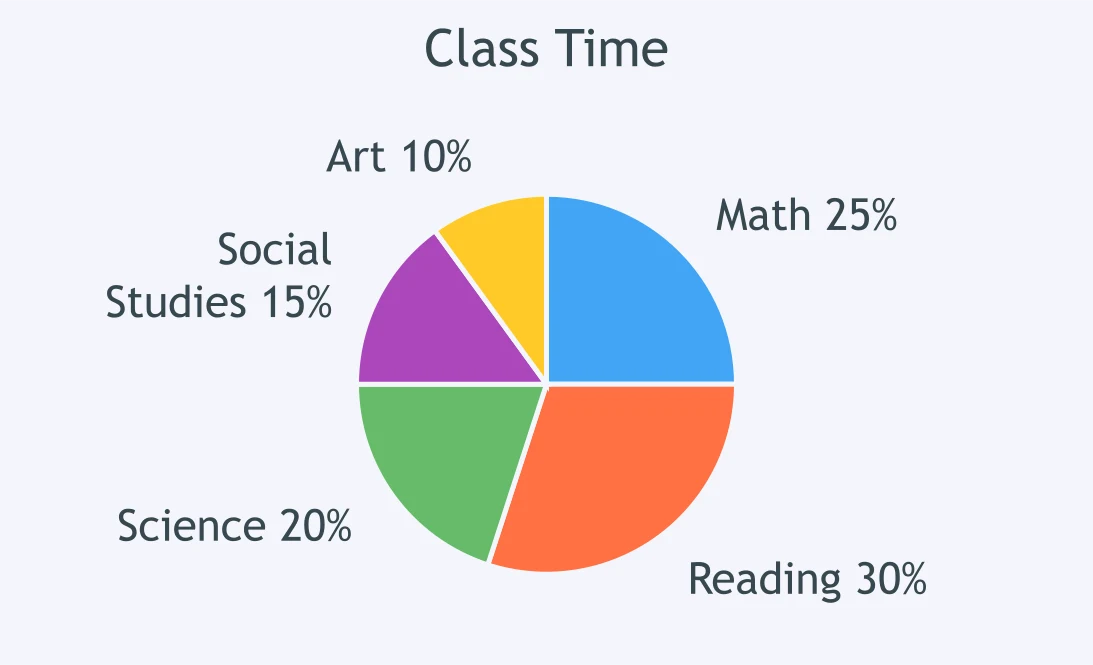
A Class Time circle graph shows how class minutes are allocated. Of 300 minutes, how many are Science?
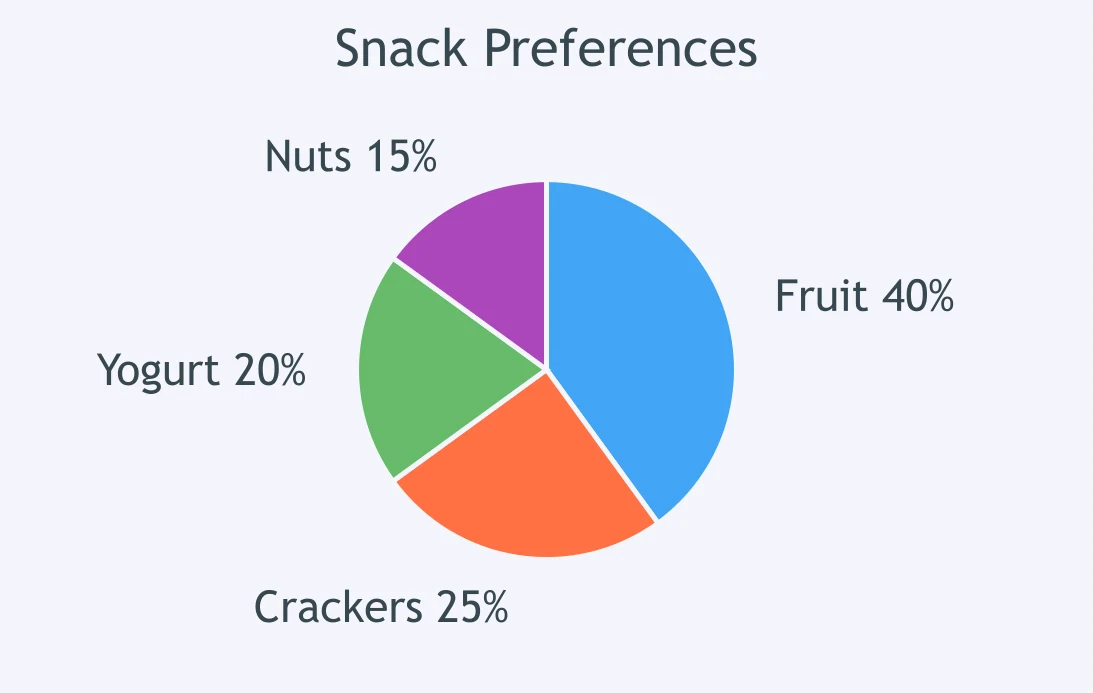
The Snack Preferences circle graph shows student choices. For 160 students, how many chose Crackers?
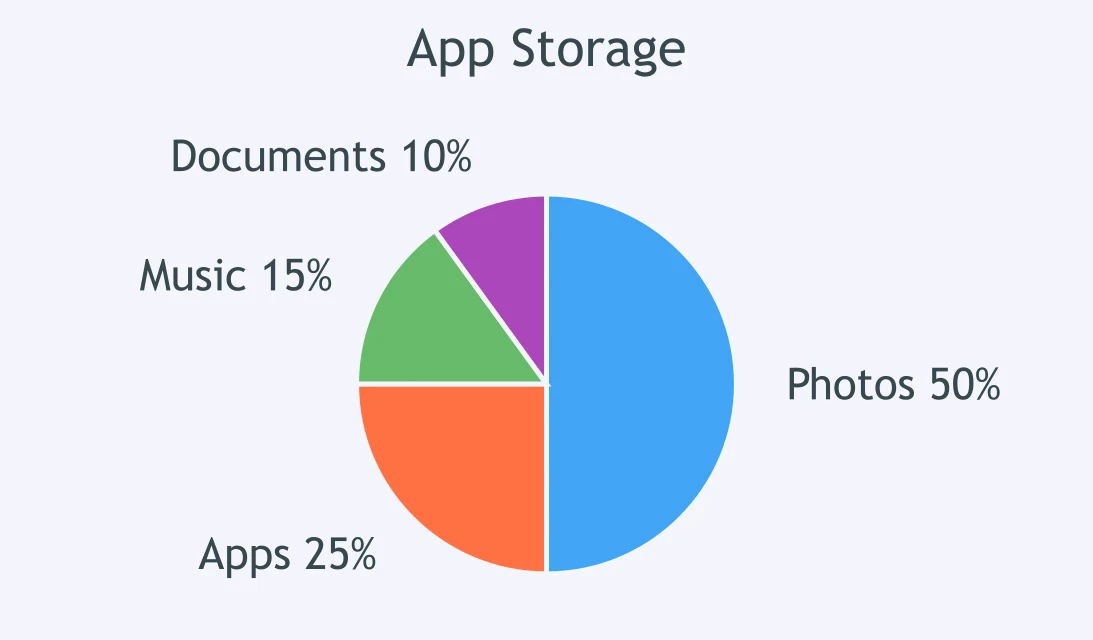
An App Storage circle graph shows how storage is used. On 64.0 GB total, how much is Music?
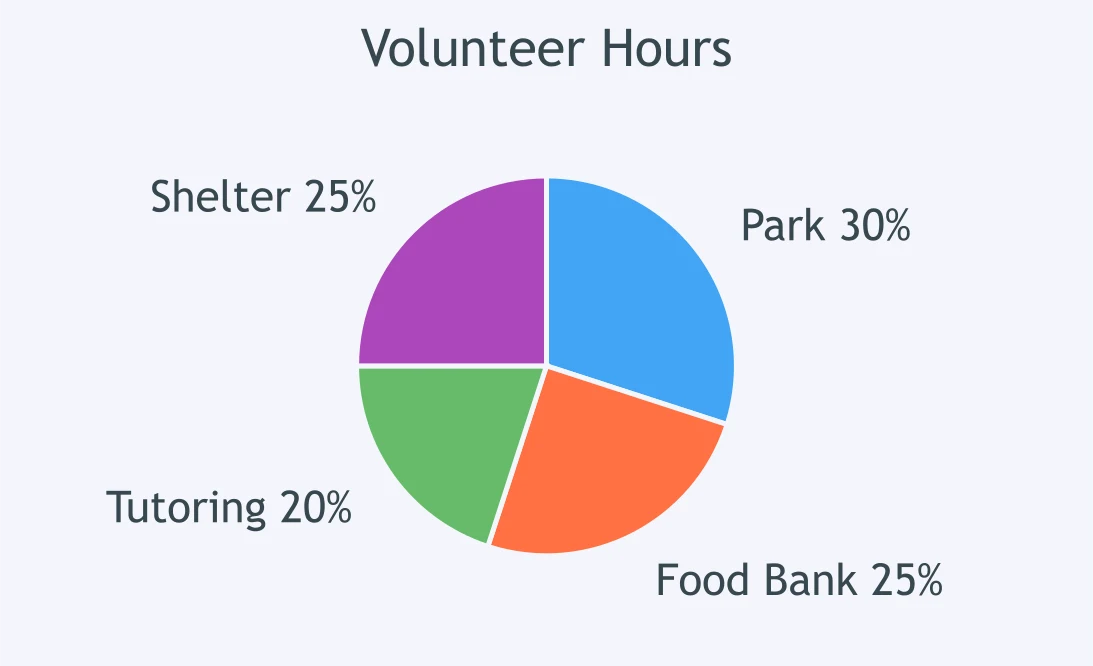
The Volunteer Hours circle graph shows how the hours were spent. Out of 240 hours, how many are Park?
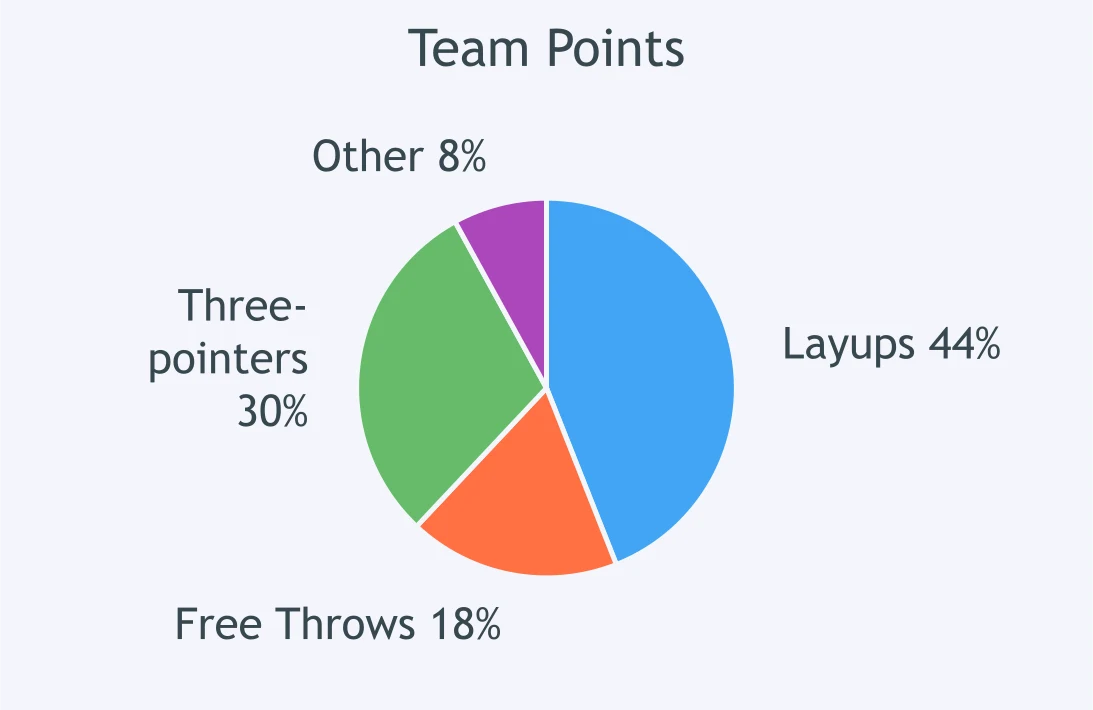
A Team Points circle graph shows scoring categories. Of 500 points, how many were Free Throws?
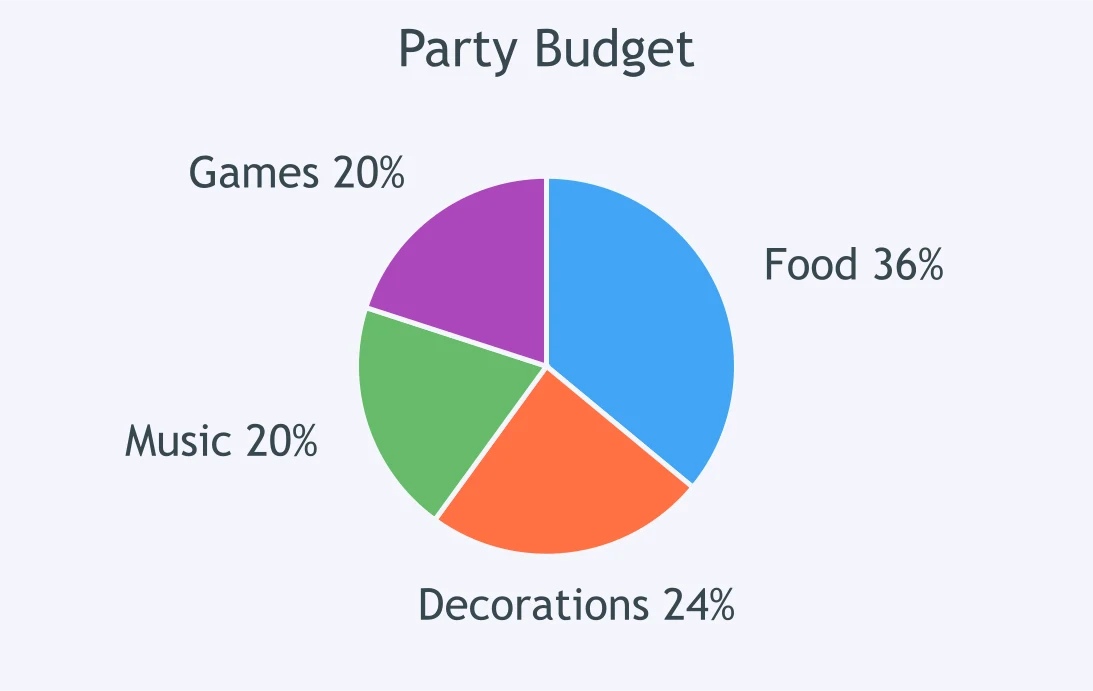
The Party Budget circle graph shows budget categories. The budget is $750. How much is for Decorations?
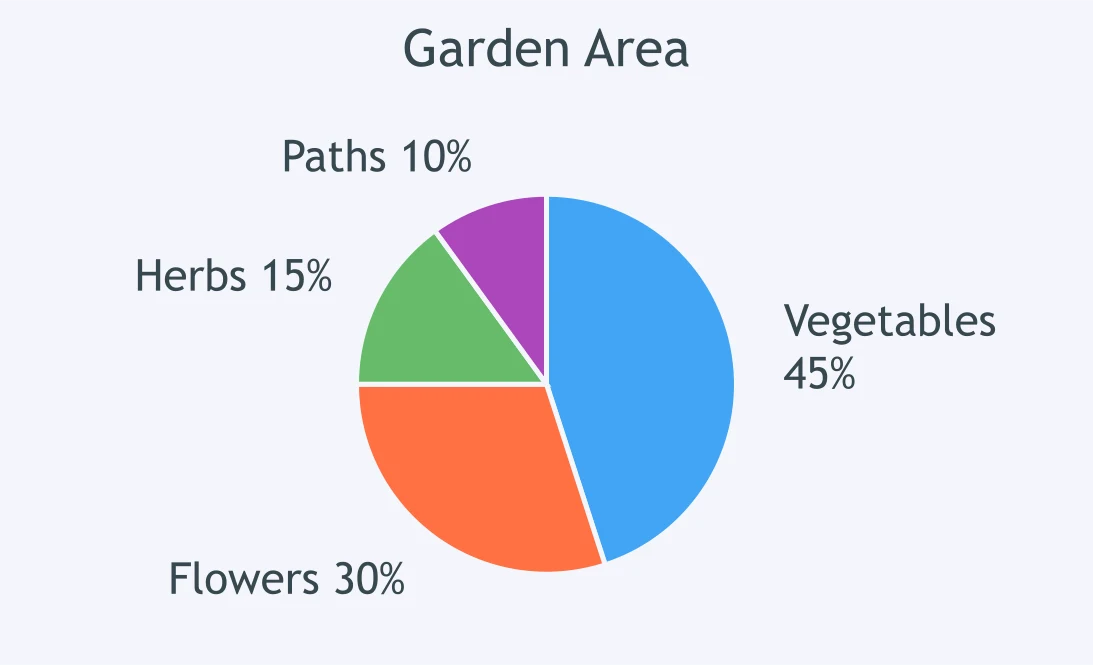
A Garden Area circle graph shows how the area is used. The total area is 200 square meters. How large is Herbs?
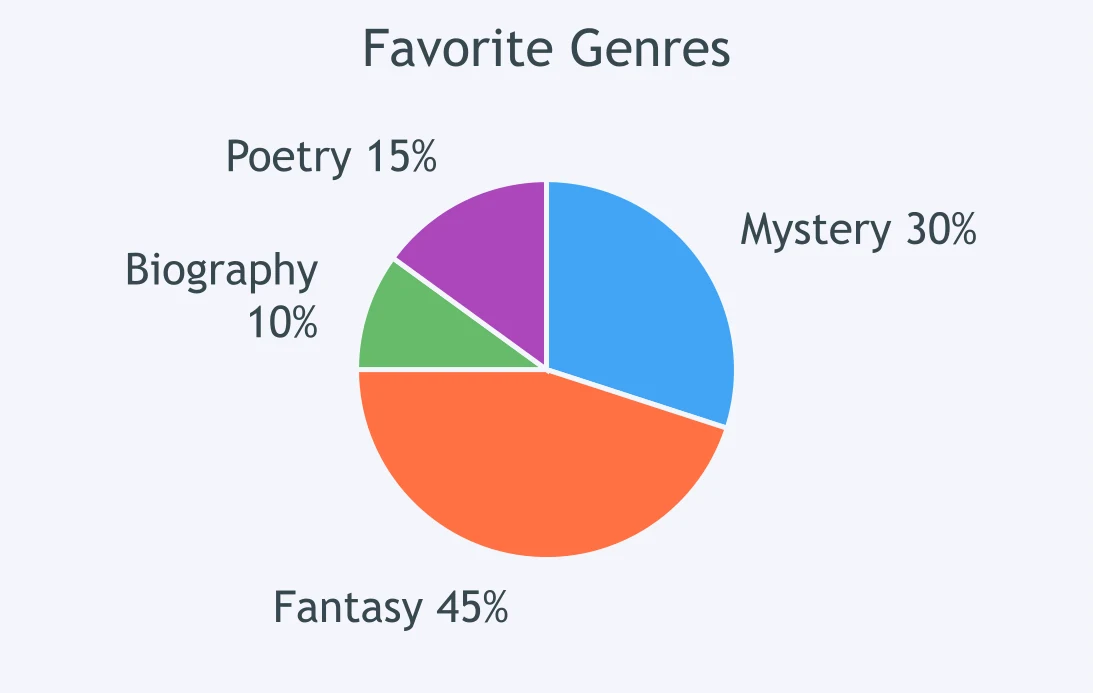
A Favorite Genres circle graph shows survey results. What is the ratio of Fantasy to Mystery?
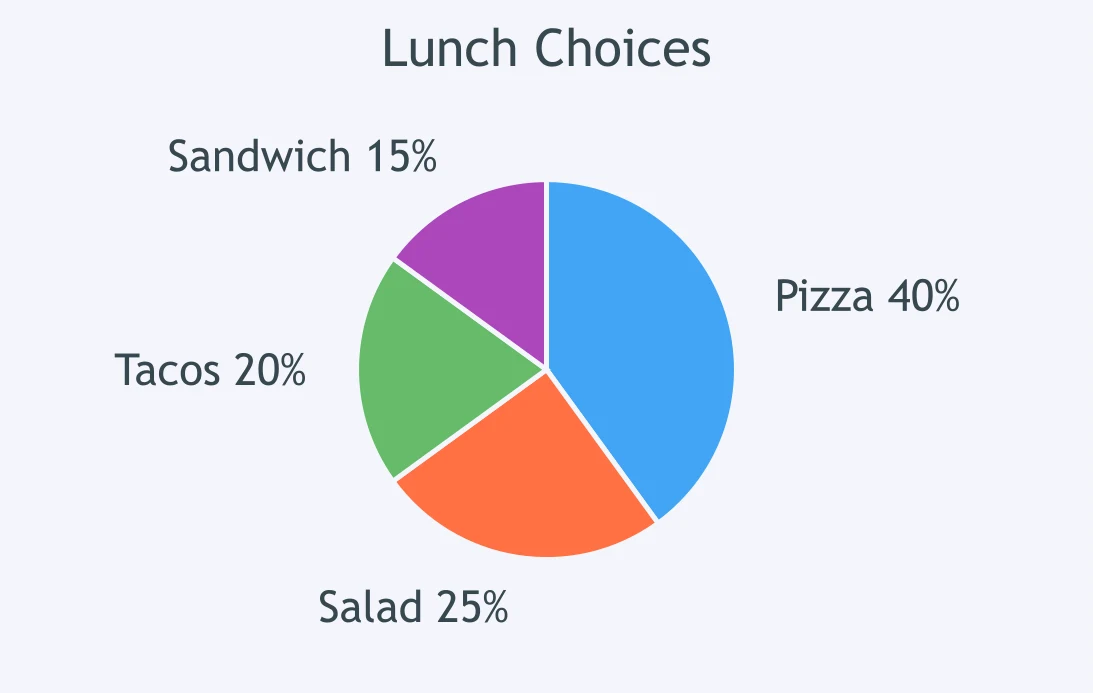
The Lunch Choices circle graph compares lunch options. What is the ratio of Pizza to Salad?
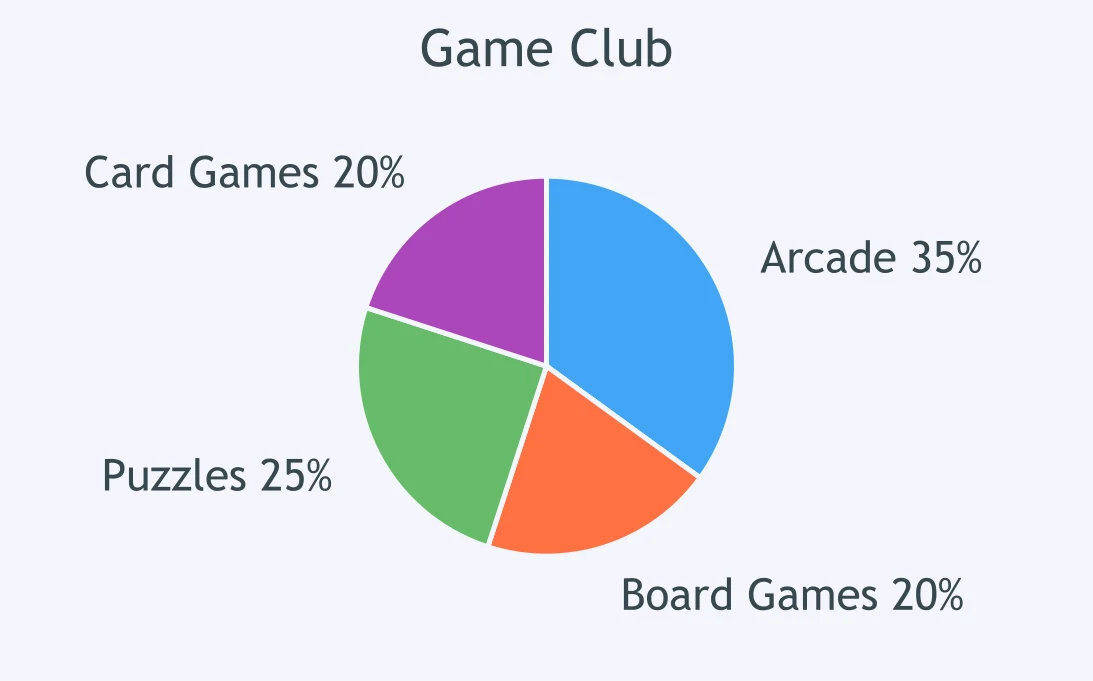
A Game Club circle graph shows preferred activities. What is the ratio of Puzzles to Arcade?
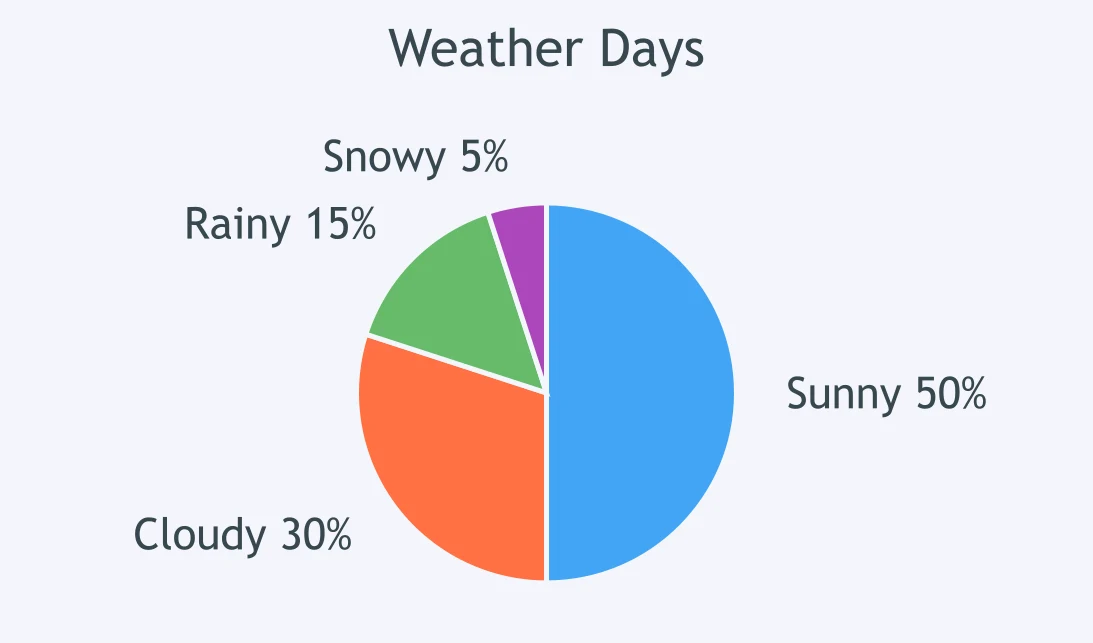
The Weather Days circle graph shows types of days. What is the ratio of Cloudy days to Rainy days?
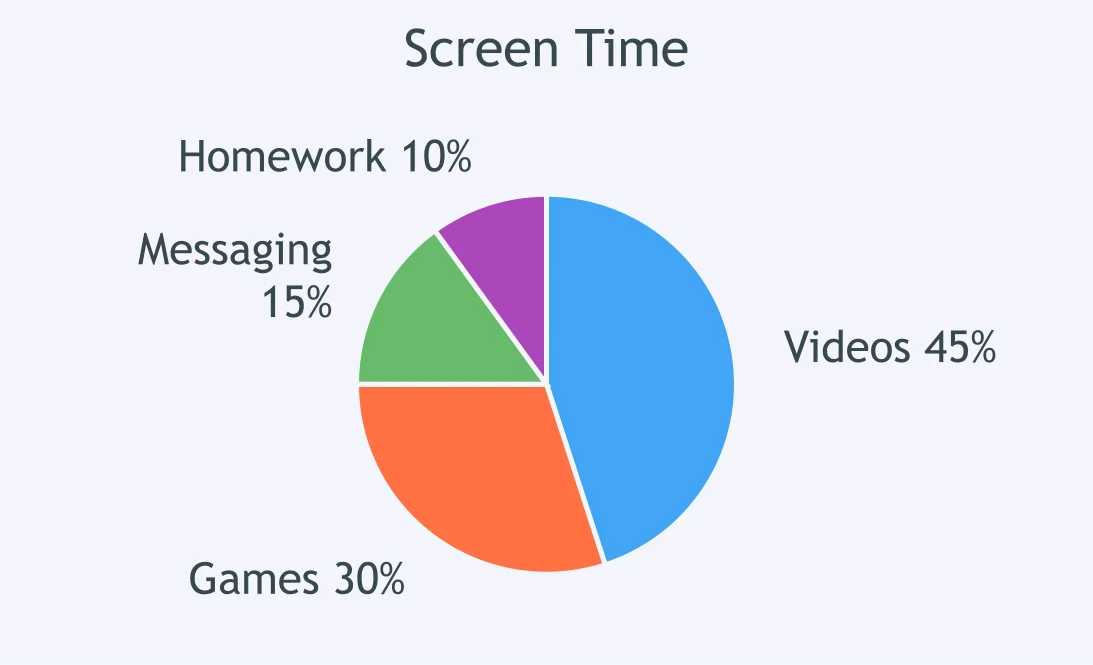
A Screen Time circle graph shows activity categories. What is the ratio of Games to Videos?
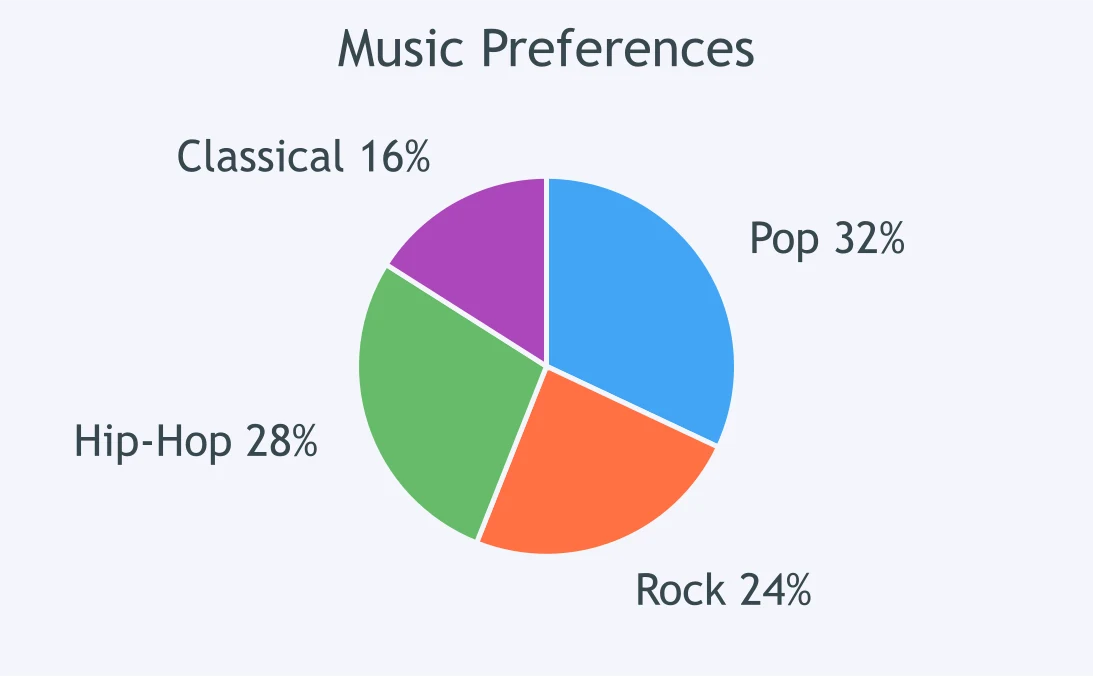
The Music Preferences circle graph gives the survey results. What is the ratio of Pop to Rock?
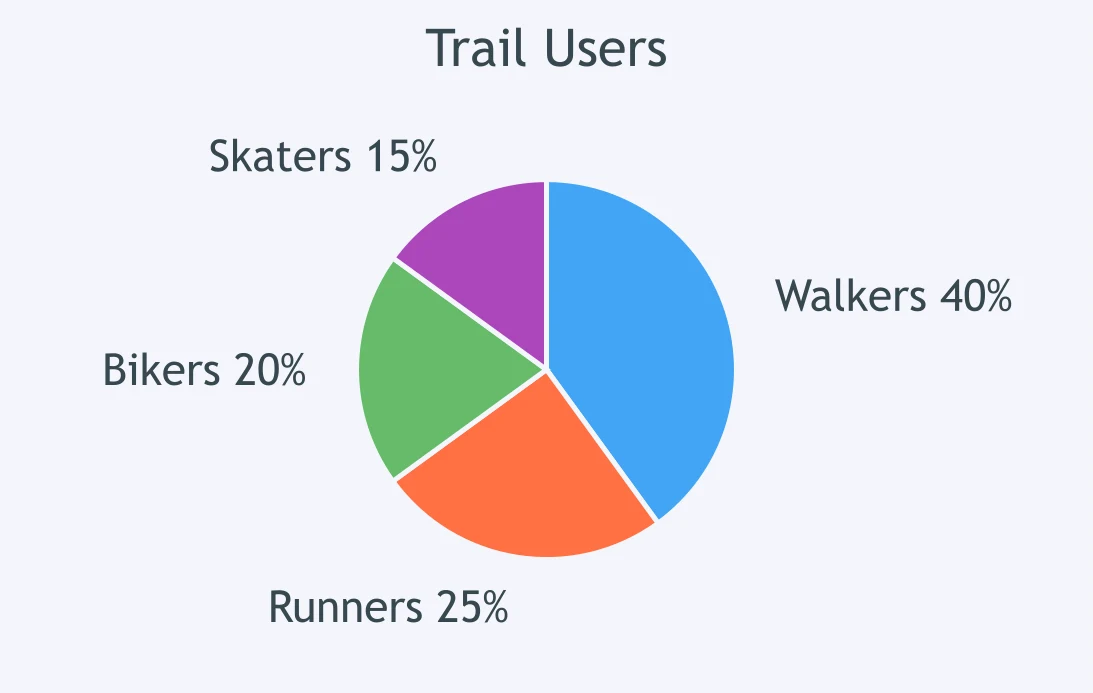
A Trail Users circle graph shows how people used the trail. What is the ratio of Bikers to Walkers?
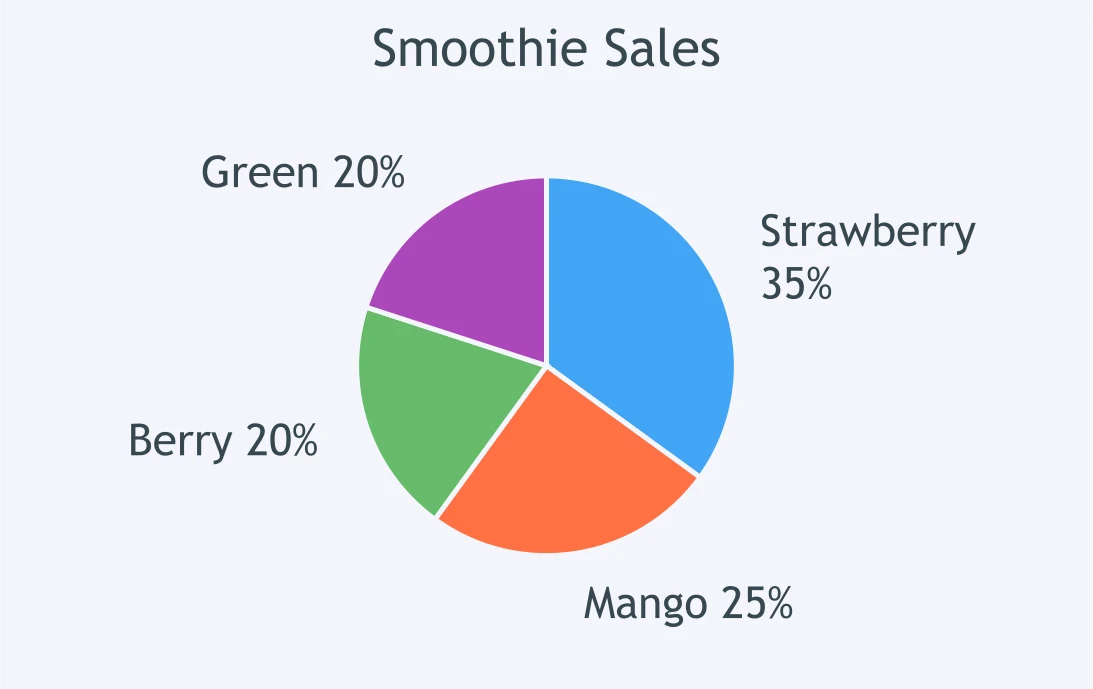
The Smoothie Sales circle graph shows sales by flavor. What is the ratio of Strawberry to Mango?
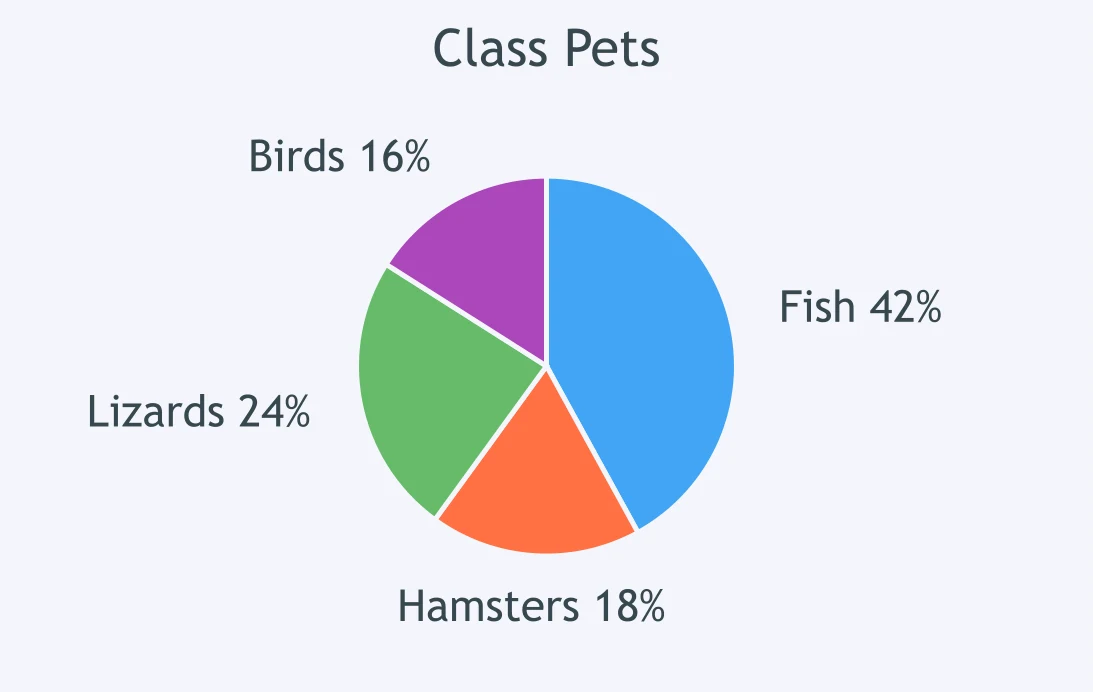
A Class Pets circle graph shows pet types. What is the ratio of Lizards to Hamsters?
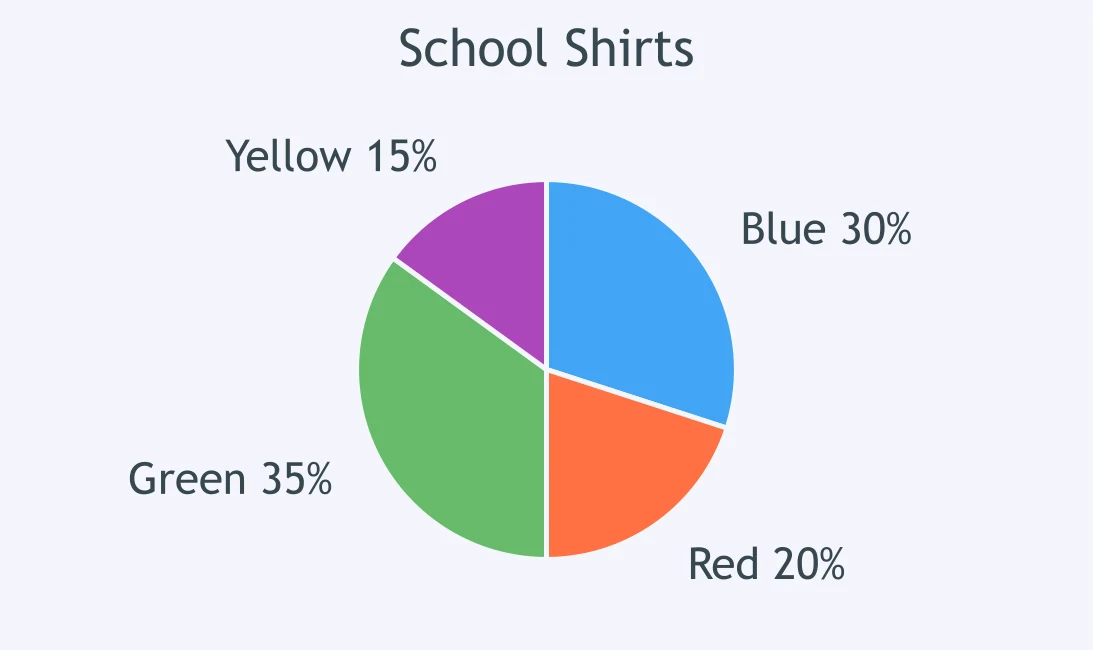
The School Shirts circle graph shows shirt colors. What is the ratio of Blue to Yellow?
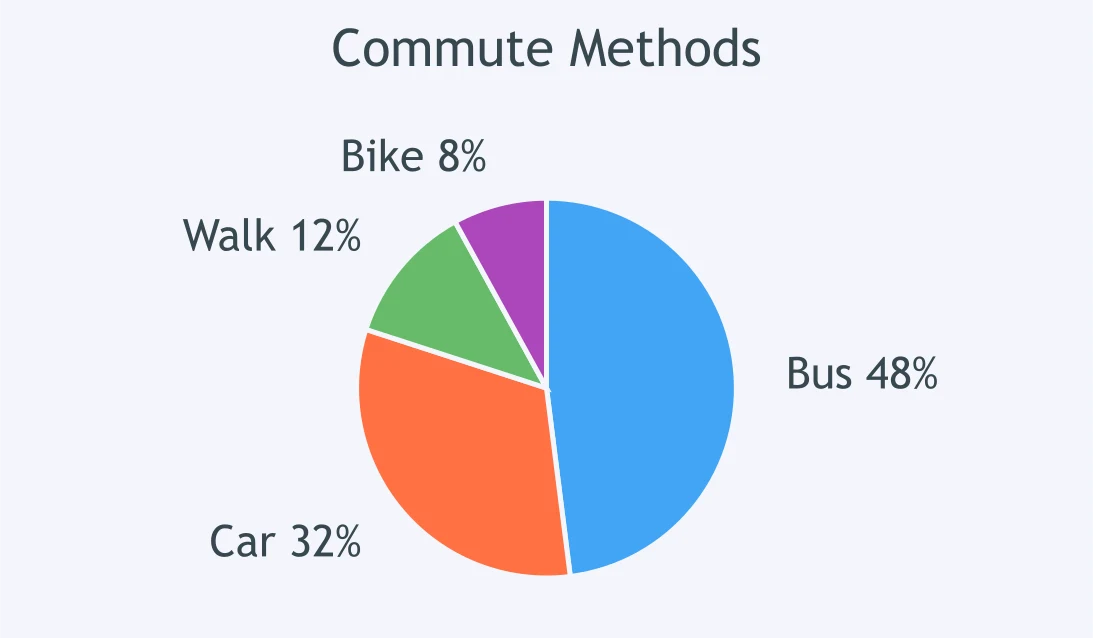
A Commute Methods circle graph shows how students commute. What is the ratio of Bus to Car?
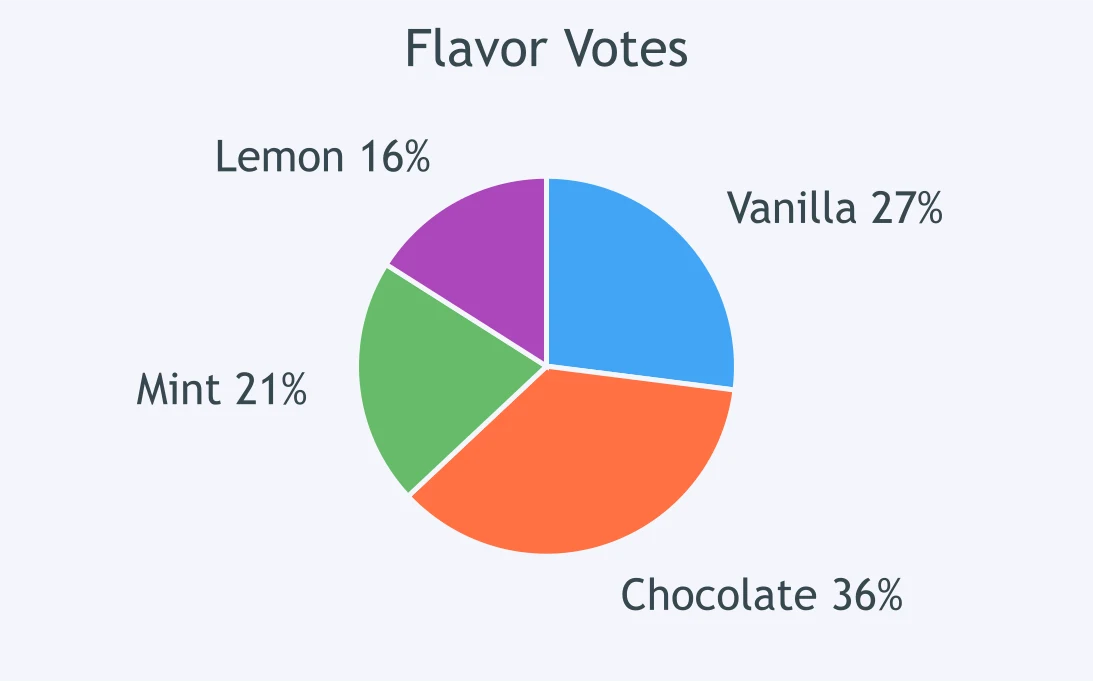
The Flavor Votes circle graph shows votes by flavor. What is the ratio of Chocolate to Vanilla?
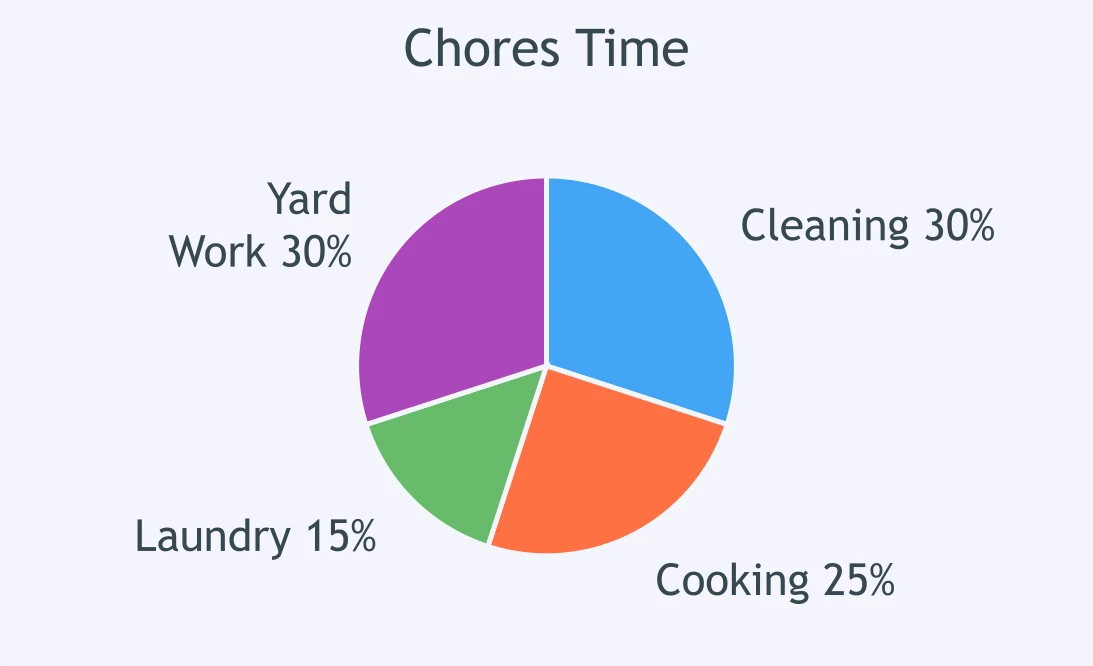
A Chores Time circle graph shows time spent on chores. What is the ratio of Laundry to Cooking?
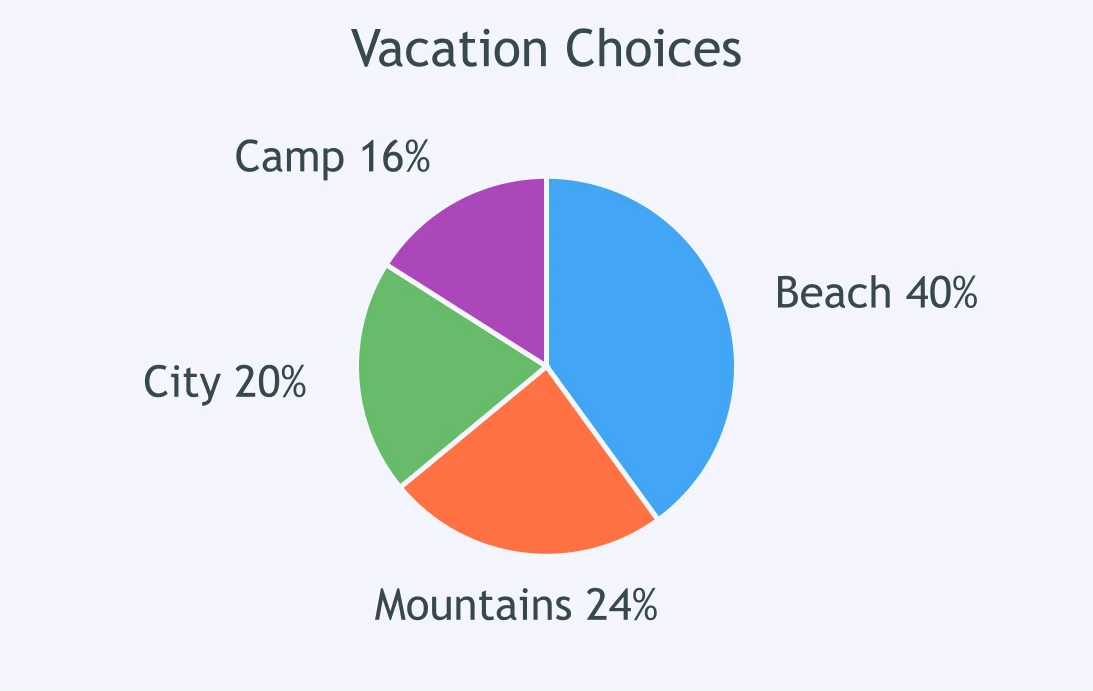
The Vacation Choices circle graph shows preferred destinations. What is the ratio of Beach to Mountains?
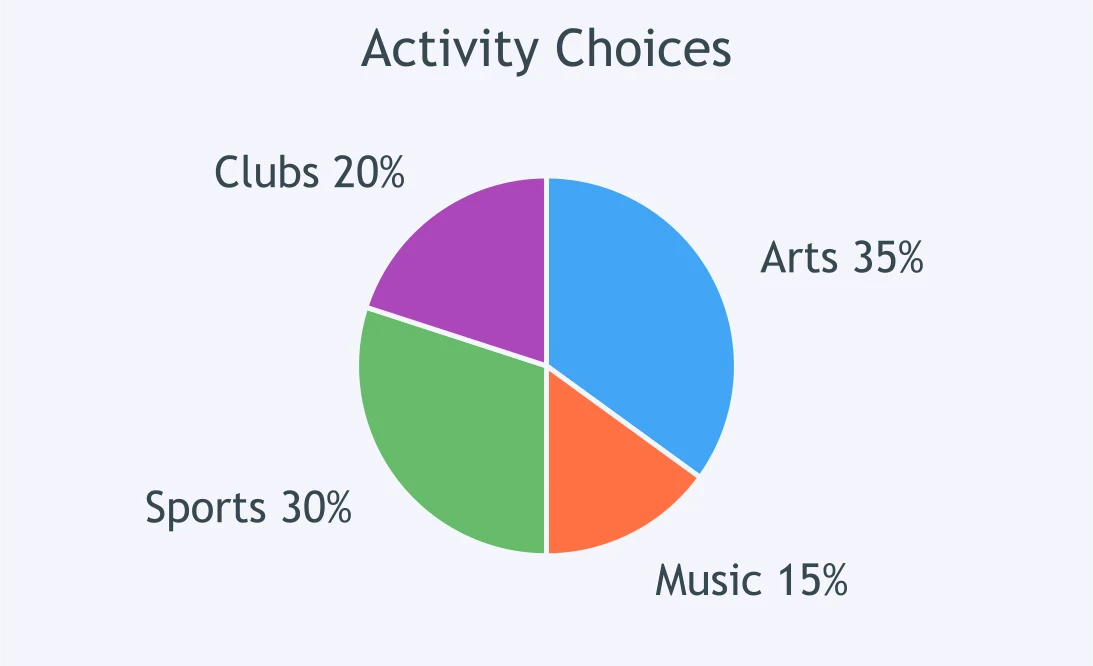
A circle graph shows activity choices for 200 students. How many students chose Arts or Music?
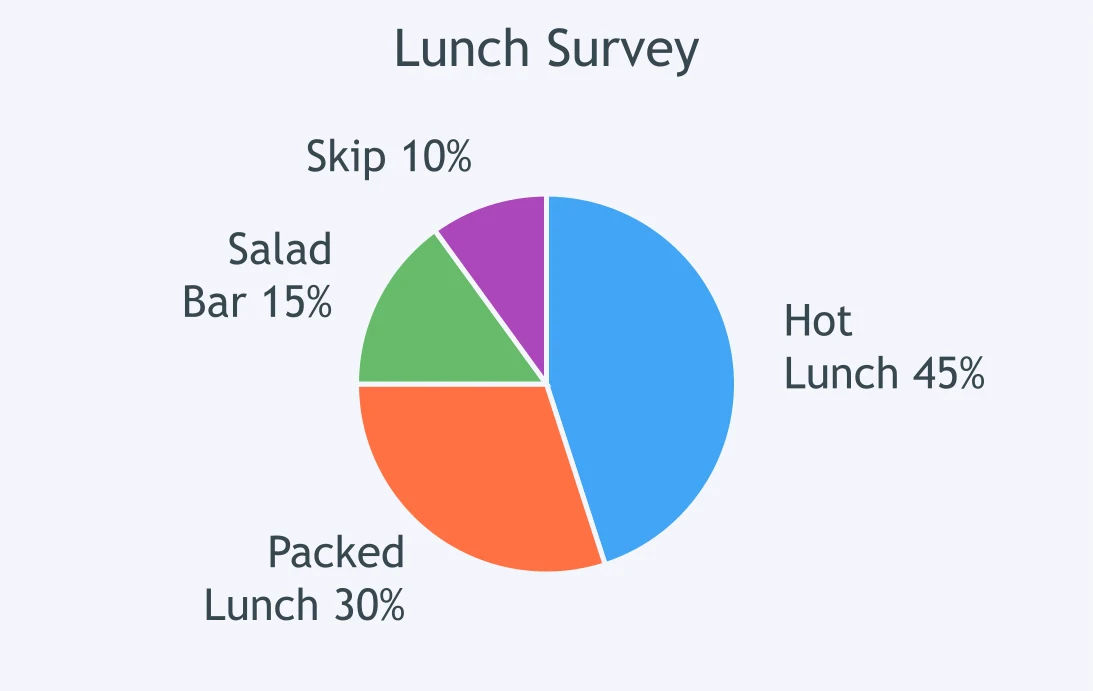
The Lunch Survey circle graph shows students' lunch choices. Out of 300 students, how many chose Hot or Packed?
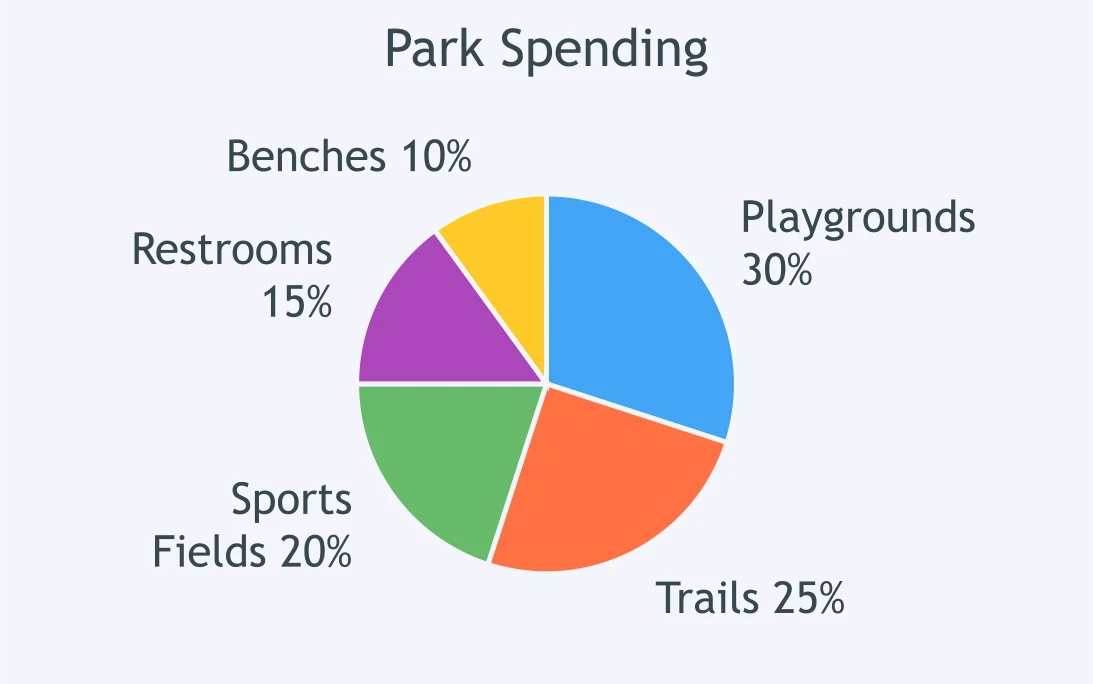
A Park Spending circle graph shows how the money is divided. Of $1,200, how much is Trails and Restrooms?
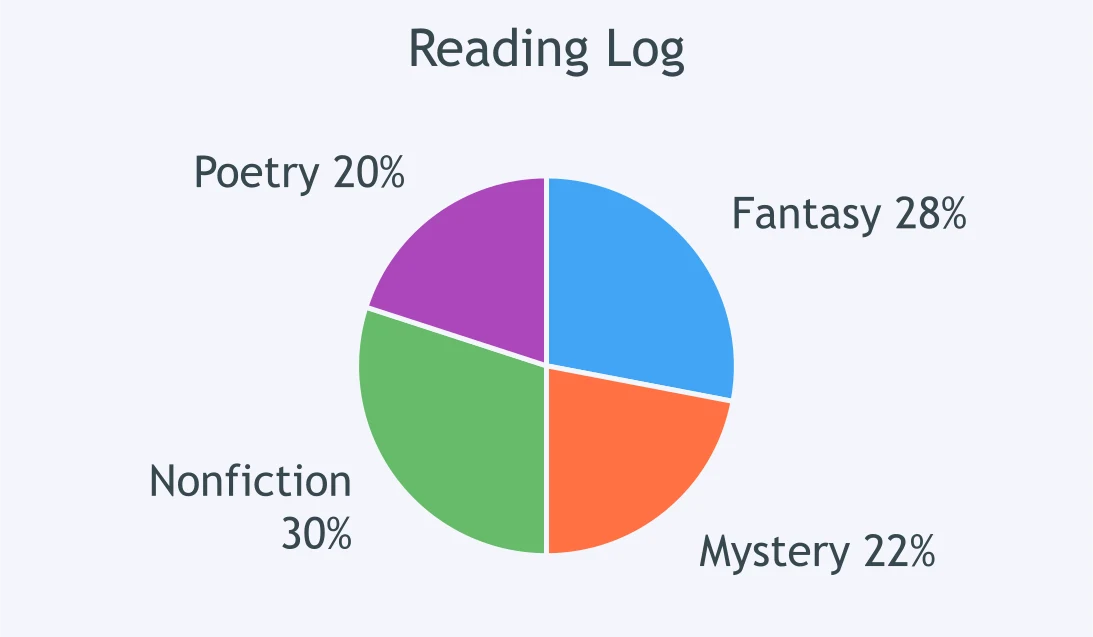
The Reading Log circle graph shows pages by genre. Of 500 pages, how many pages are Fantasy or Mystery?
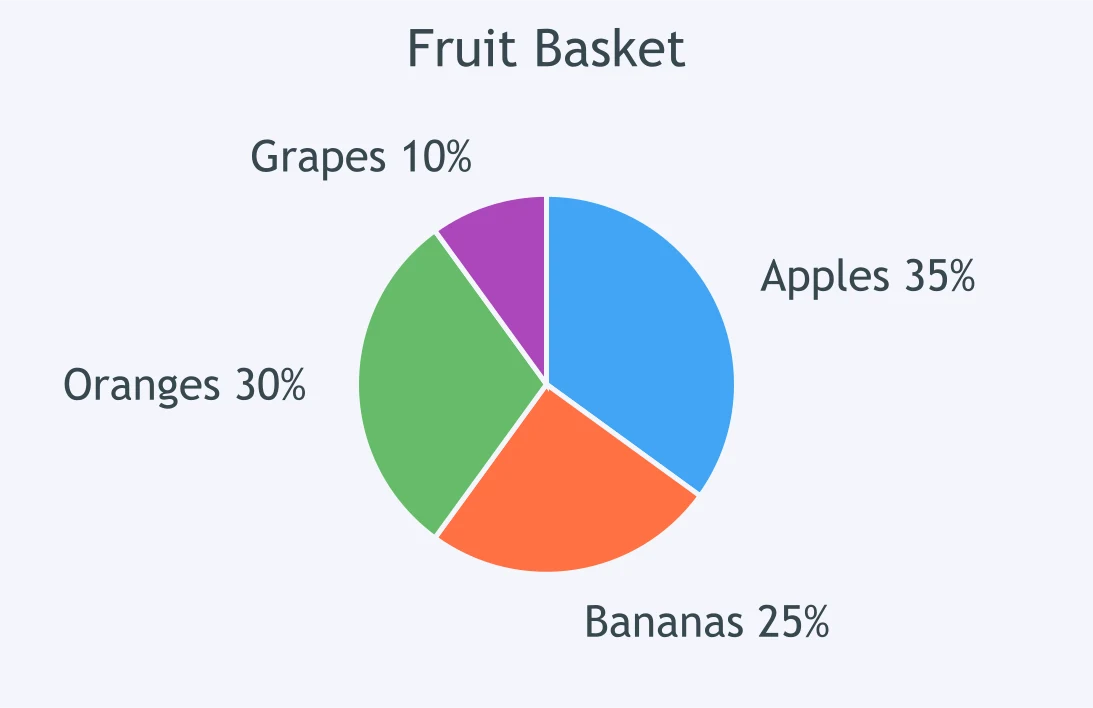
A Fruit Basket circle graph shows the kinds of fruit. If there are 80 pieces, how many are Bananas or Oranges?
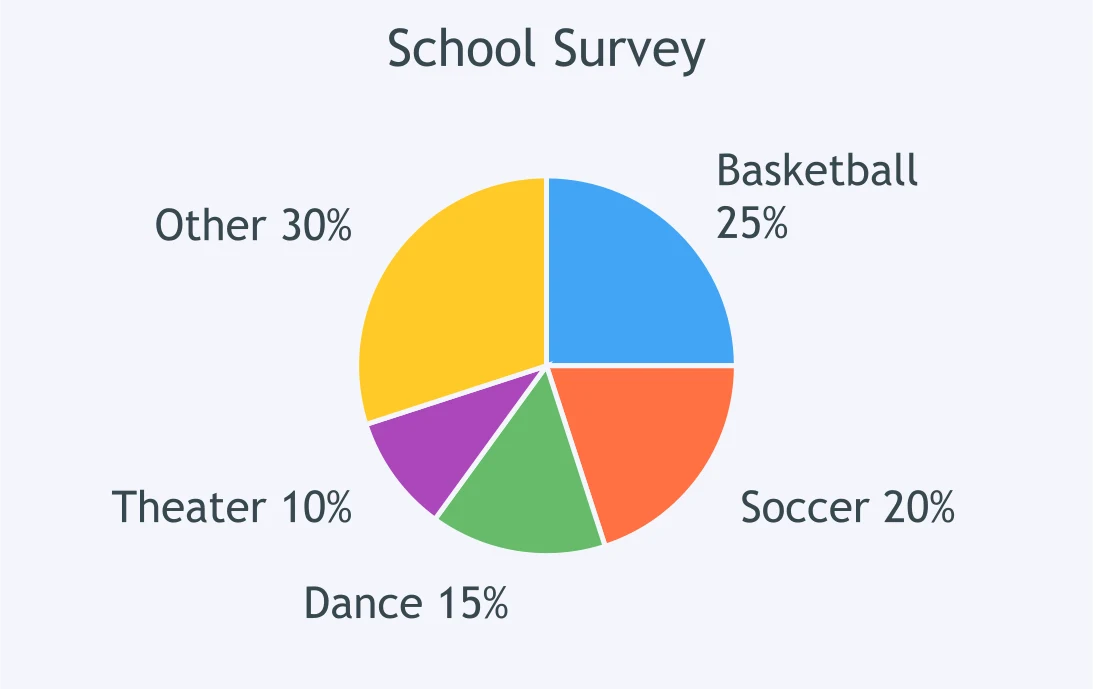
A School Survey circle graph shows students' choices. Out of 240 students, how many chose Basketball or Soccer?
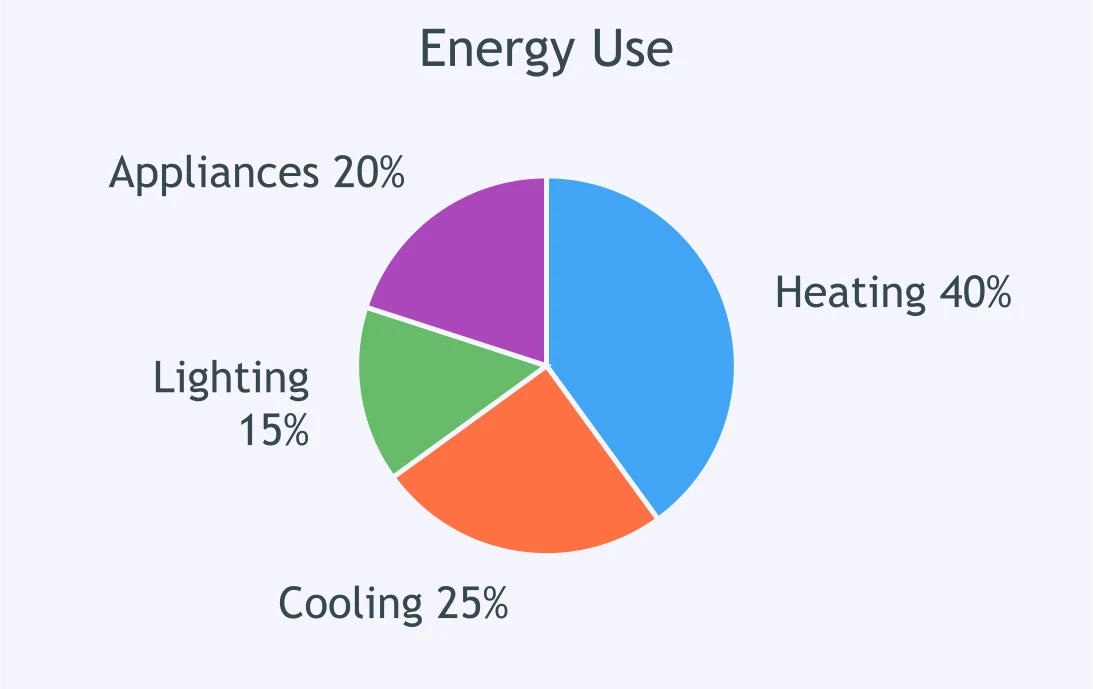
The Energy Use circle graph shows energy use by category. Out of 1,000 kWh, how much is Heating or Cooling?
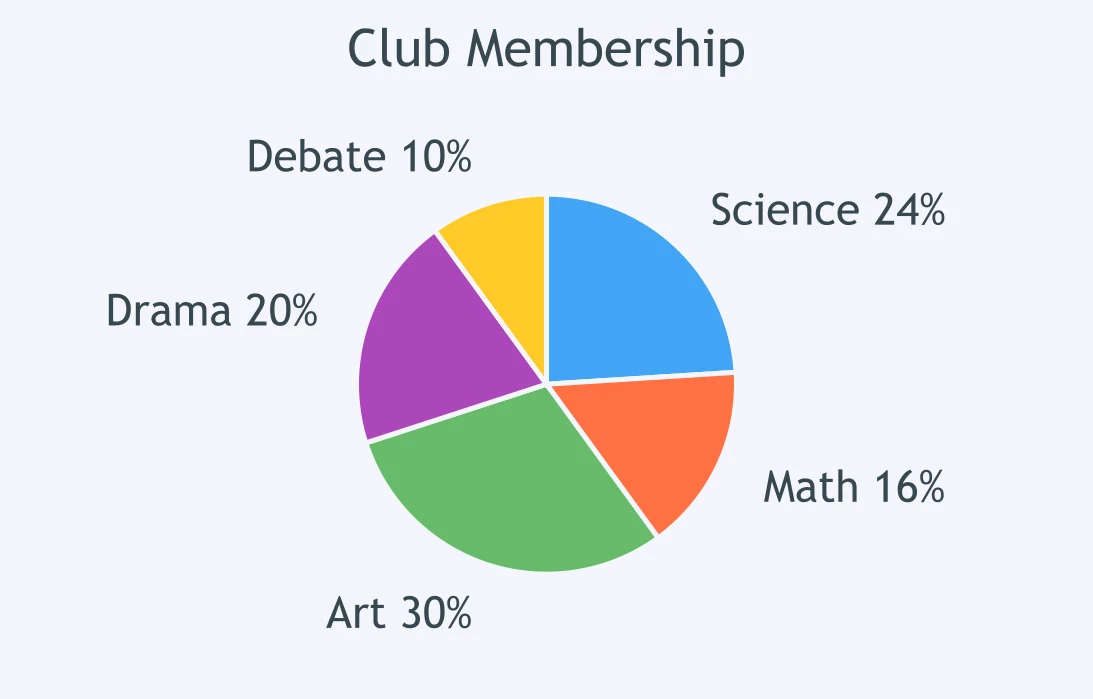
A Club Membership circle graph shows members by club. Of 150 members, how many are in Science or Math?
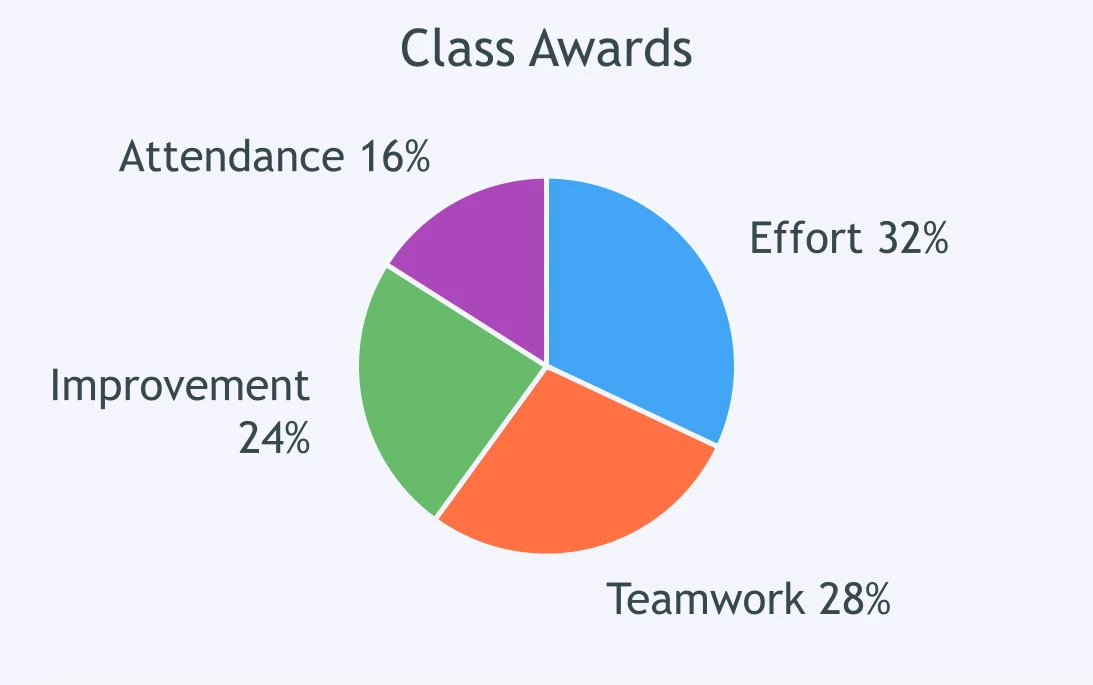
The Class Awards circle graph shows sticker categories. Of 75 stickers, how many were Effort or Teamwork?
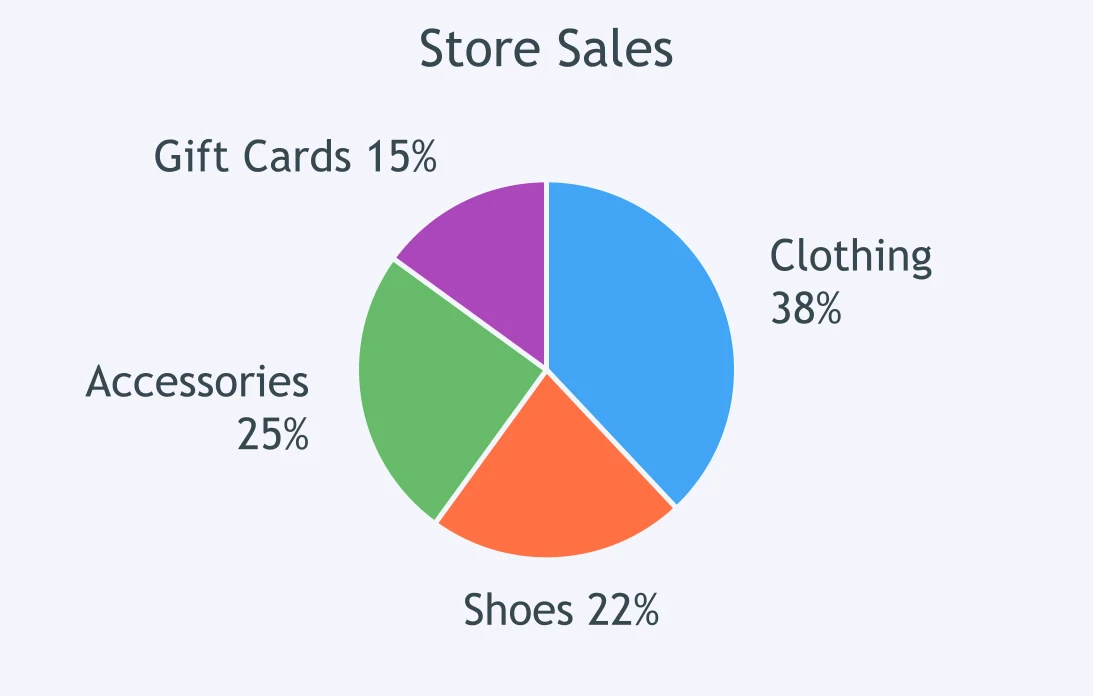
A Store Sales circle graph shows sales categories. Of $2,500, how much came from Clothing and Shoes?
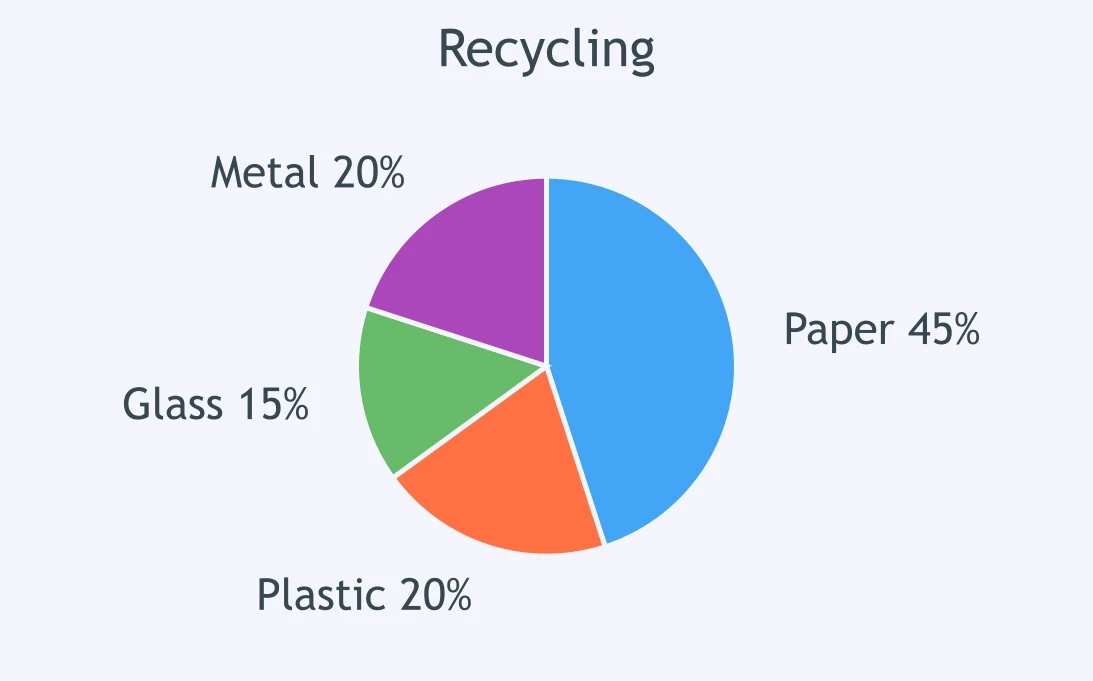
The Recycling circle graph shows materials by mass. Out of 600 kg, how many kilograms are not Paper?
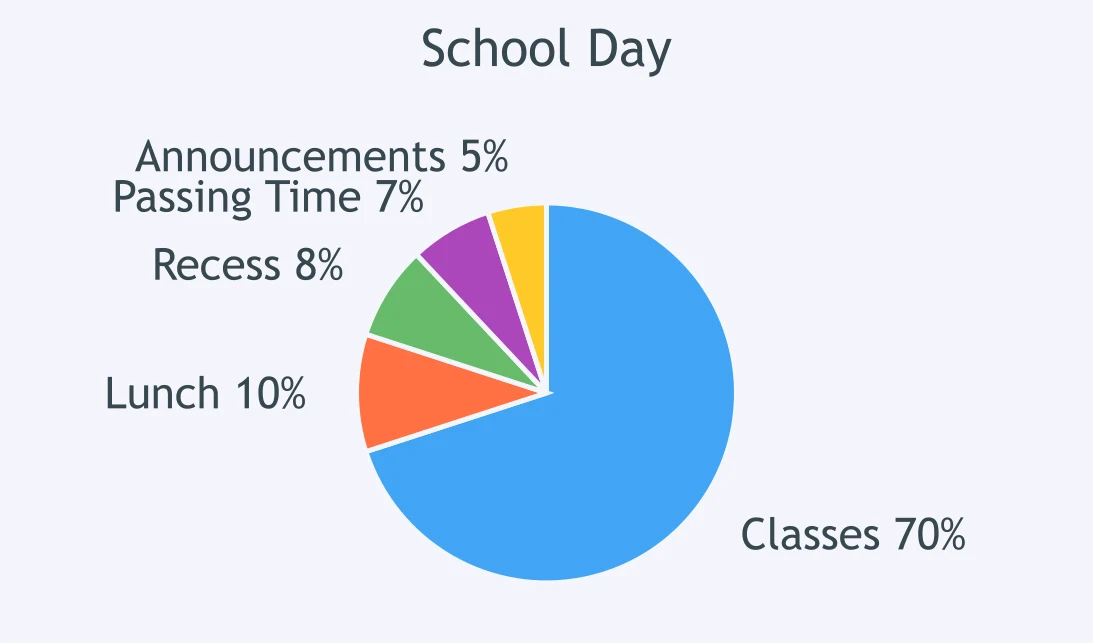
A School Day circle graph shows how the minutes are spent. Of 400 minutes, how many are not Classes?
Crack the passcode before the zombies get in.
Answer, then swat bugs for bonus points.
Race through questions at your own speed.
Same question on every screen. Fastest wins.

Pick a tile, answer, hit bonuses and steals.
Mixed Review: Number and Operations
40 questions