Loading
by BlastRoom
Interpret motion using distance-time graphs, displacement-time graphs, and dot diagrams.
#motion_graphs#matatag_science_7

20 questions
One question set, multiple game modes. Tap any game to see it in action. Not sure which to pick?
Use the graph. How far has the walker traveled after 4 seconds?
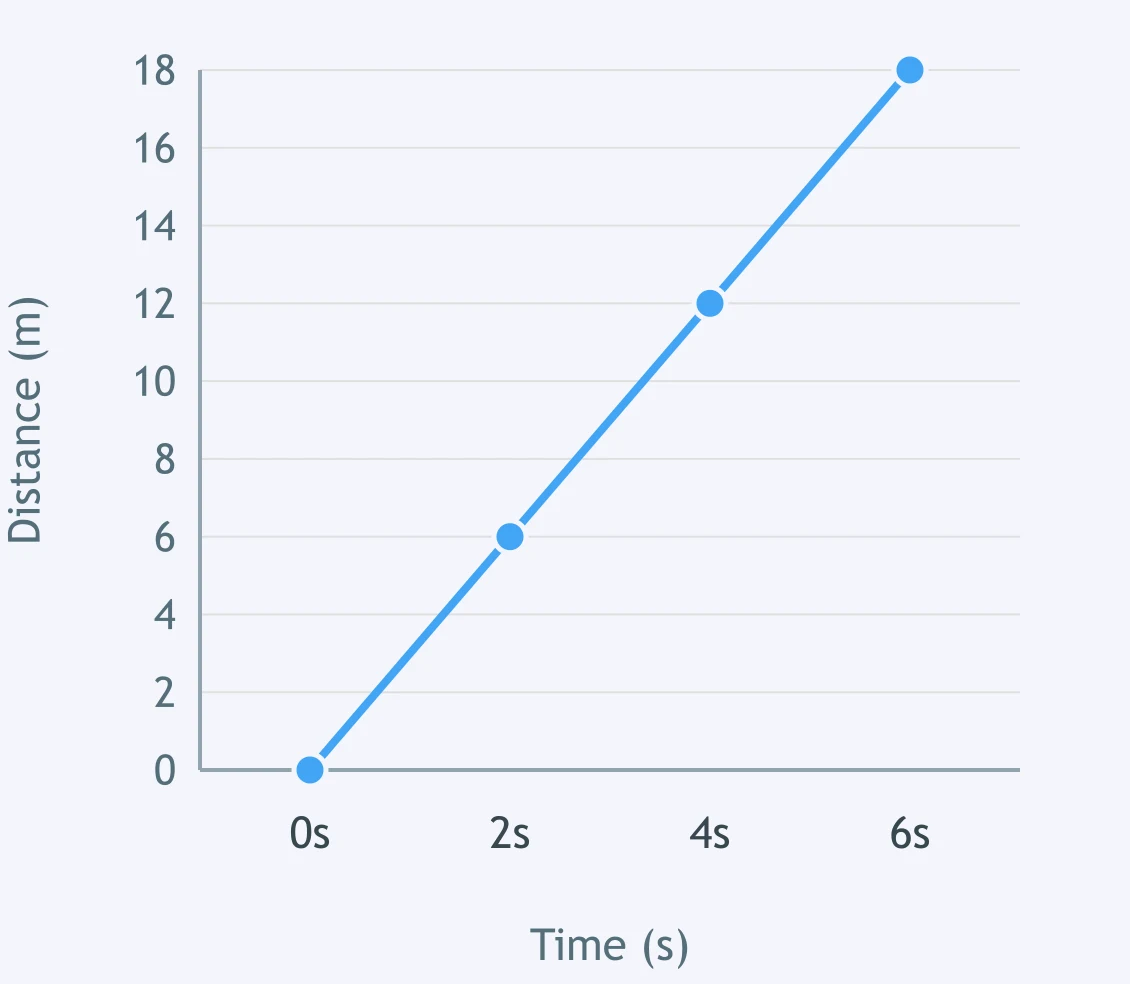
At what time does the cyclist reach a total distance of 24 meters?
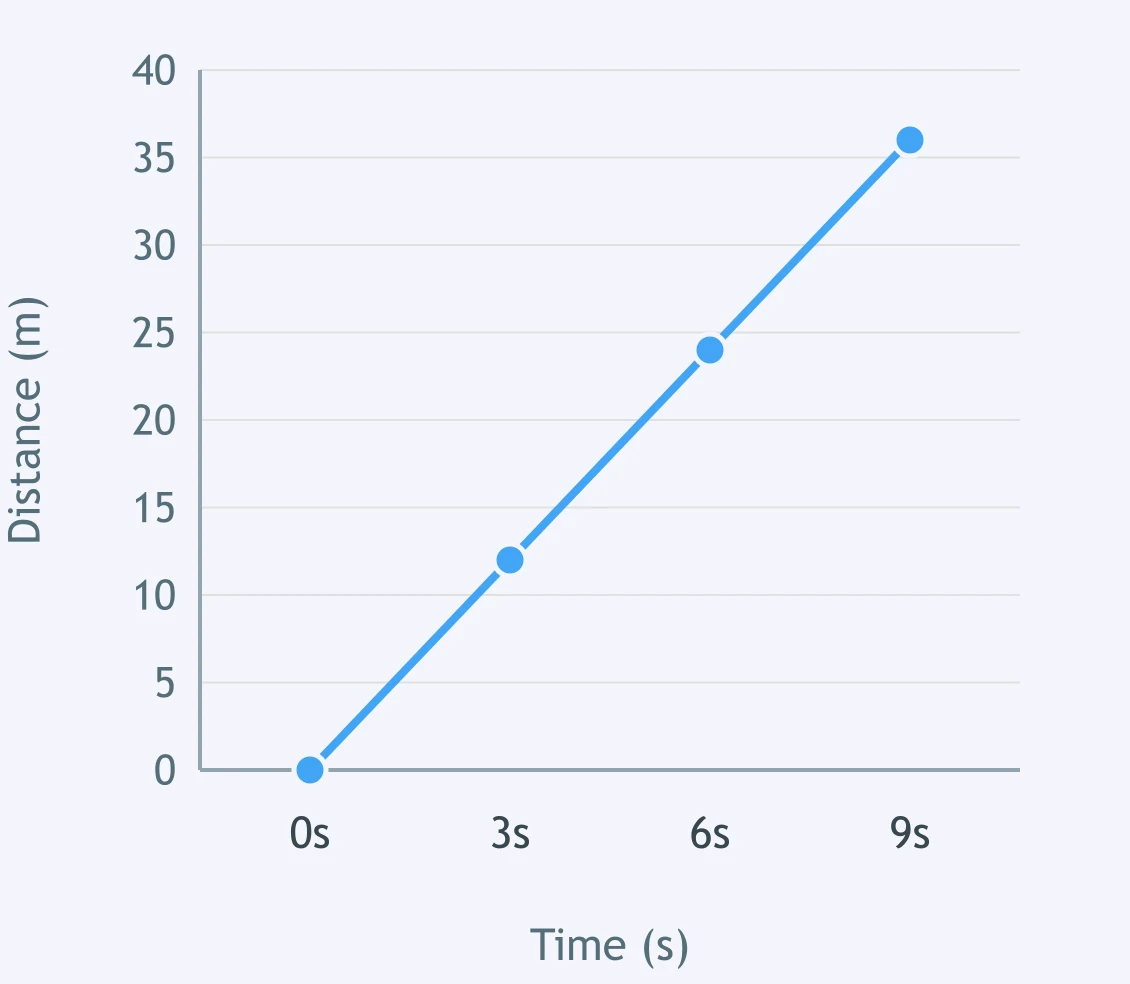
What is the runner's speed in this graph?
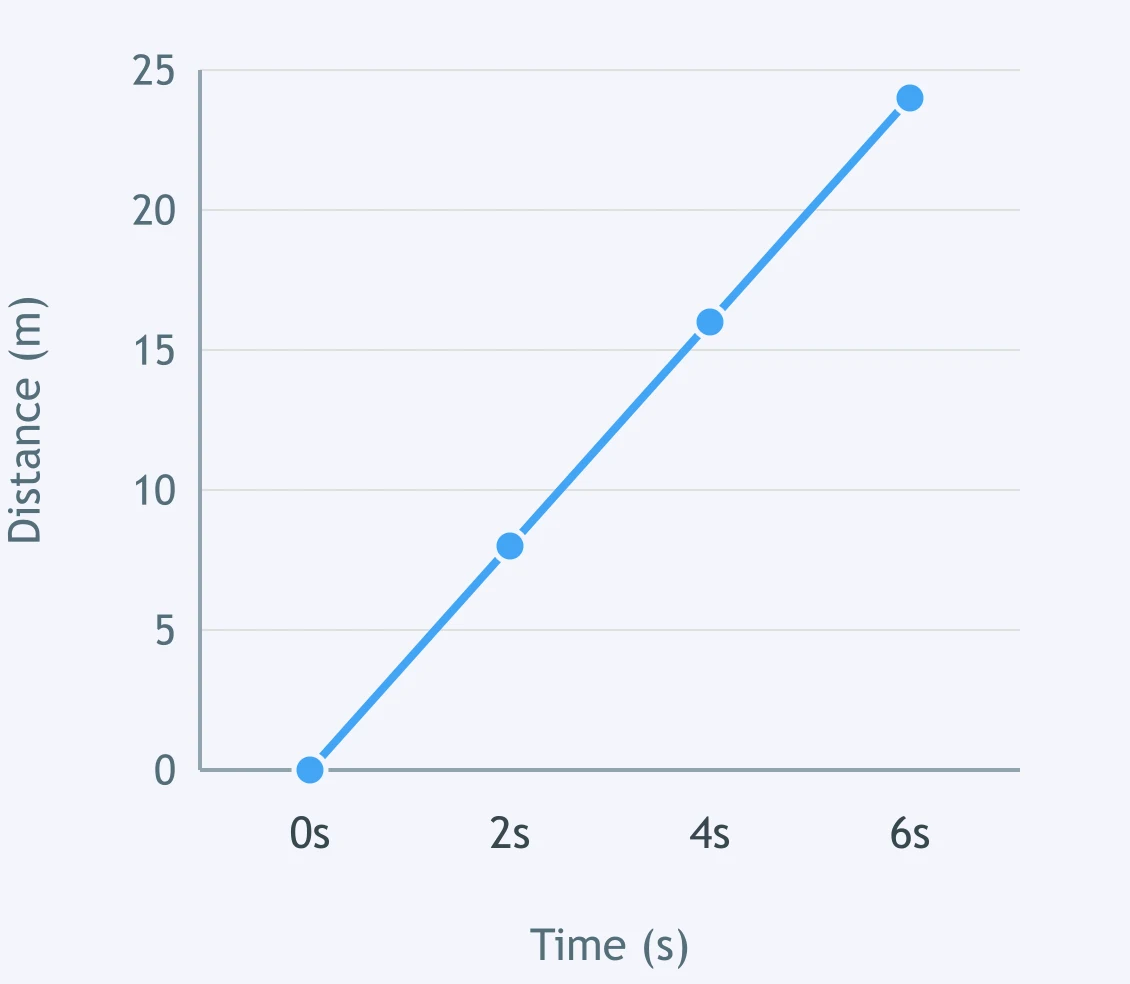
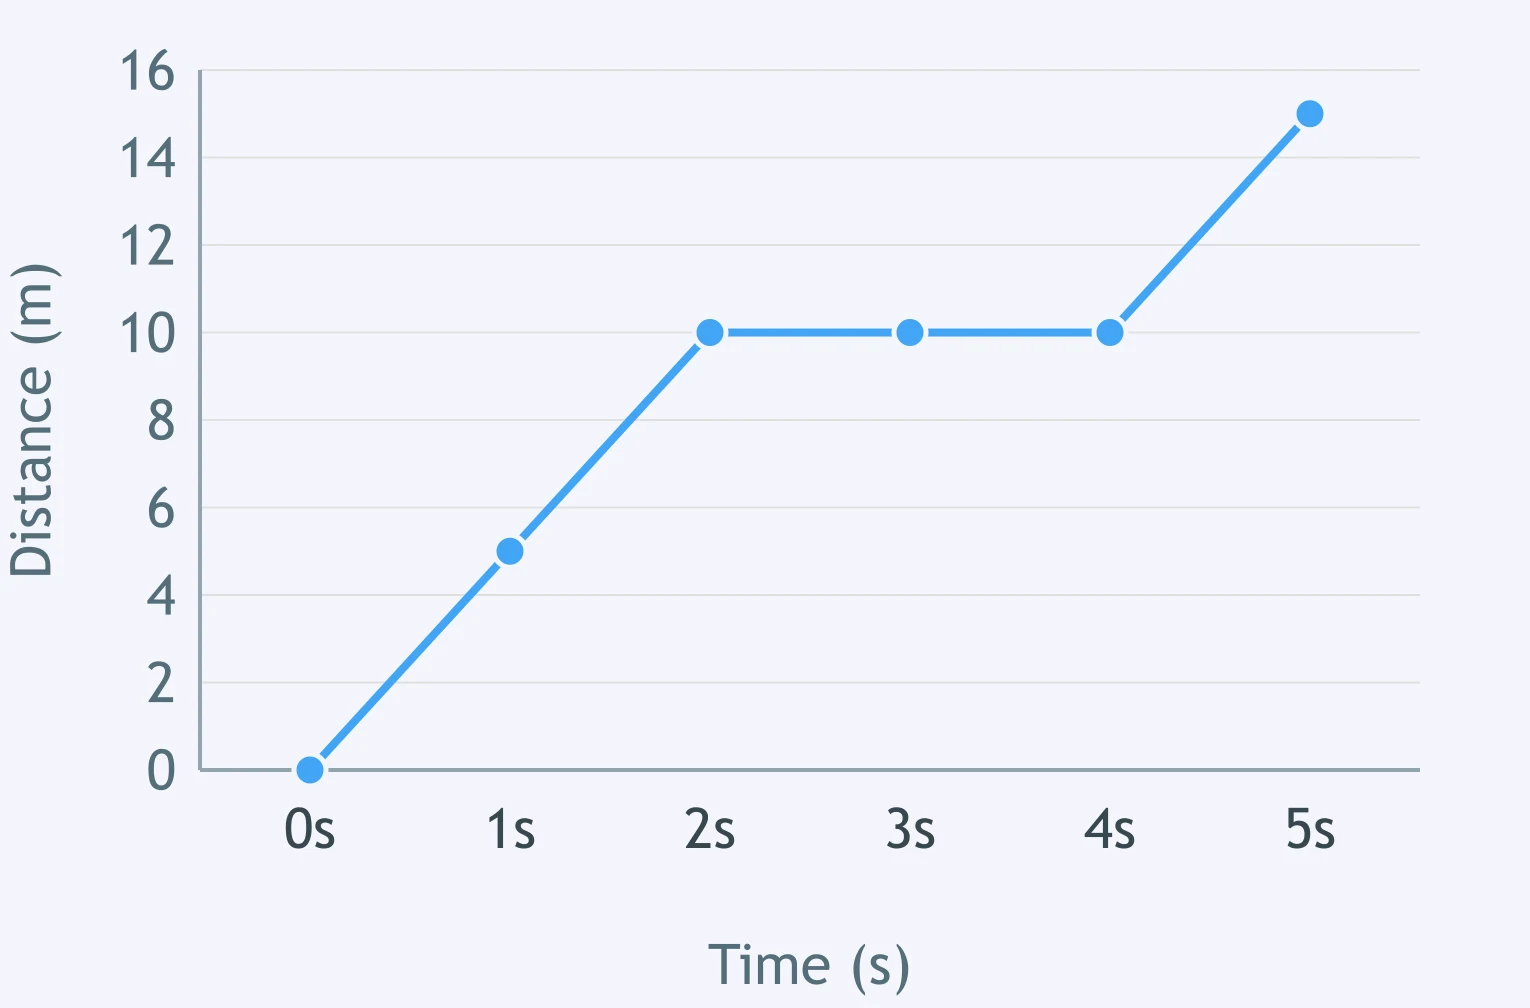
What is the tricycle doing from 2 seconds to 6 seconds?
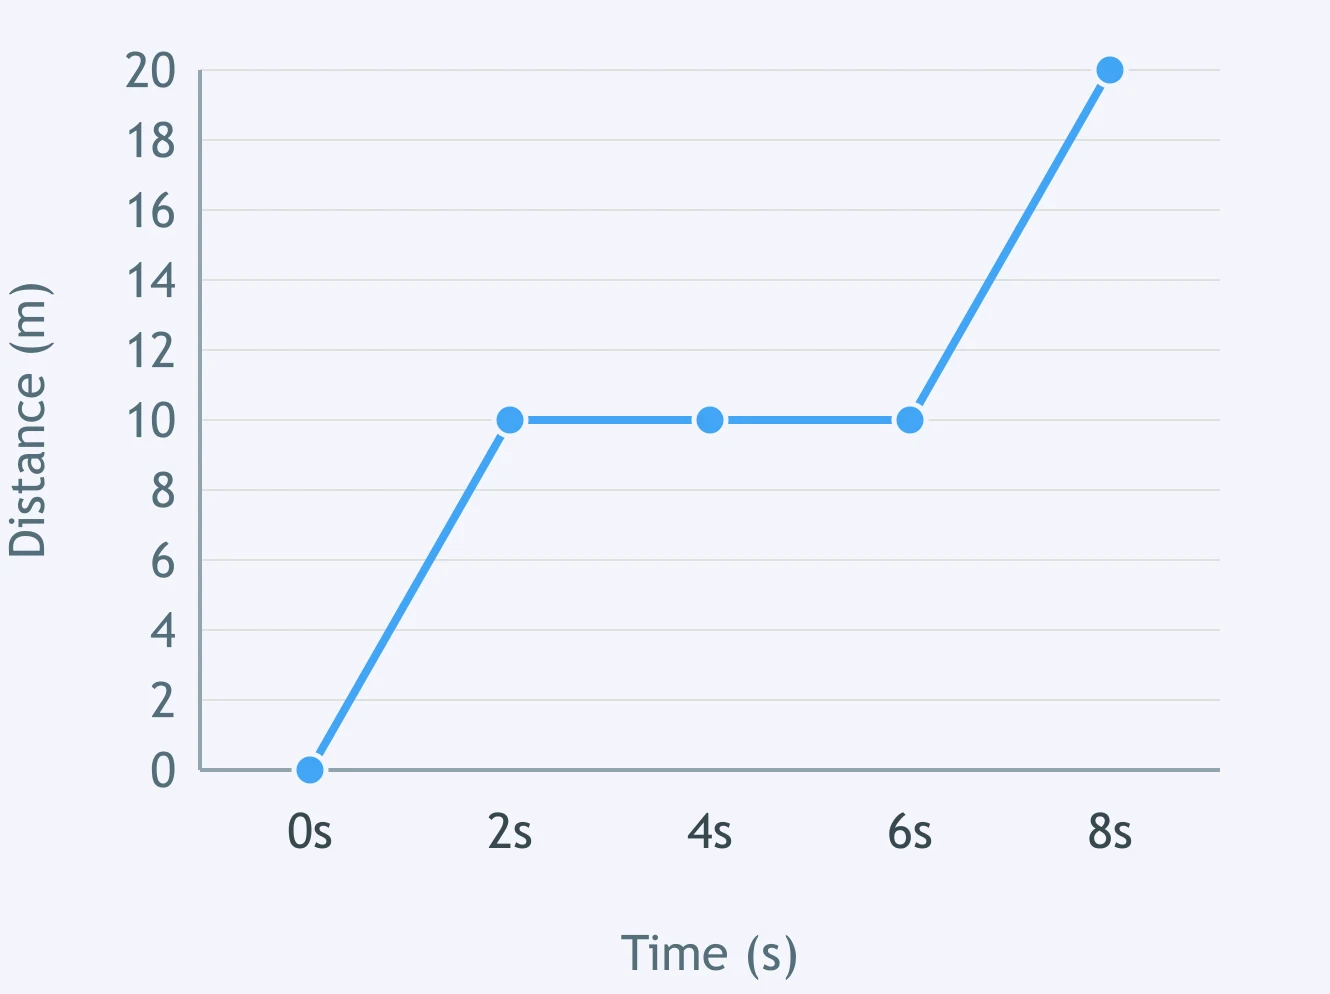
Both runners start together. Who moves faster over the time shown?
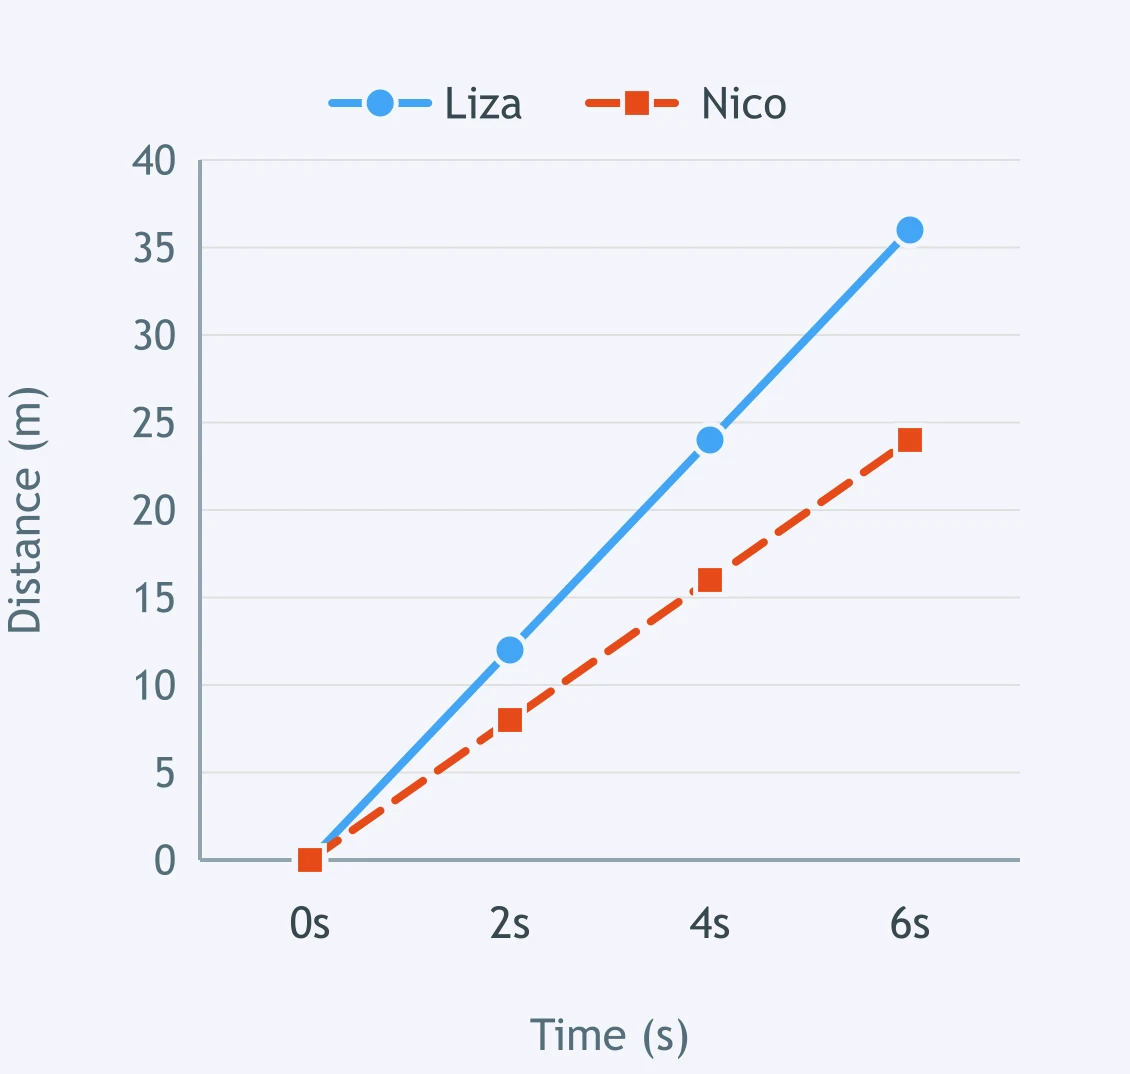
During which interval is the jeepney's speed greatest?
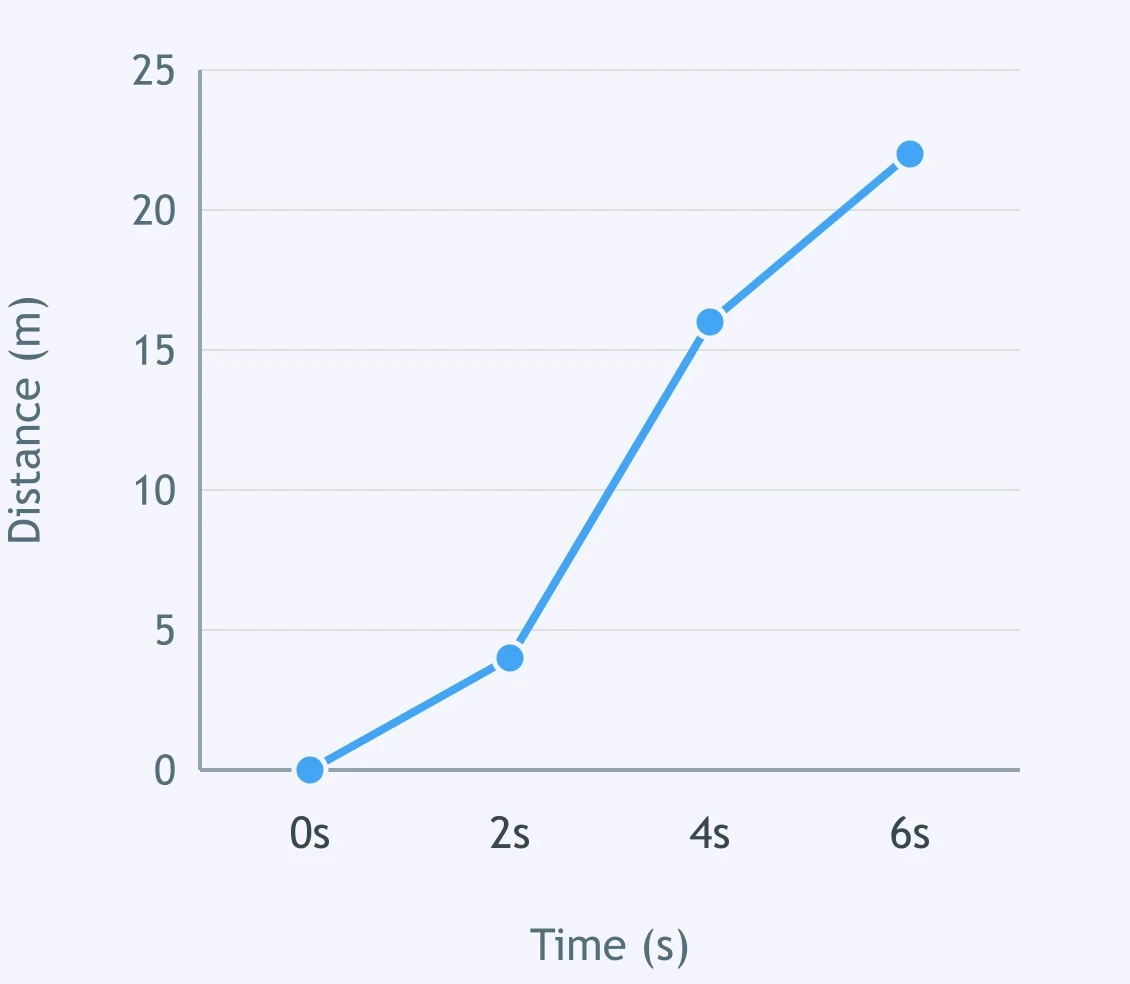
Which story matches this jeepney's trip?
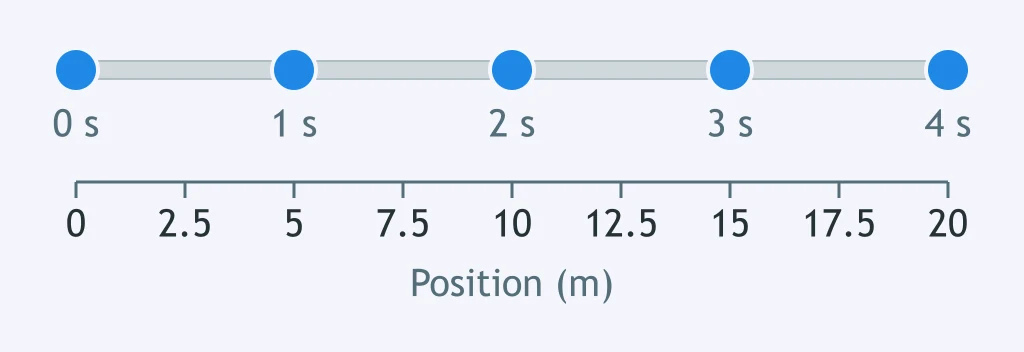
The dots record a car's location at equal time intervals. How is the car moving?
What happens to the bicycle's speed as the recorded times increase?
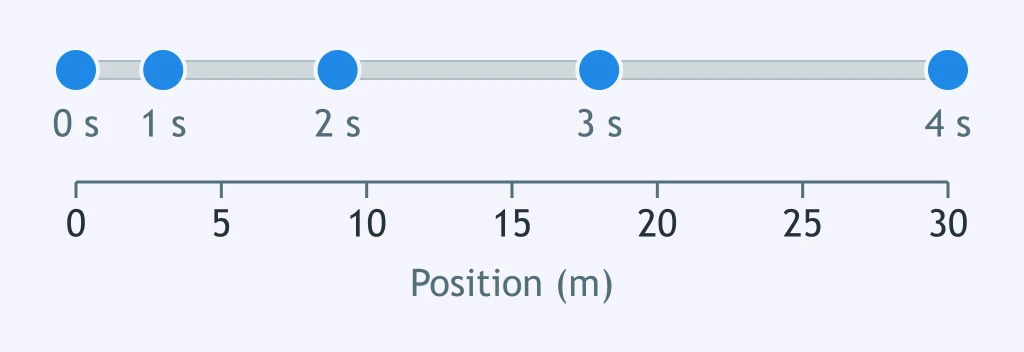
Which distance-time graph shape would match this motion map?
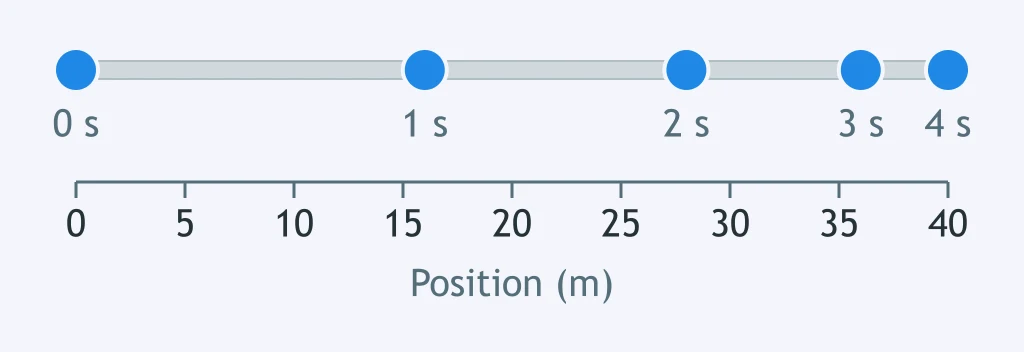
The rows use the same time intervals and position scale. Which object has the greatest speed?
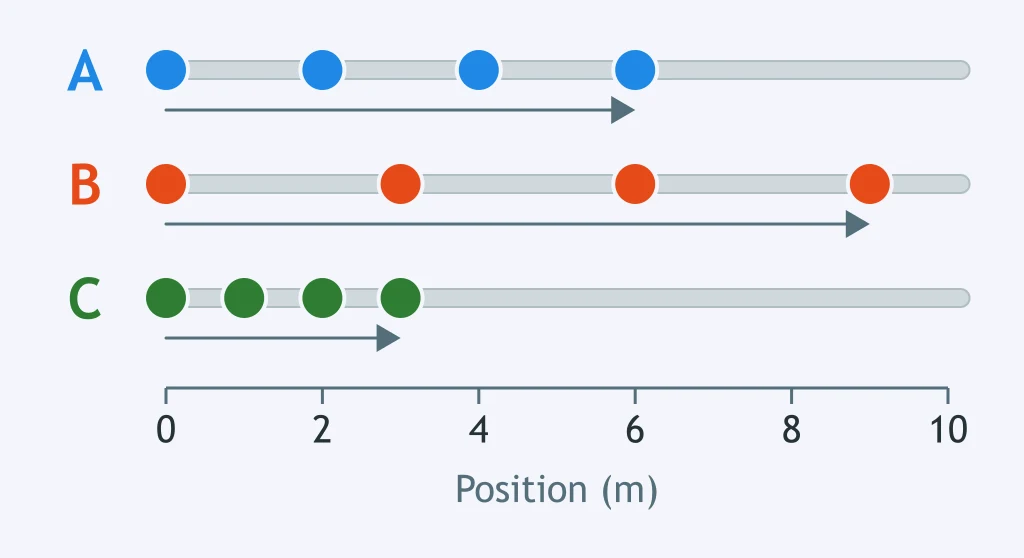
What does this position-time graph show about the jeepney?
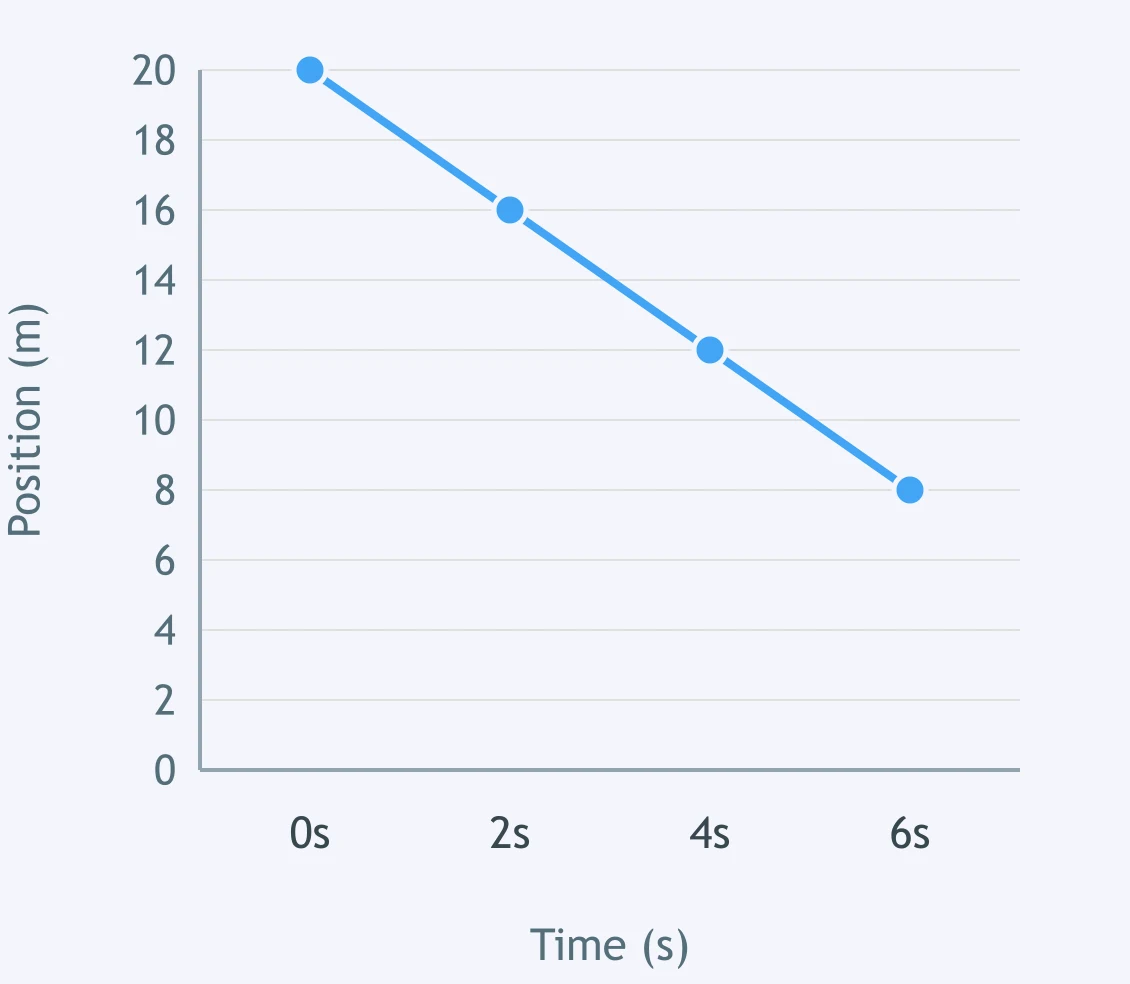
What is the object's velocity on this displacement-time graph?
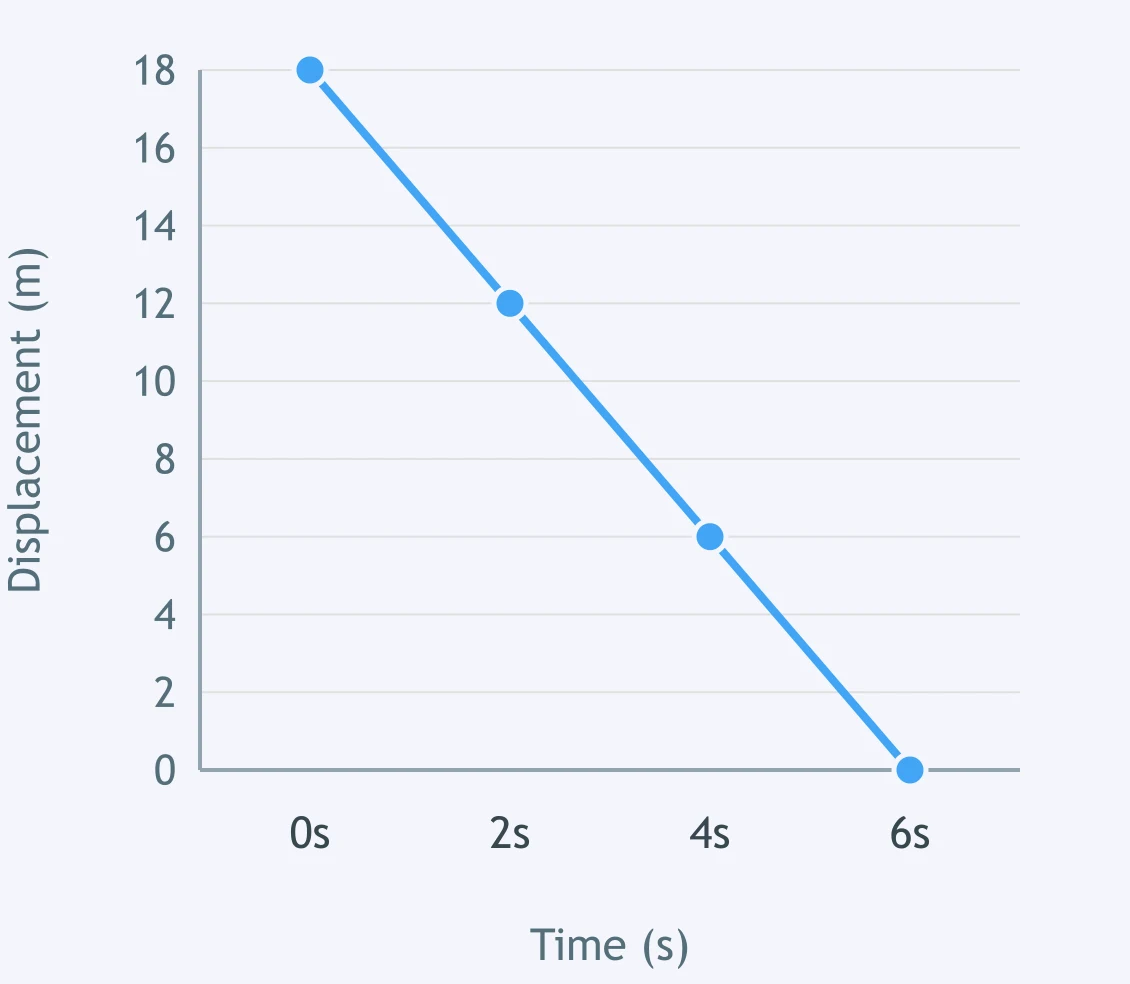
When does the walker reverse direction?
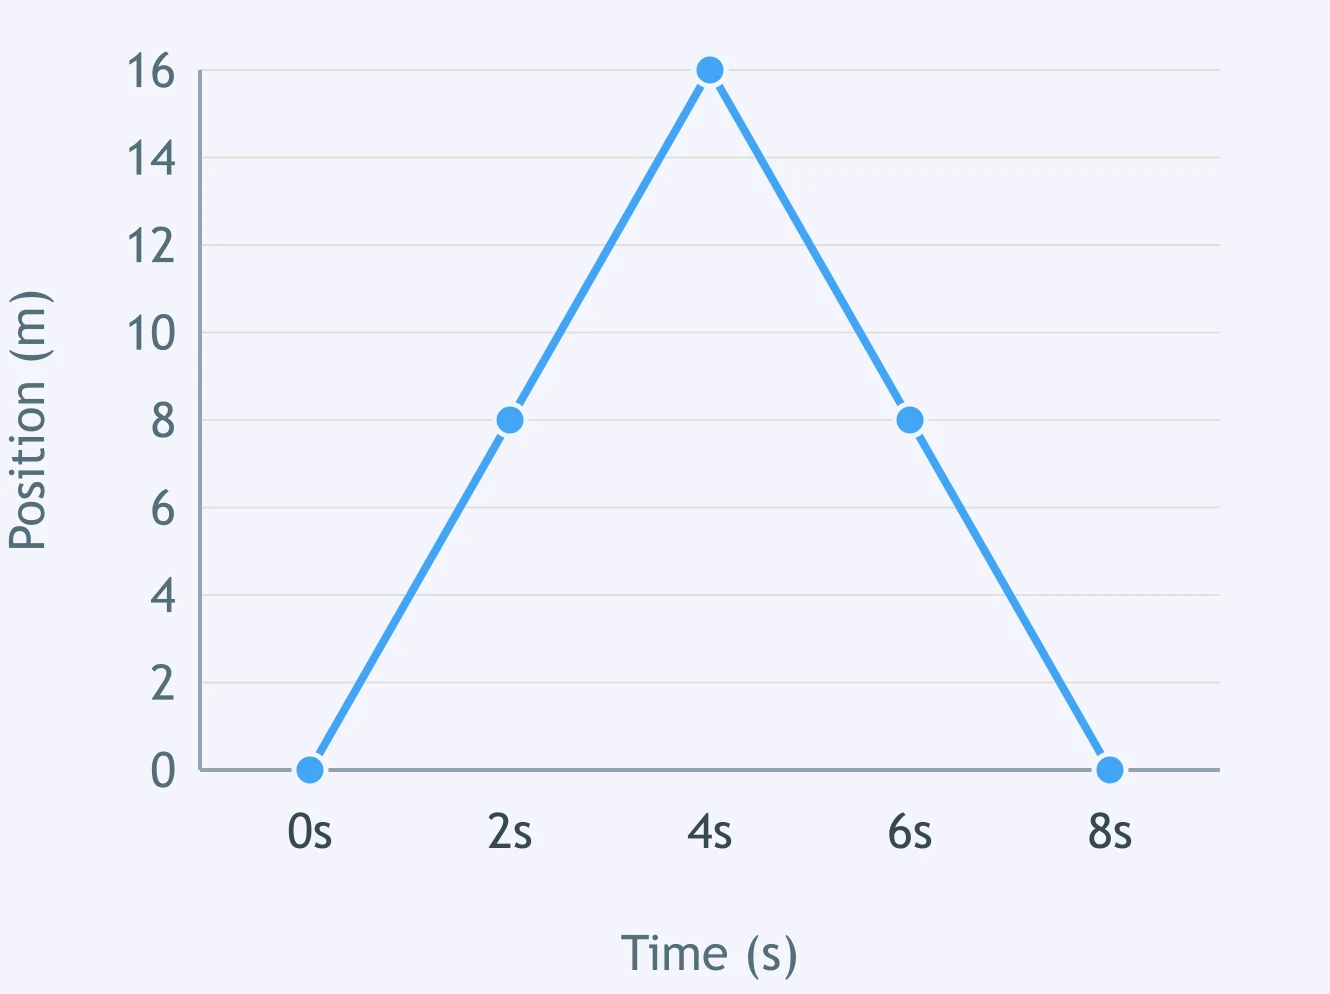
Use the position-time graph. What total distance does the walker travel during the entire trip?
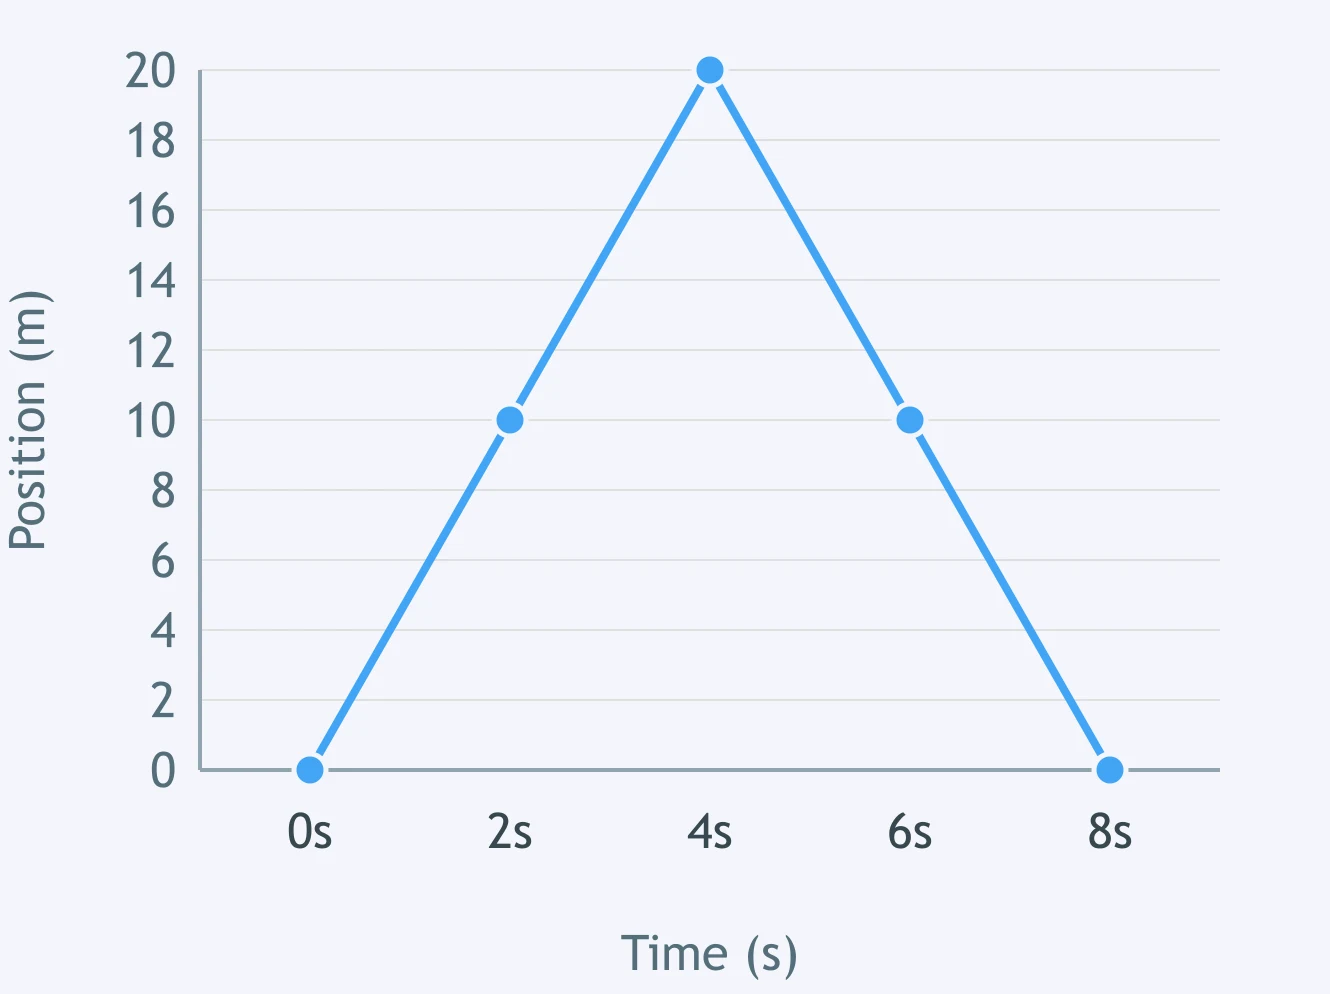
Which feature is impossible on a graph of total distance traveled versus time?
What is the cyclist's average speed over the full time shown?
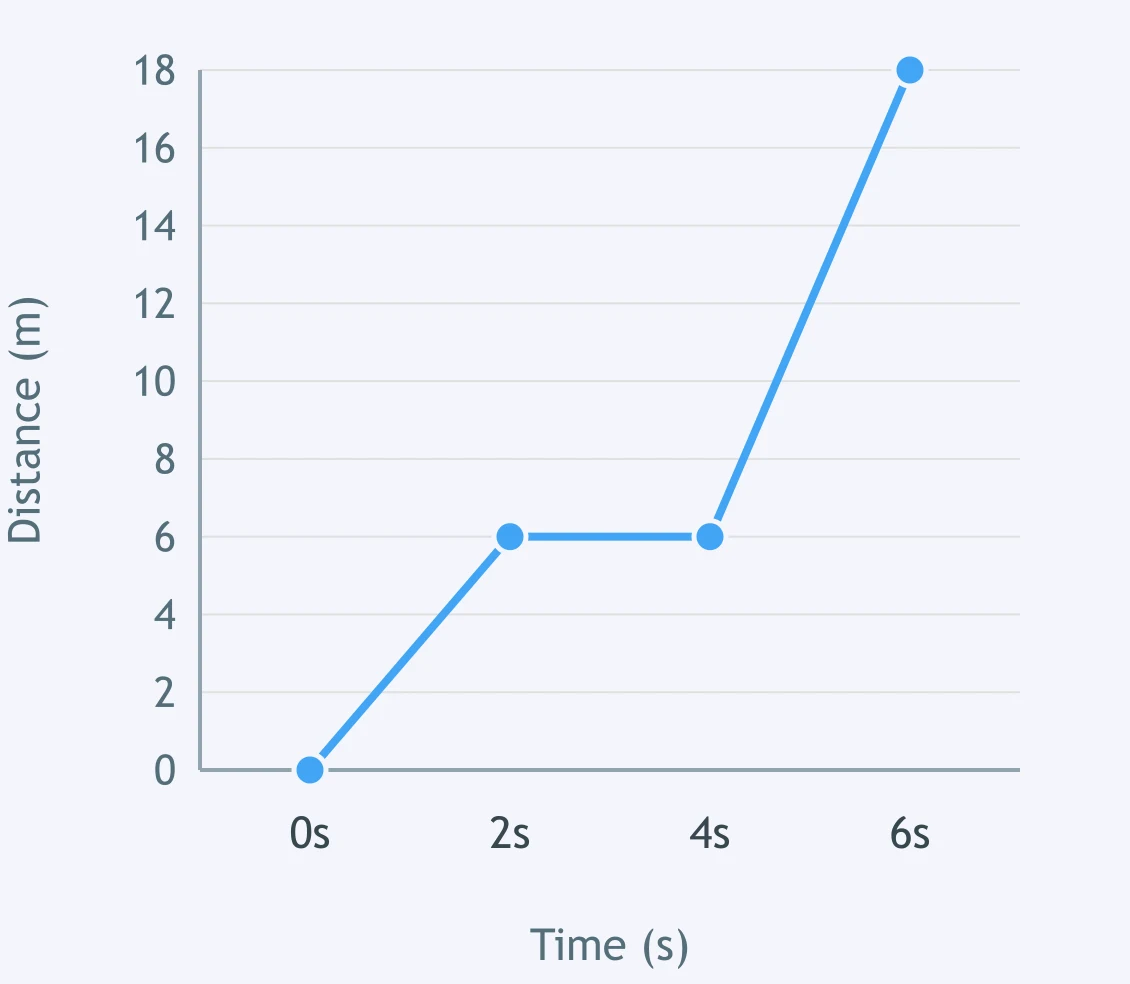
If the runner continues with the motion shown, how far will the runner have traveled after 12 seconds?
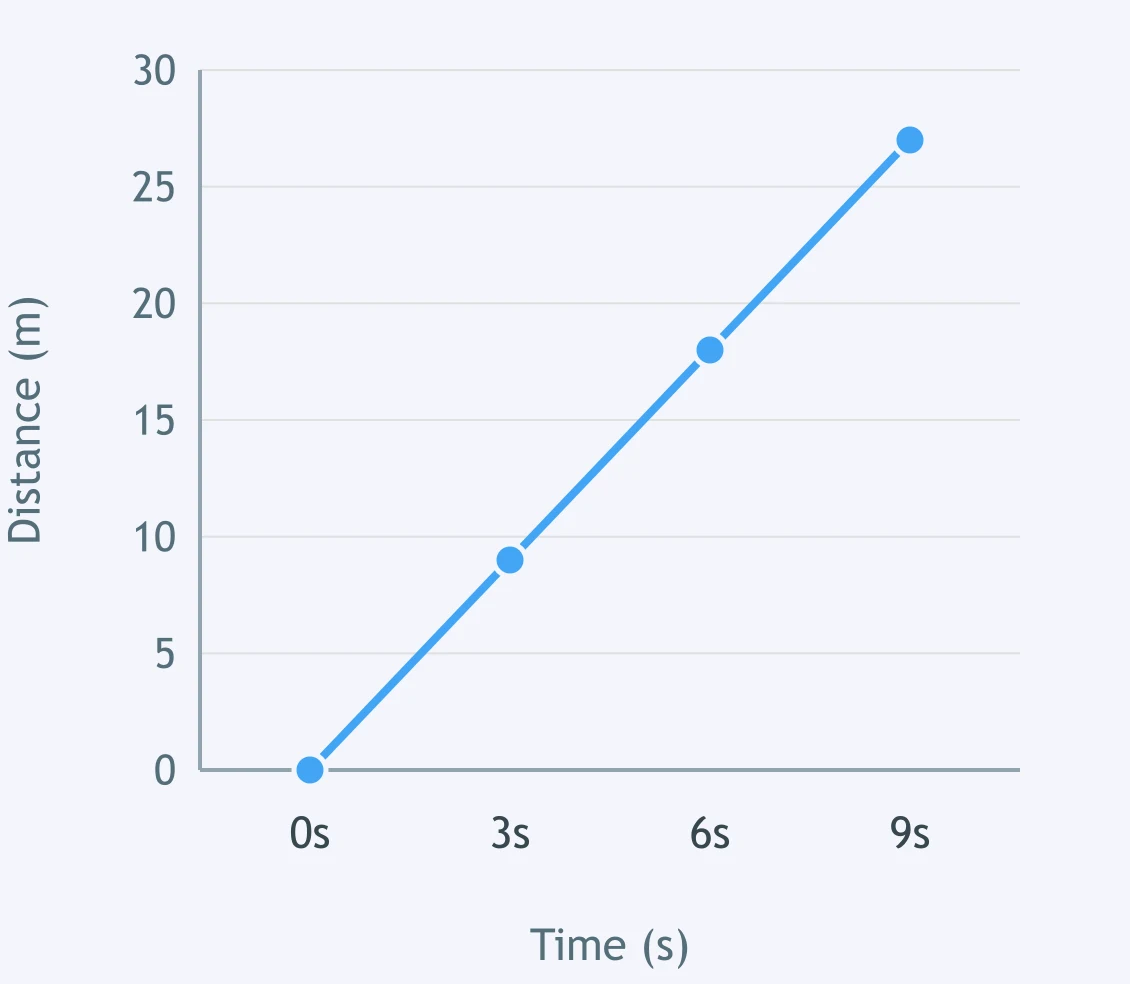
How should a student calculate the slope of a straight segment on a motion graph?
A curved distance-time graph shows 8 m at 2 s and 20 m at 4 s. What is the average speed between these times?
Crack the passcode before the zombies get in.

Pick a tile, answer, hit bonuses and steals.
Term 2 Summative Review 2
40 questions