Loading
by BlastRoom
Read and choose data displays for Grade 7 data questions.
#us_grade_7_math
40 questions
One question set, multiple game modes. Tap any game to see it in action. Not sure which to pick?
Answer to place stones and capture territory.
Outrun the snow together.
Earn blasts, then hunt the other team.
Answer to earn energy, then climb.

The class blasts through walls together.
Bid on mystery lots. Most money wins.
Sell tours. Nice, standard, or a total scam.

Answer, restock, and serve the rush.
More correct answers pulls the rope your way.
Answer, then shoot down the alien wave.
Answer, then tap to leap the frozen ridge.
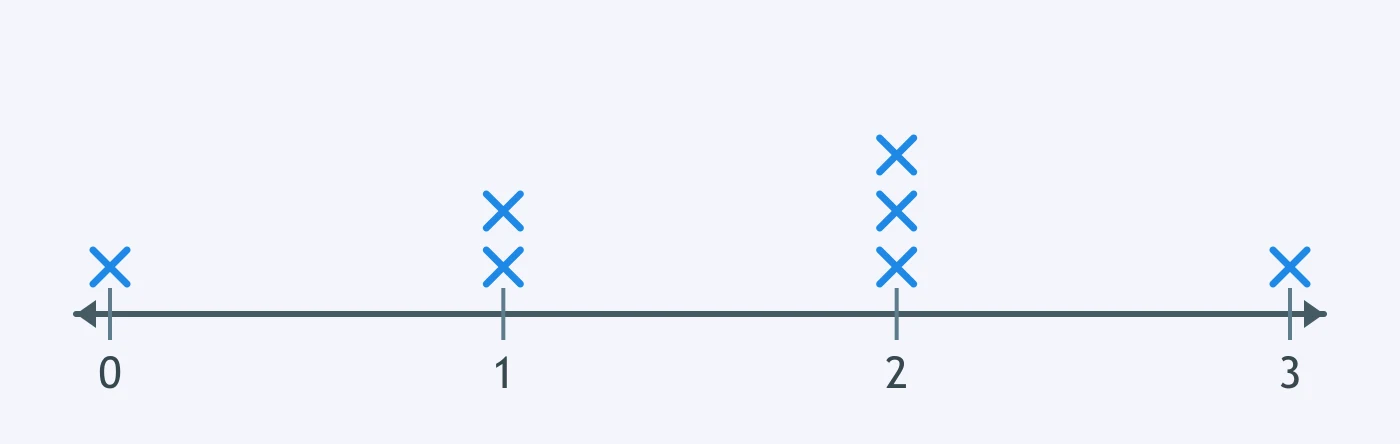
Use the dot plot. How many students have 2 pets?
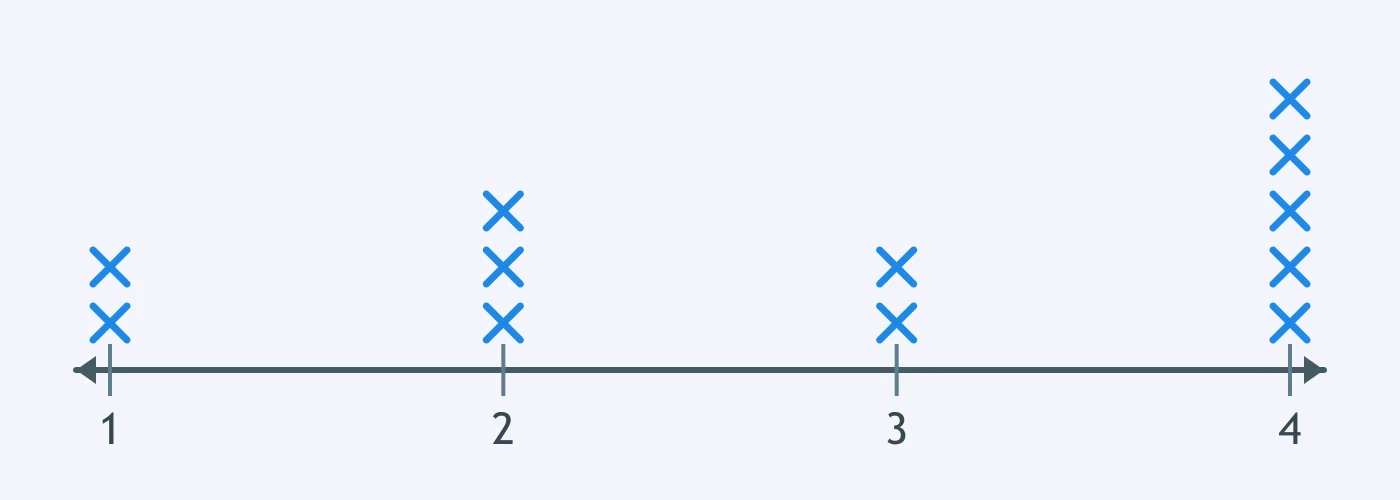
Use the dot plot. How many students read 4 books?
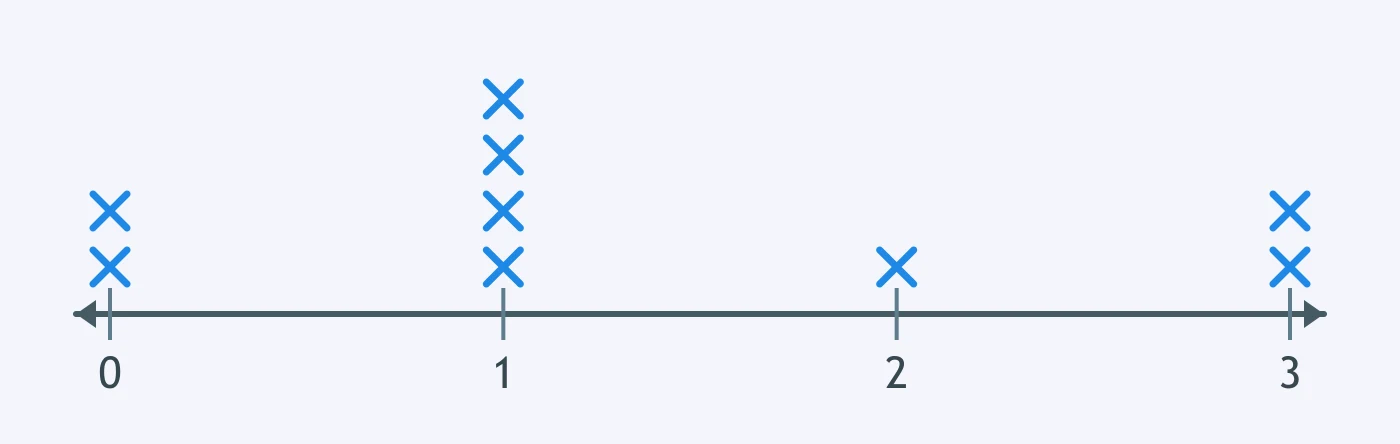
Use the dot plot. How many teams scored 0 goals?
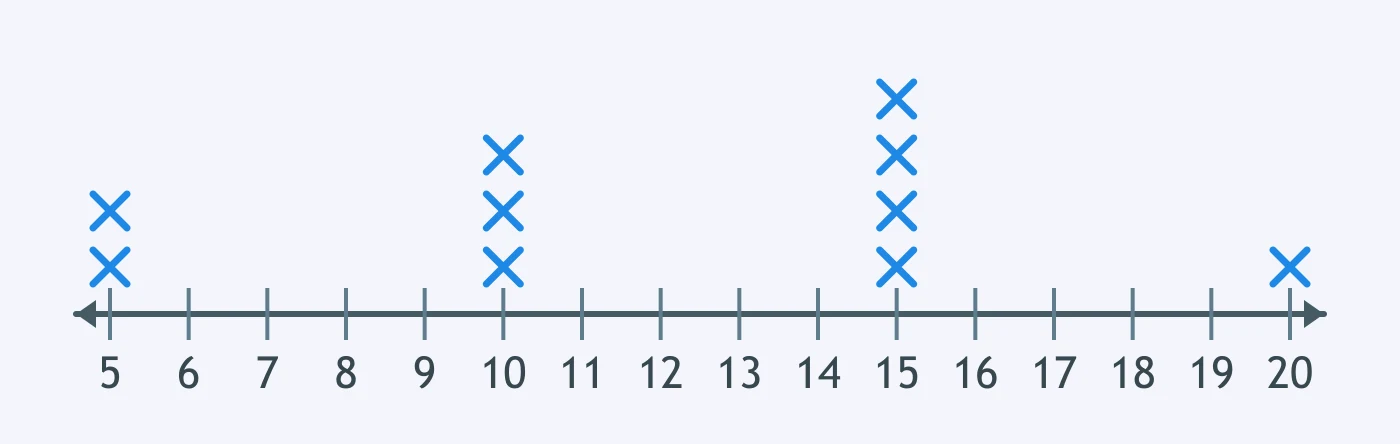
Use the dot plot. How many students have a 15-minute commute?
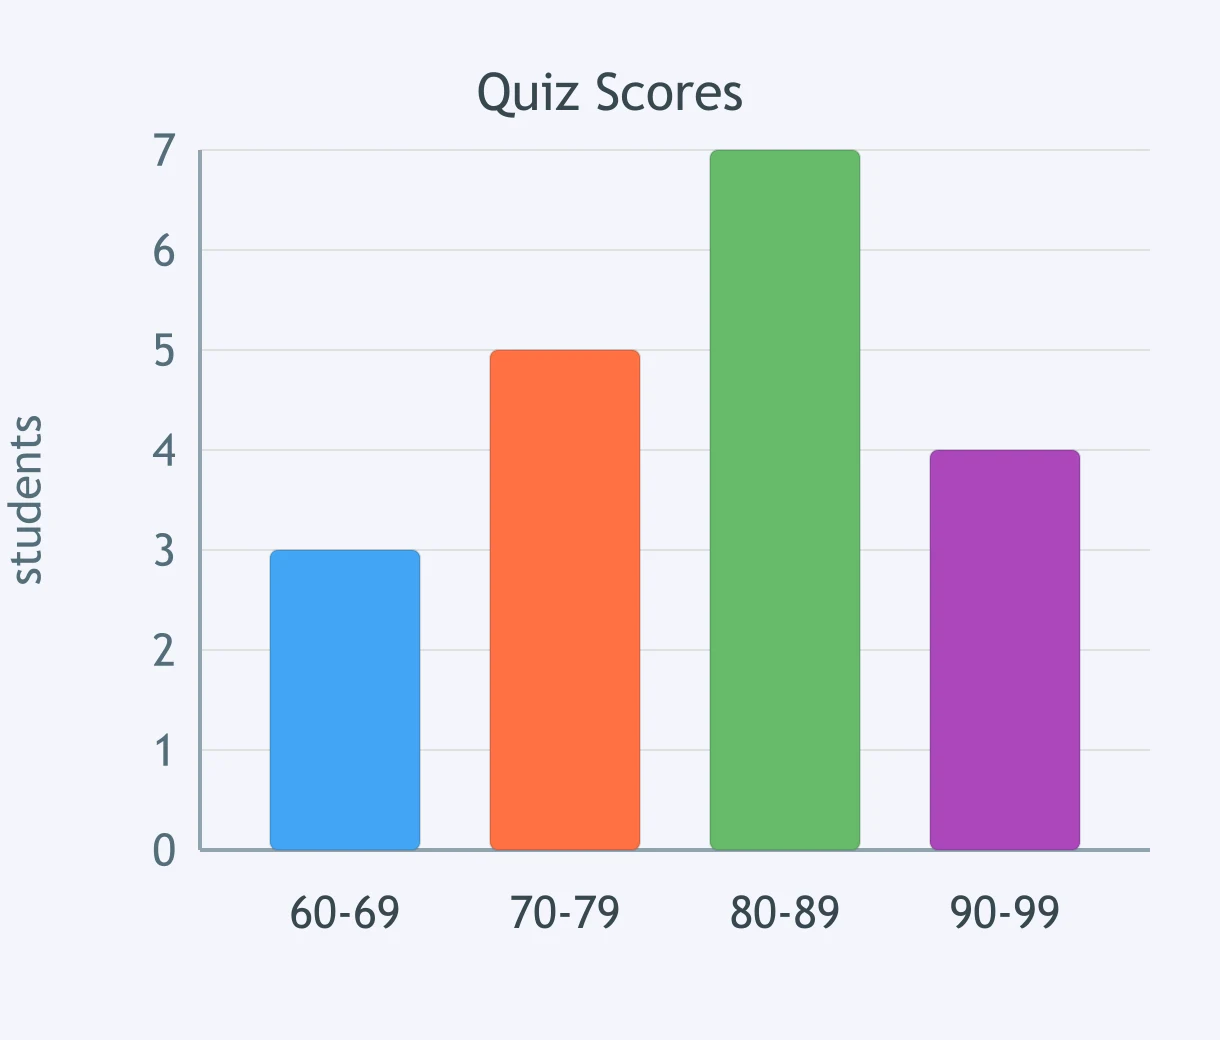
Use the histogram. How many students scored 80-89 points?
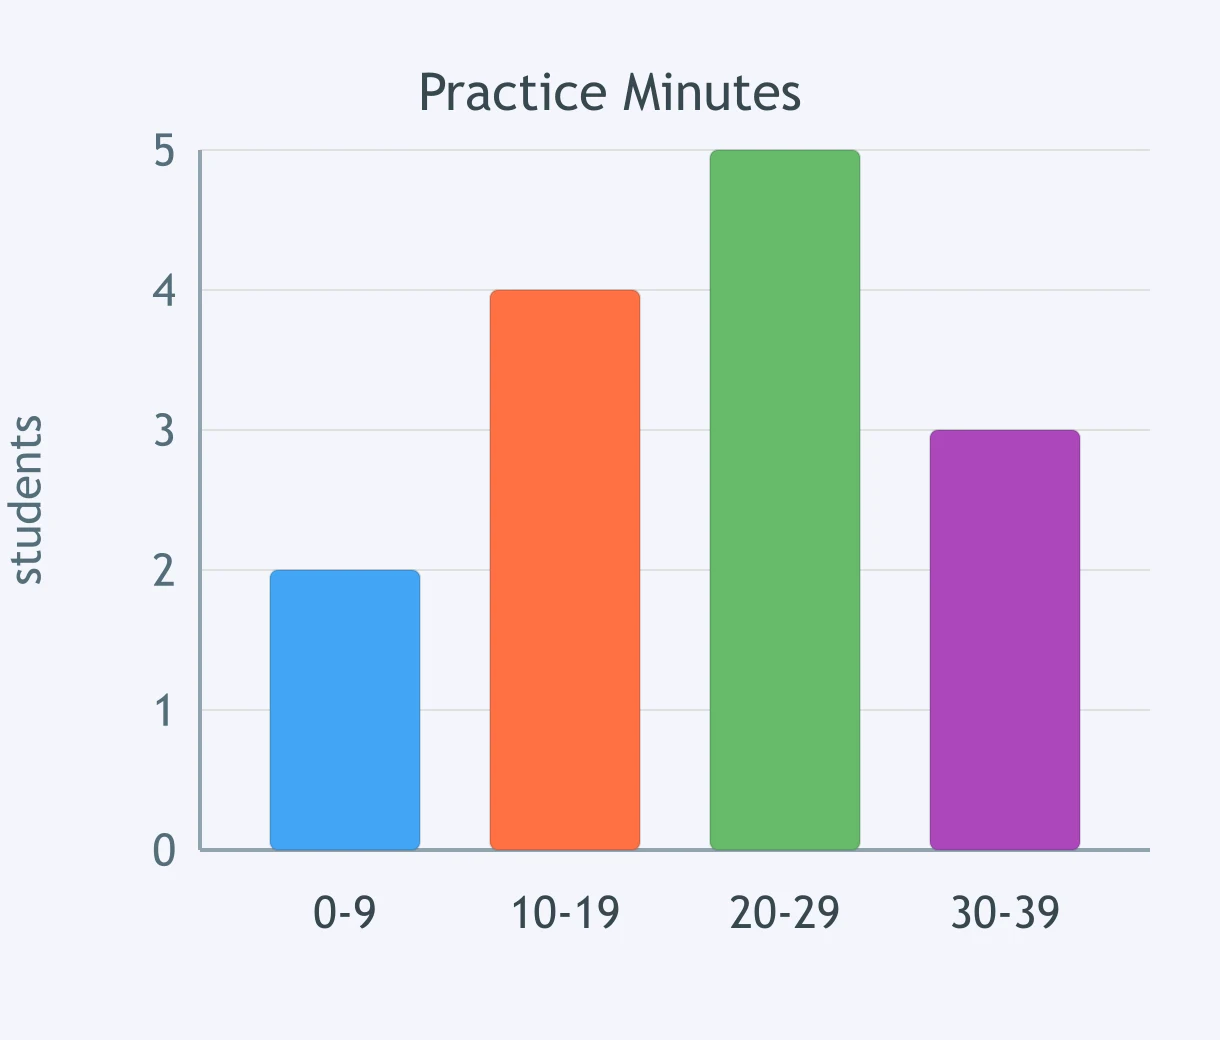
Use the histogram. How many students practiced 20-29 minutes?
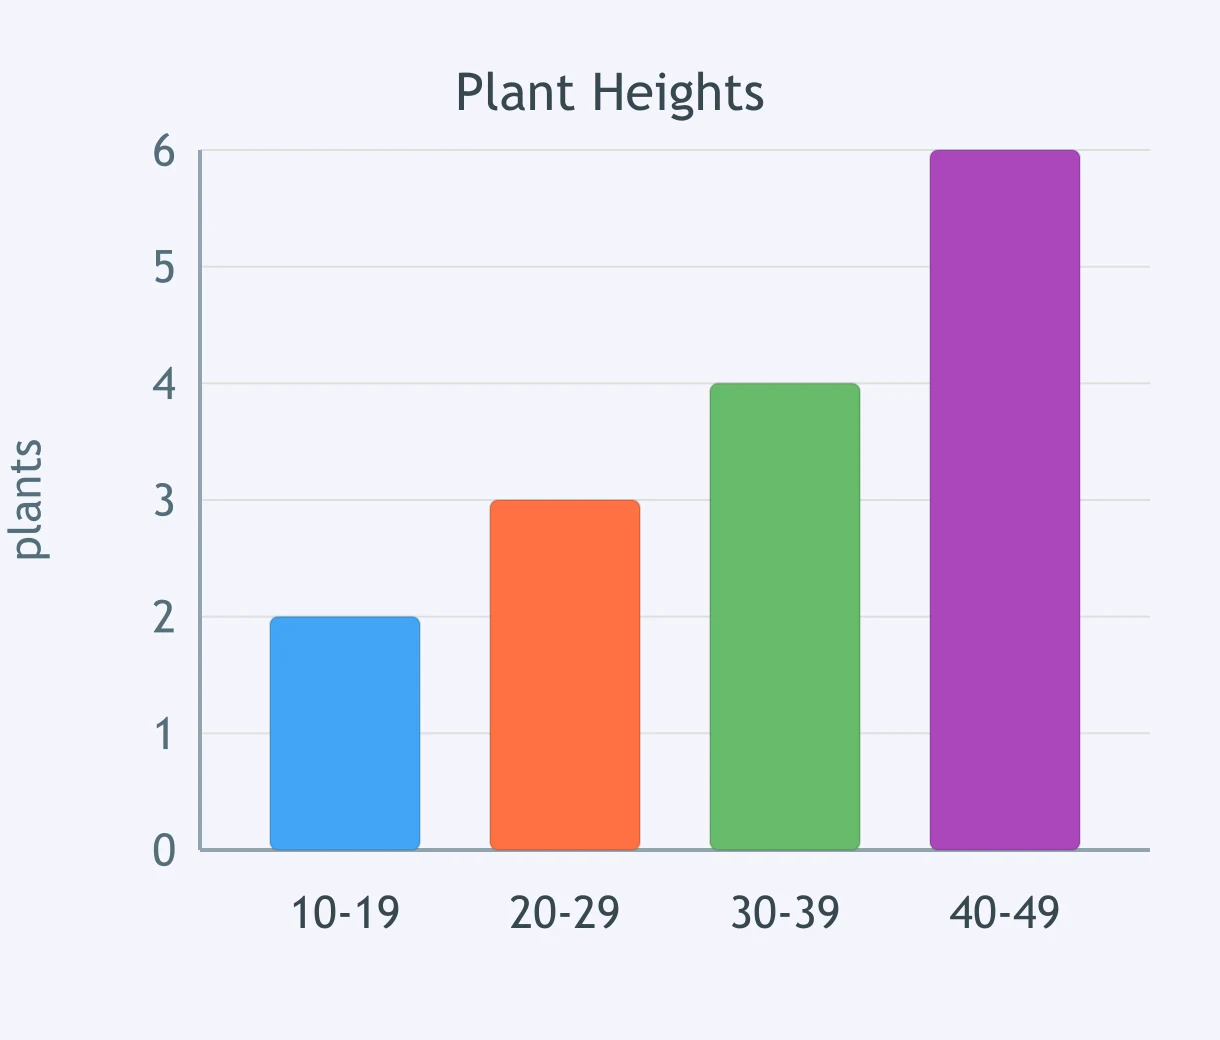
Use the histogram. How many plants are 30-39 cm tall?
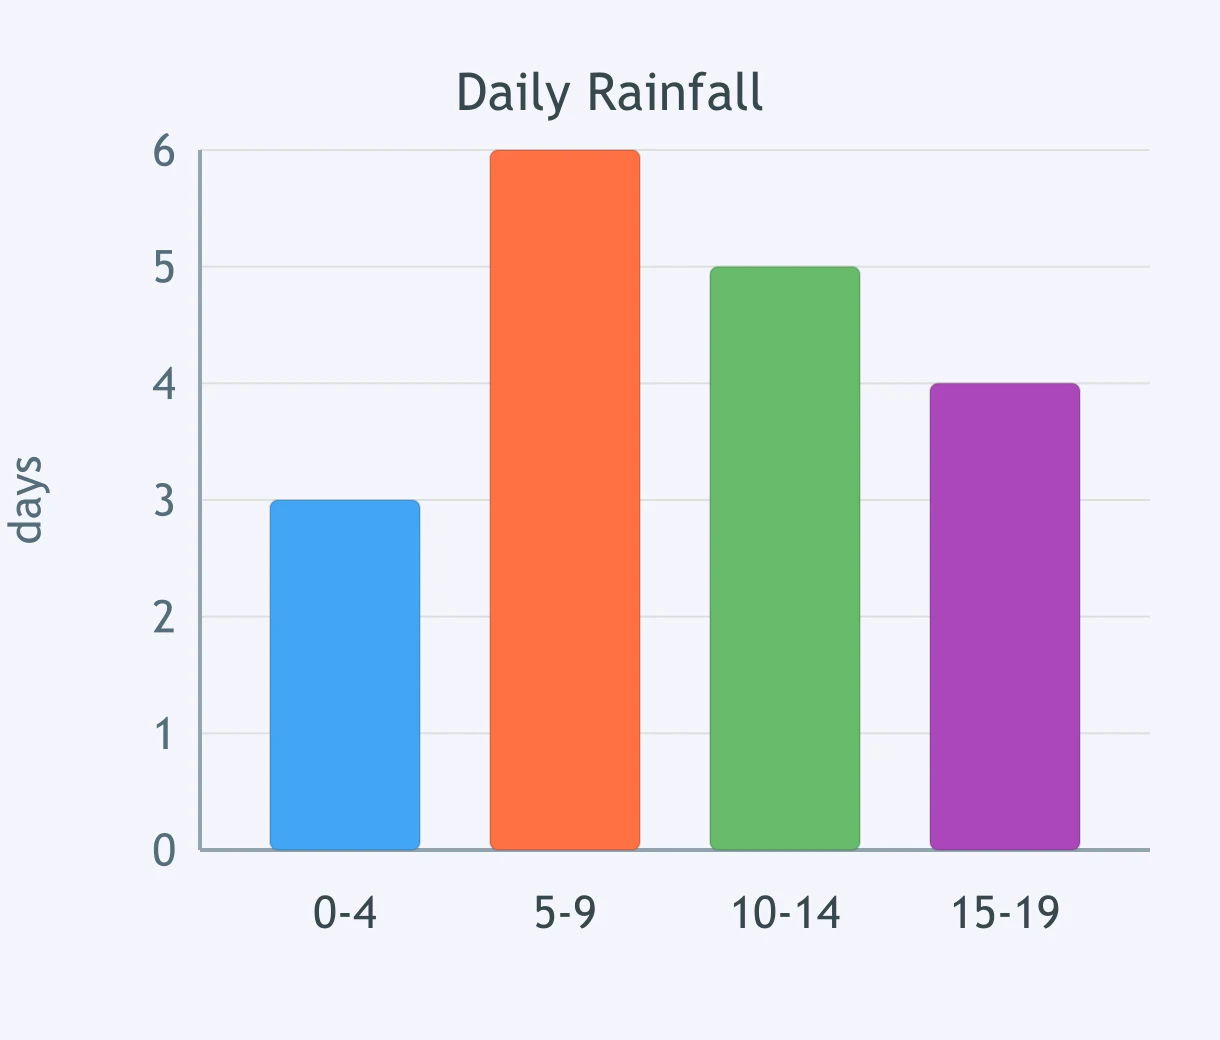
Use the histogram. How many days had 5-9 mm of rain?
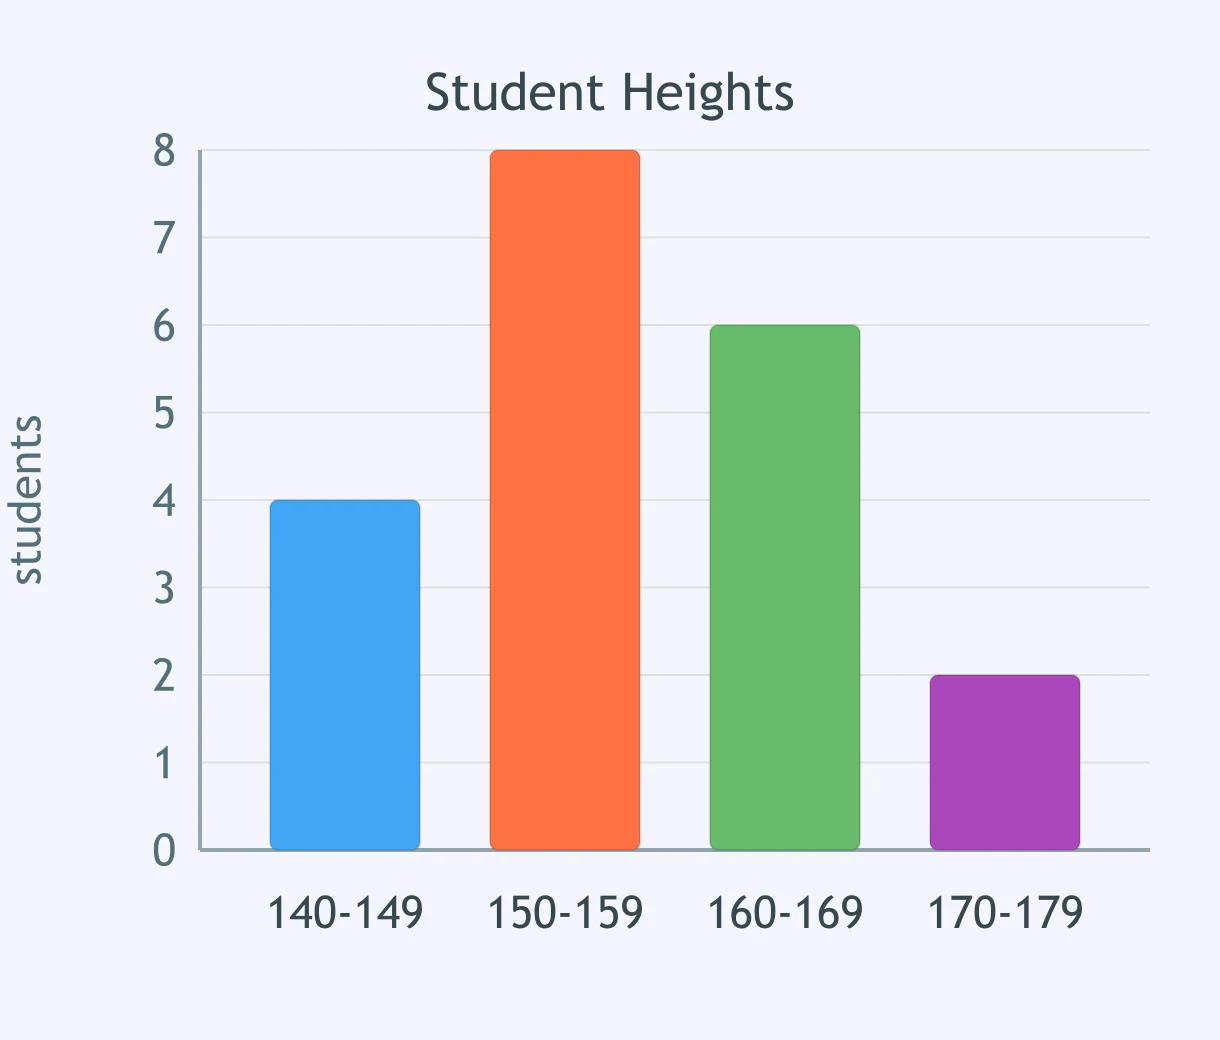
Use the histogram. How many students are 150-159 cm tall?
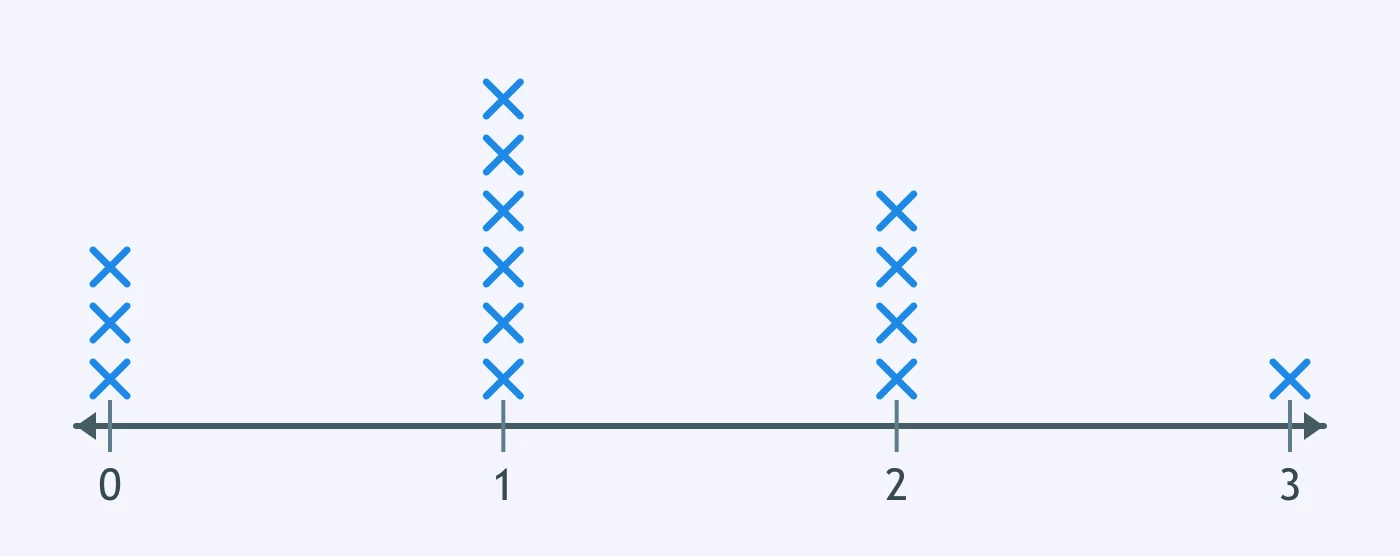
Use the dot plot. How many students have 1 sibling?
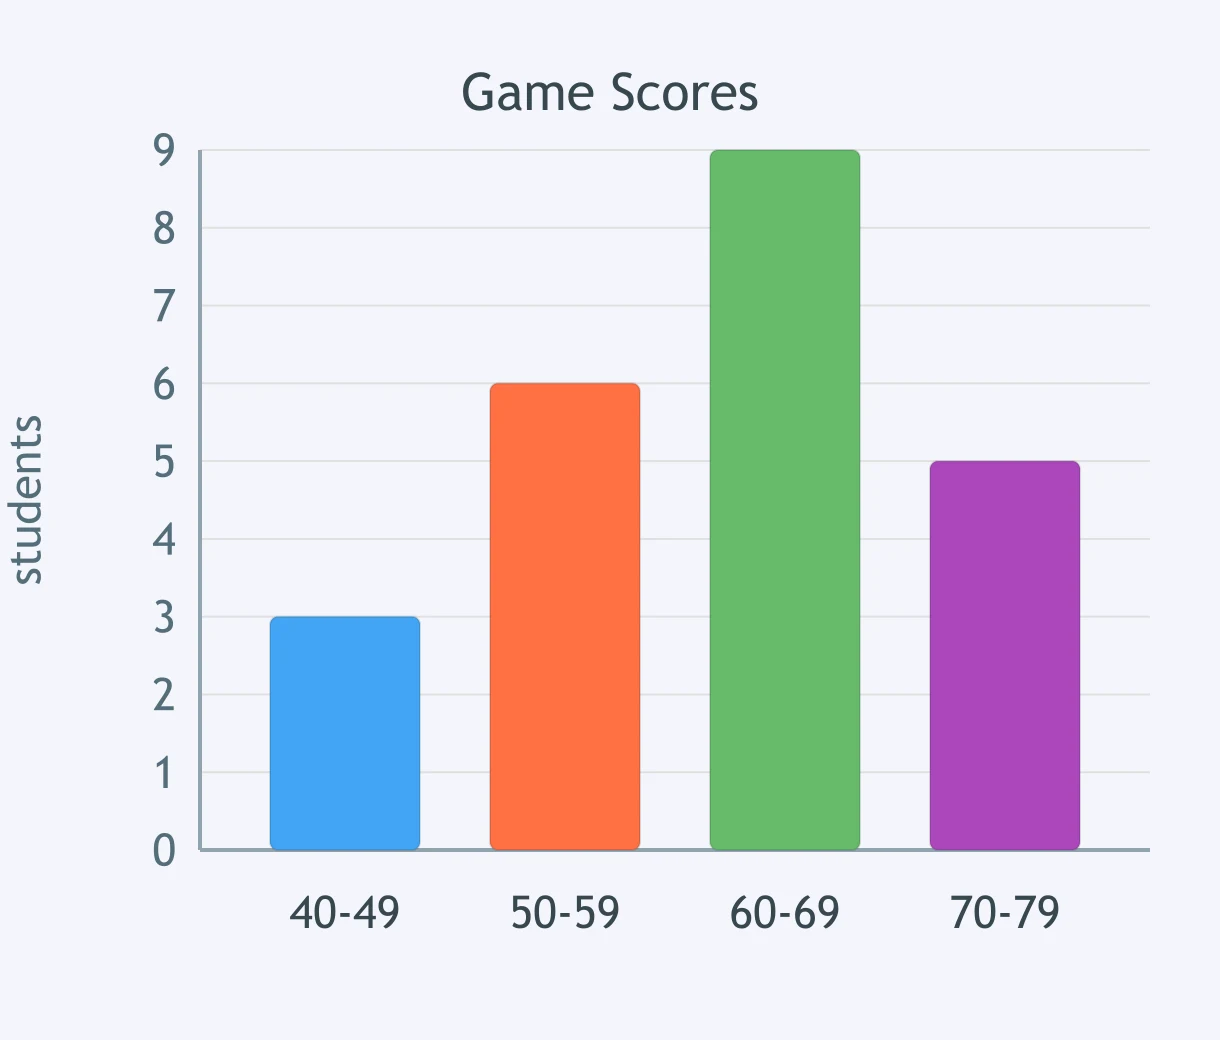
Use the histogram. Which score interval has the most students?
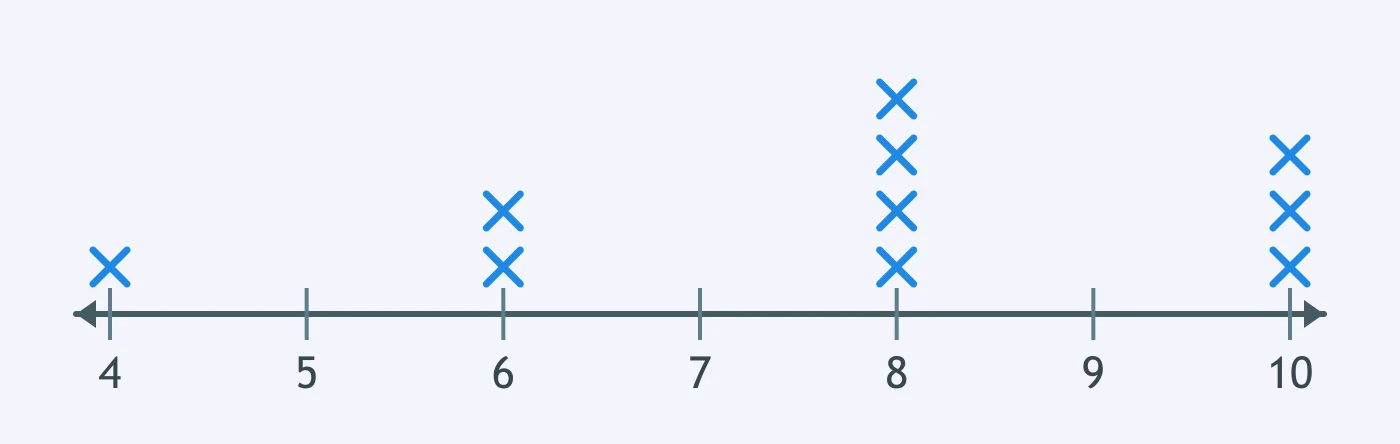
Use the dot plot. What time has 4 dots above it?
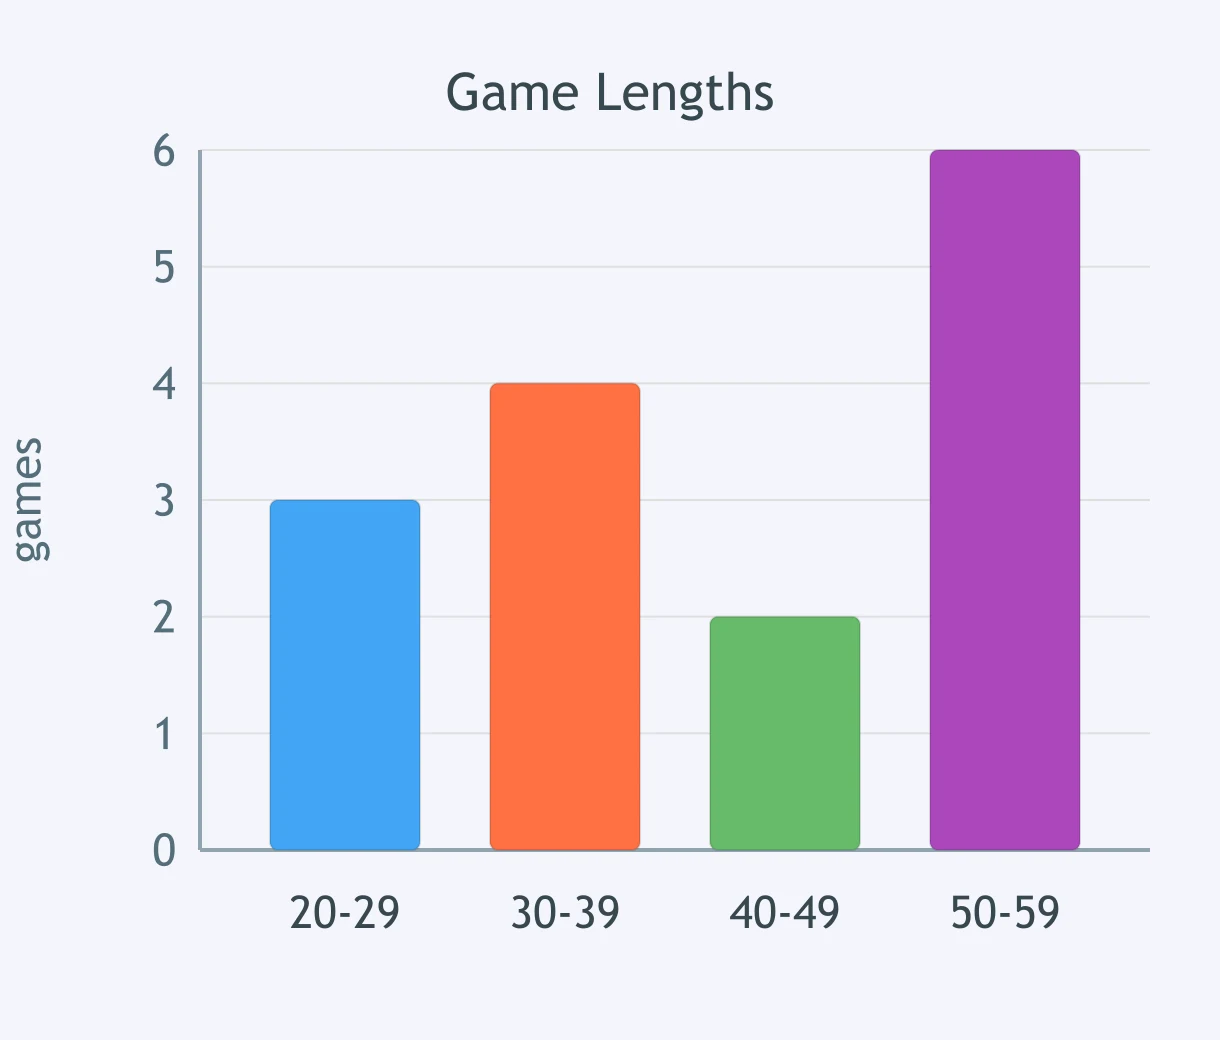
Use the histogram. How many games lasted 40-49 minutes?
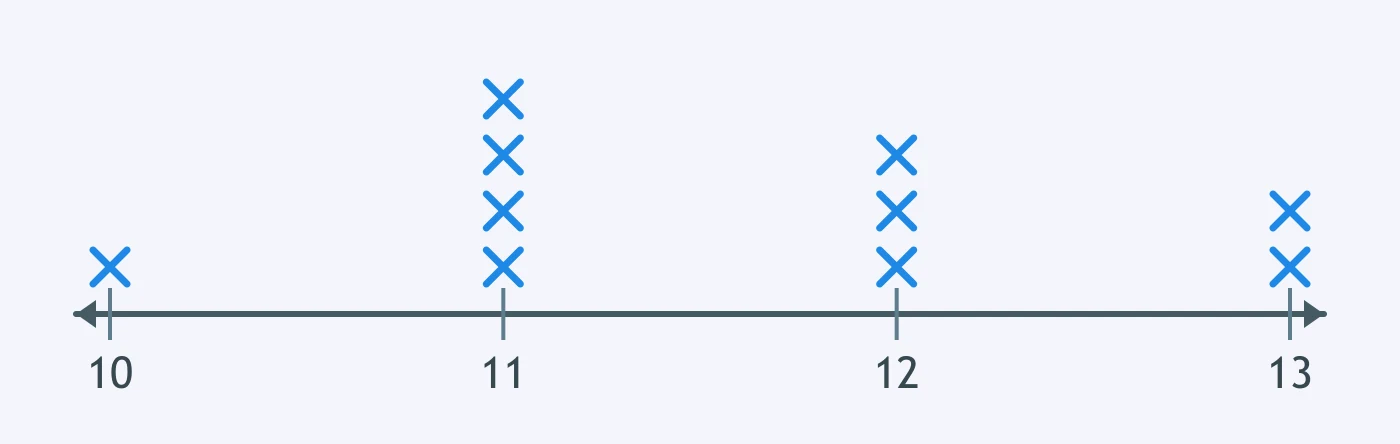
Use the dot plot. How many trials measured 12 cm?
A box plot has minimum 12 cm, Q1 15 cm, median 18 cm, Q3 24 cm, and maximum 28 cm. What is the interquartile range?
A box plot has minimum 4 min, Q1 9 min, median 14 min, Q3 21 min, and maximum 25 min. At what value is the line inside the box drawn?
A box plot has minimum 35 points, Q1 41 points, median 50 points, Q3 57 points, and maximum 61 points. What is the range?
A box plot has minimum 18 kg, Q1 22 kg, median 28 kg, Q3 31 kg, and maximum 35 kg. What is the interquartile range?
A box plot has minimum 7 L, Q1 12 L, median 15 L, Q3 19 L, and maximum 23 L. At what value does the right whisker end?
Use the dot plot. What is the median number of kilometers walked?
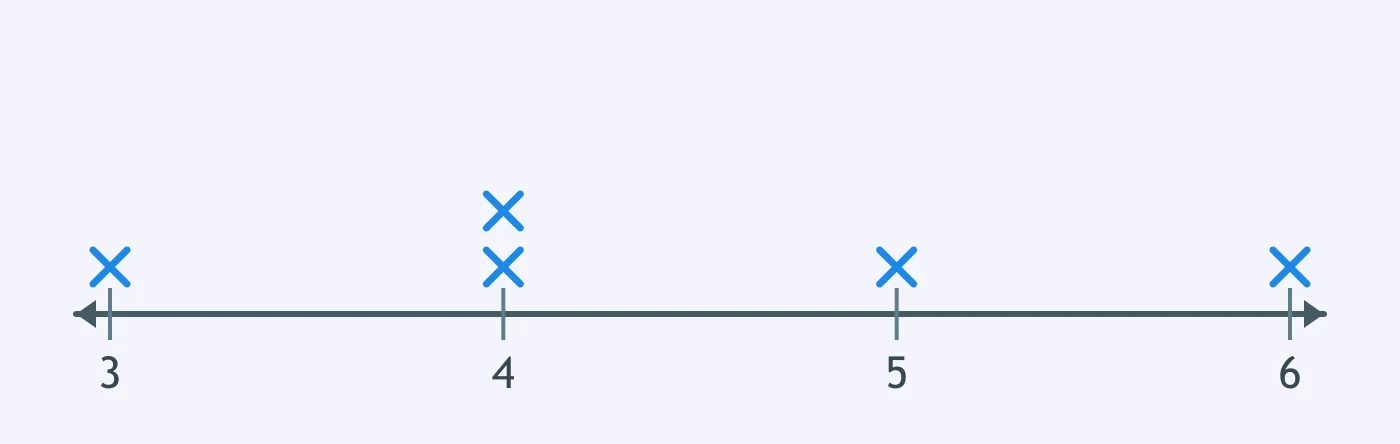
Use the dot plot. What is the range of the number of rainy days?
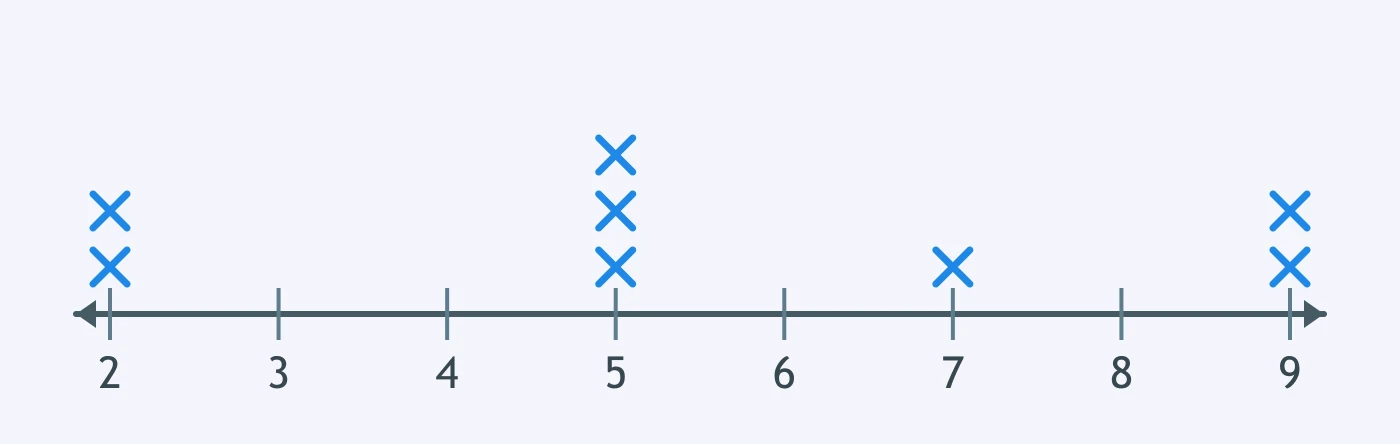
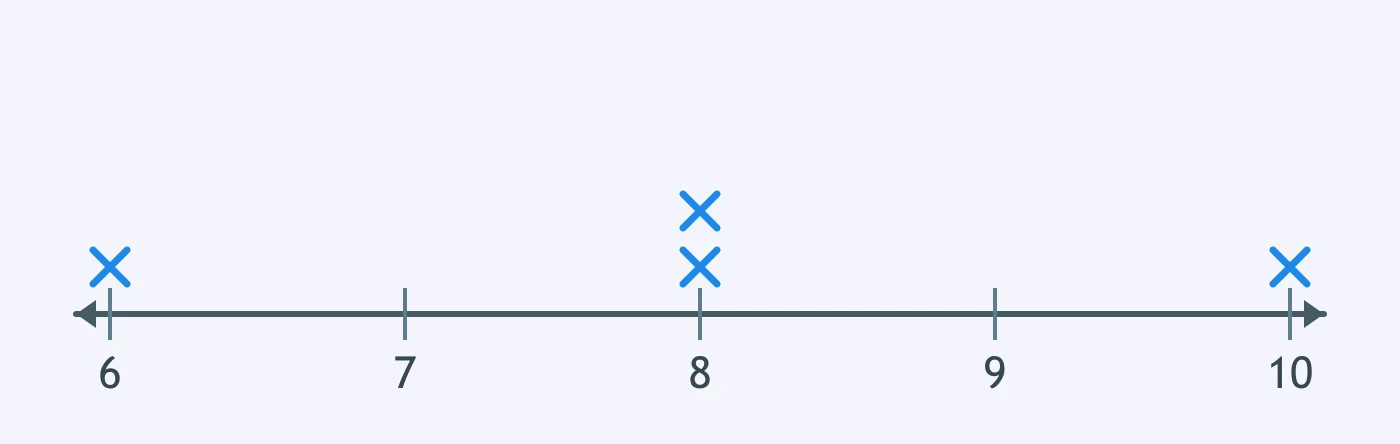
Use the dot plot. What is the mode of the plant growth measurements?
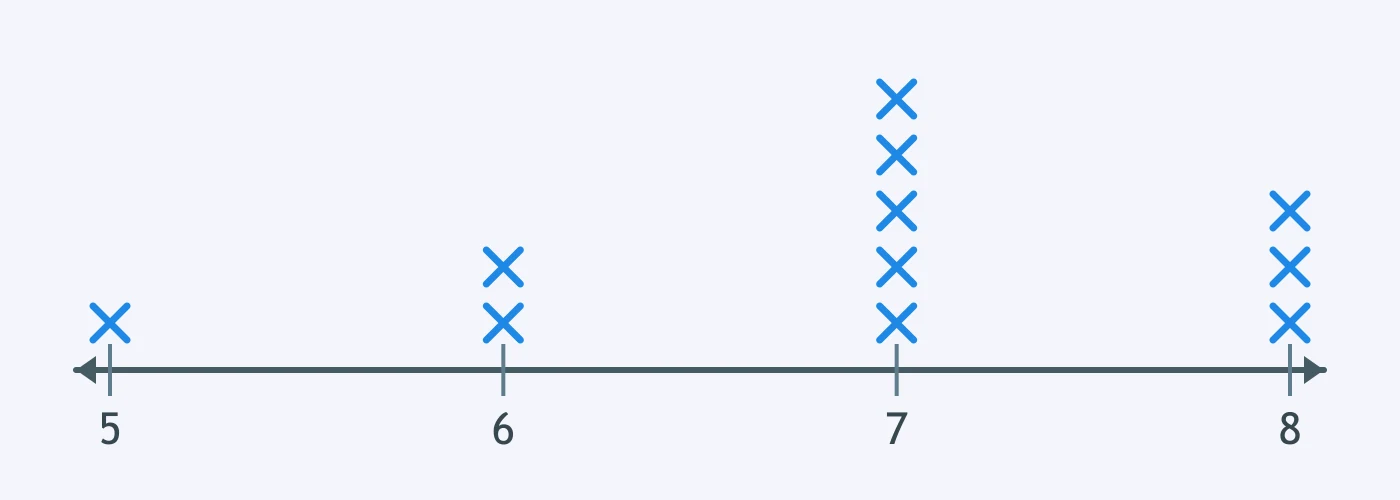
Use the dot plot. What is the mean amount of water used?
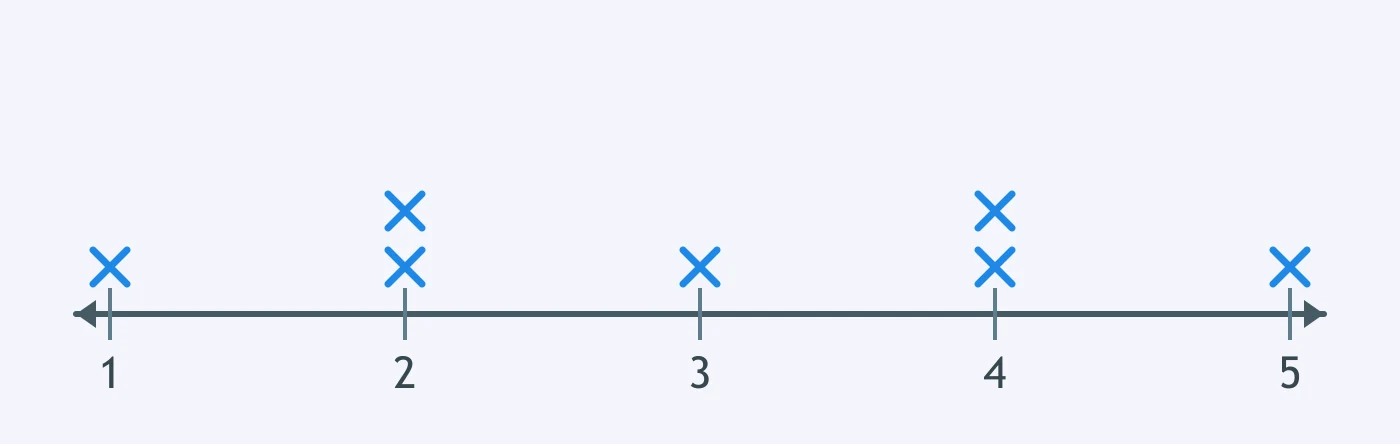
Use the dot plot. What is the mean absolute deviation of the lengths?
Use the histogram. The display has 20 data values. Which interval contains the median value?
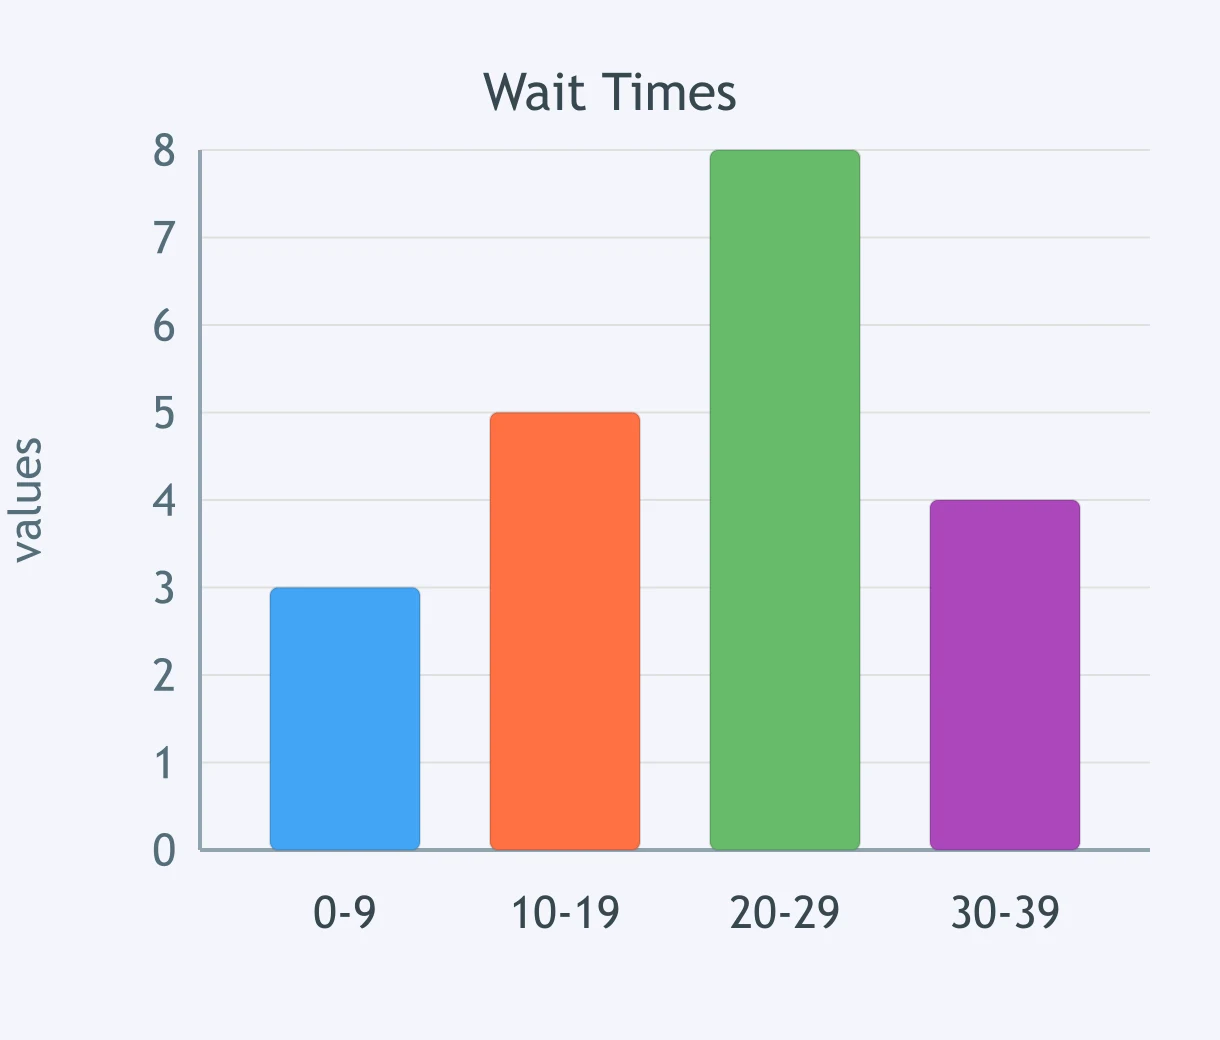
Use the histogram. The display has 16 data values. Which interval contains the median value?
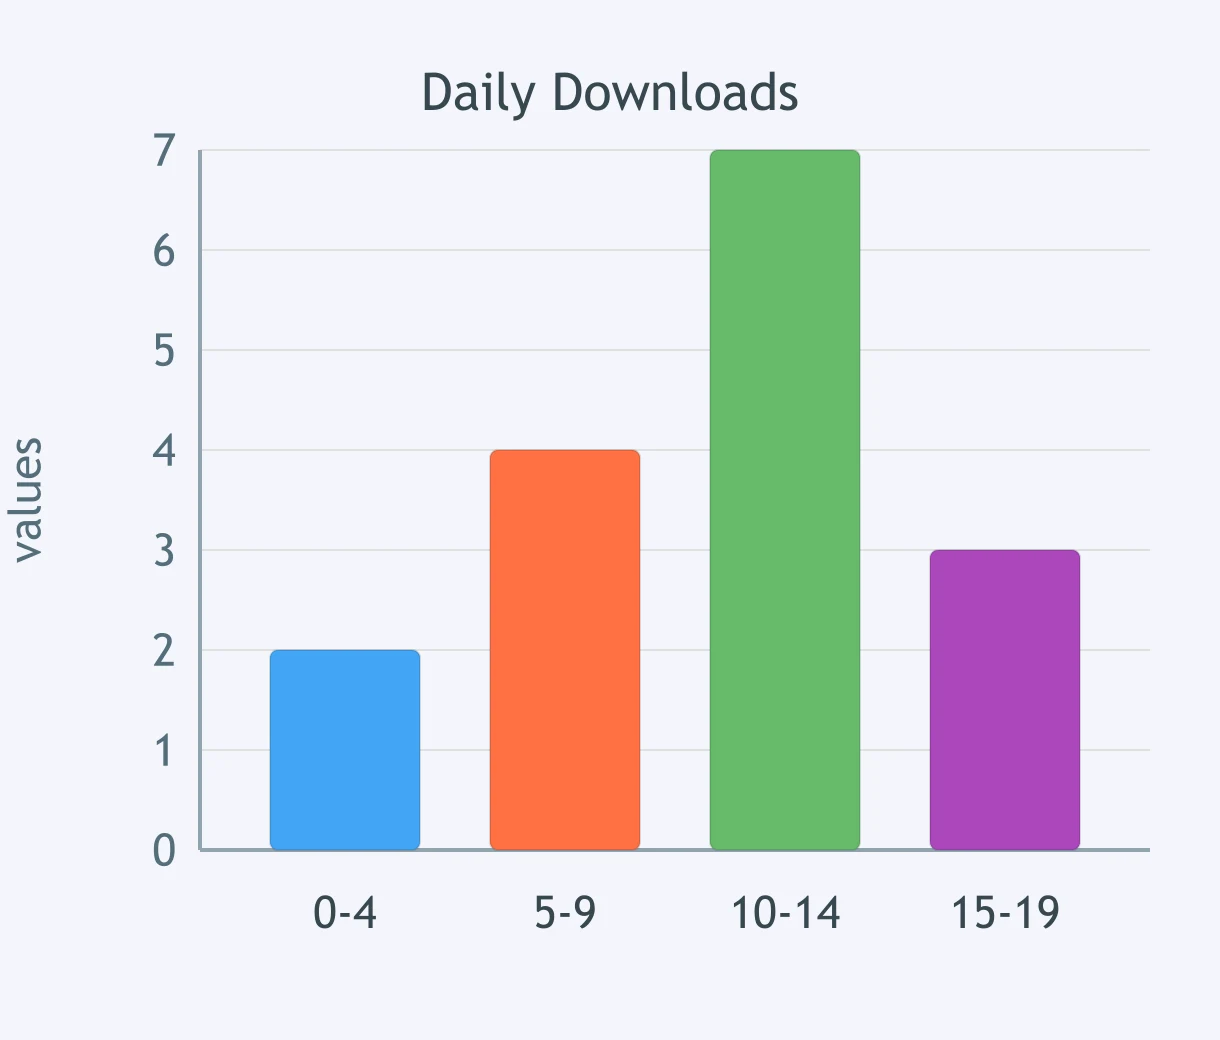
A box plot has minimum 11 s, Q1 14 s, median 20 s, Q3 26 s, and maximum 30 s. At what value is the right edge of the box?
Use the dot plot. What is the interquartile range of the scores?
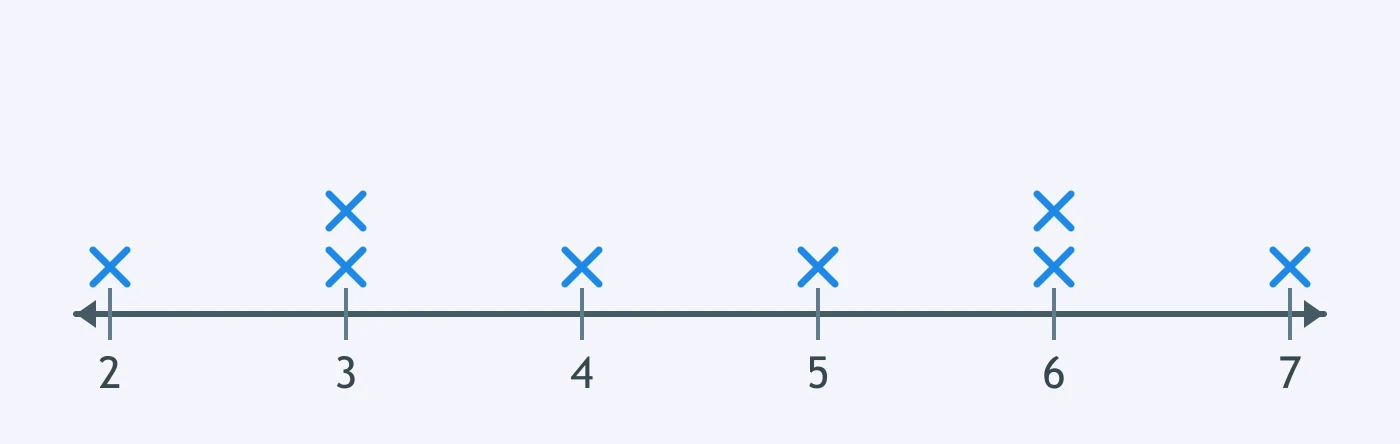
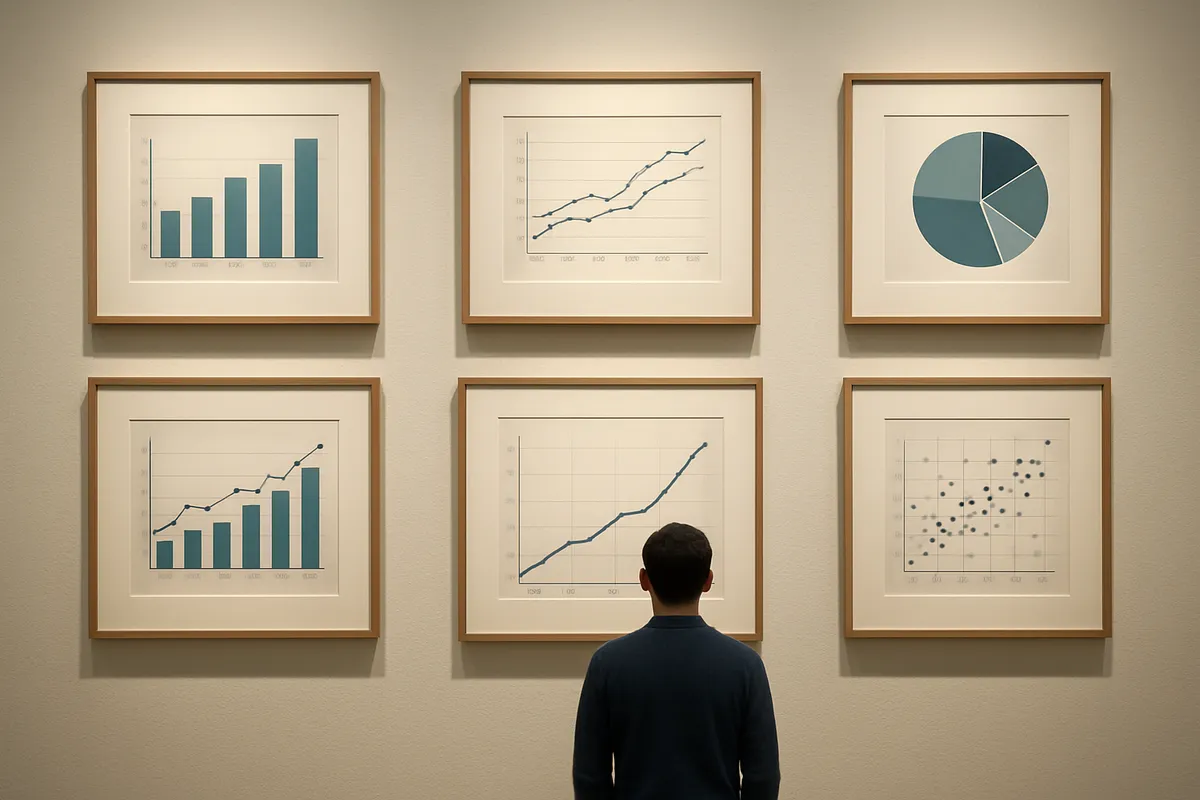
A class has 18 shoe sizes and wants to show each exact size with its frequency. Should it use a dot plot, box plot, histogram, or circle graph?
A library records 120 reading times and wants counts for 0-9, 10-19, and 20-29 minute intervals. Choose dot plot, box plot, histogram, or circle graph.
A coach wants to compare the medians and IQRs of two teams' jump distances. Choose dot plots, box plots, histograms, or circle graphs.
A scientist has 15 plant heights and wants to show each height and any repeated heights. Choose dot plot, box plot, histogram, or circle graph.
A survey has 300 ages and needs counts in 10-year intervals. Choose dot plot, box plot, histogram, or circle graph.
A teacher wants to display the minimum, Q1, median, Q3, and maximum of test times. Choose dot plot, box plot, histogram, or circle graph.
A student tracks 12 daily temperatures and wants to show repeated exact temperature values. Choose dot plot, box plot, histogram, or circle graph.
A city has 500 commute times and wants counts in 15-minute groups. Choose dot plot, box plot, histogram, or circle graph.
Two classes' quiz scores need a comparison of center and spread, not every score. Choose dot plots, box plots, histograms, or circle graphs.
A store records 20 prices and wants to show each exact price and duplicates. Choose dot plot, box plot, histogram, or circle graph.
A clinic has 240 wait times and wants bars for 0-4, 5-9, and 10-14 minute groups. Choose dot plot, box plot, histogram, or circle graph.
A researcher has two samples summarized by minimum, Q1, median, Q3, and maximum. Choose dot plots, box plots, histograms, or circle graphs.
Crack the passcode before the zombies get in.
Answer, then swat bugs for bonus points.
Race through questions at your own speed.
Same question on every screen. Fastest wins.

Pick a tile, answer, hit bonuses and steals.

Theoretical Probability of a Simple Event
40 questions