Loading
by BlastRoom
Read frequency tables, stem-and-leaf plots, and bar graphs to compare data.
#data_displays#us_grade_4_math
22 questions
One question set, multiple game modes. Tap any game to see it in action. Not sure which to pick?
Answer to place stones and capture territory.
Outrun the snow together.
Earn blasts, then hunt the other team.
Answer to earn energy, then climb.

The class blasts through walls together.
Bid on mystery lots. Most money wins.
Sell tours. Nice, standard, or a total scam.

Answer, restock, and serve the rush.
More correct answers pulls the rope your way.
Answer, then shoot down the alien wave.
Answer, then tap to leap the frozen ridge.
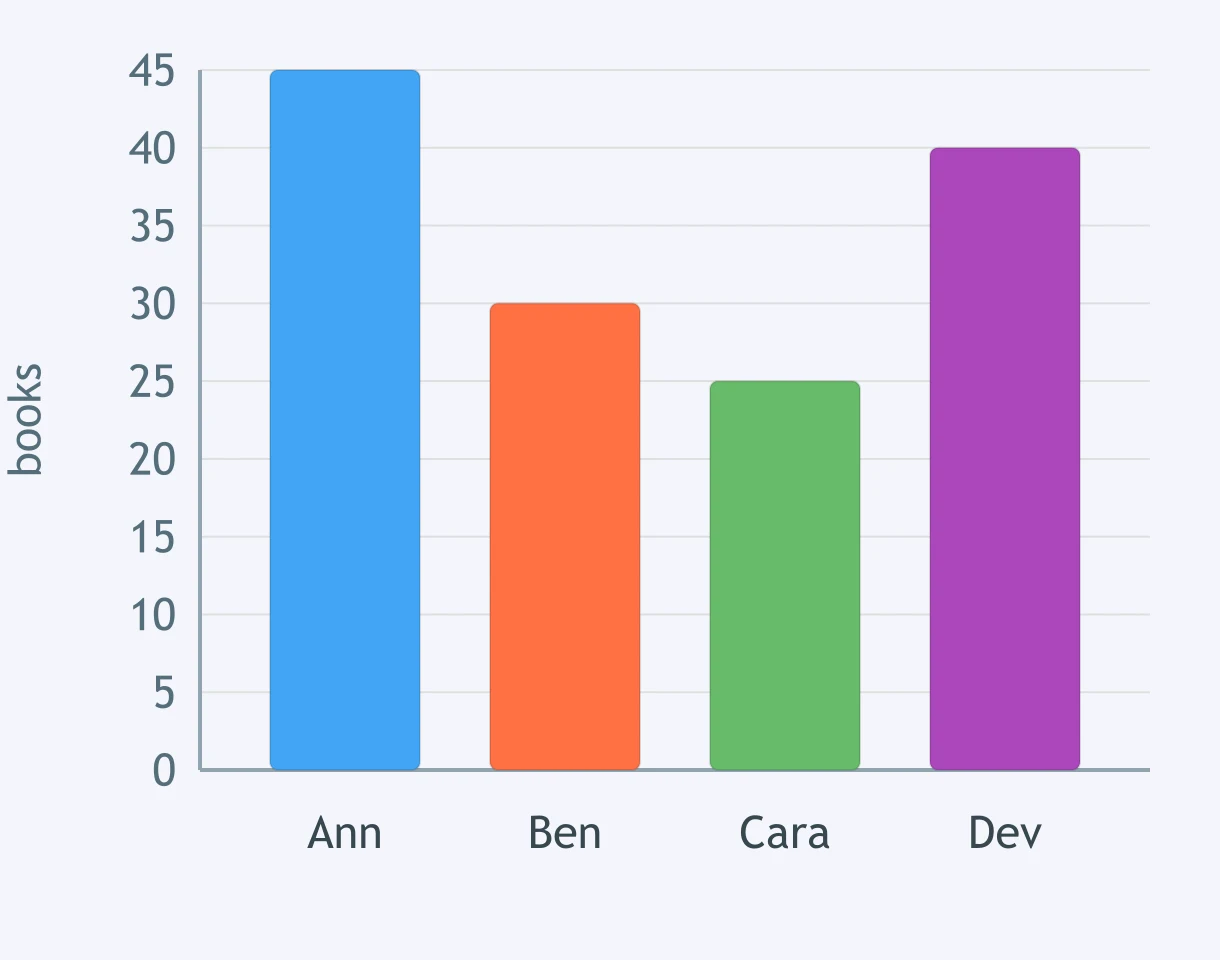
A bar graph shows how many books Ann, Ben, Cara, and Dev read. How many more books did Ann read than Cara?
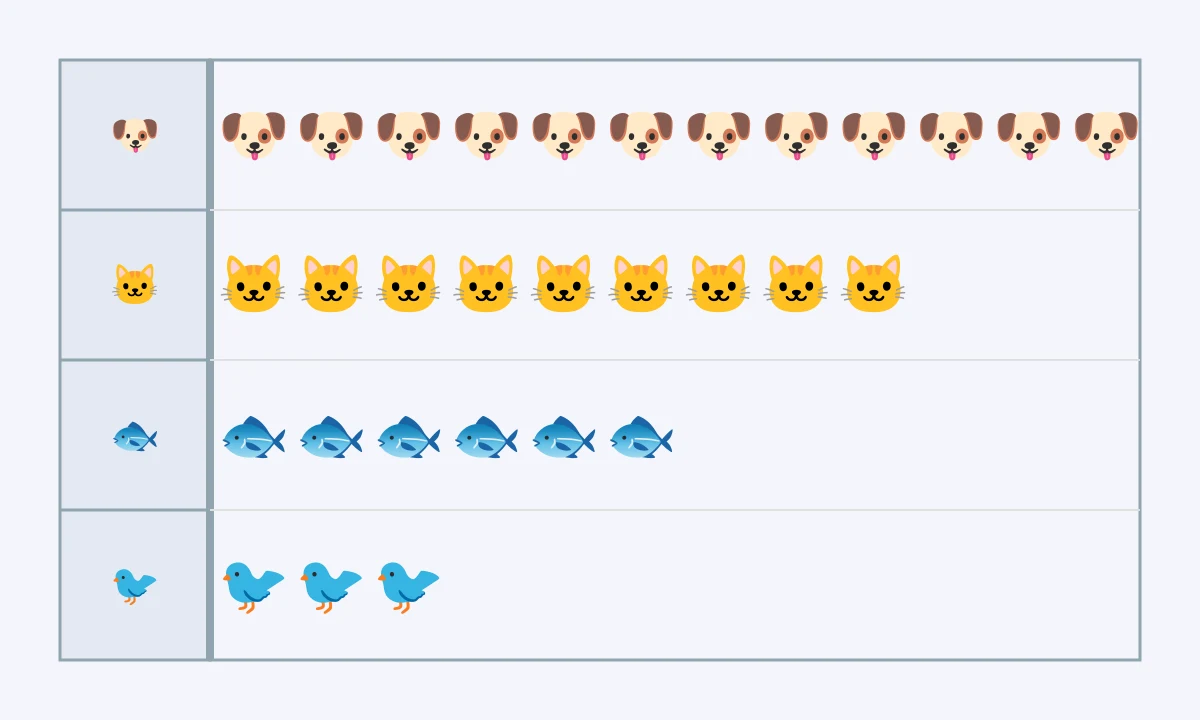
A picture graph shows favorite pet choices for dog, cat, fish, and bird. Dog was chosen how many times as often as bird?
In a stem-and-leaf plot, stem 3 with leaves 1 and 4 means 31 and 34. What number does stem 5 with leaf 2 mean?
A stem-and-leaf plot lists test scores 62, 65, 68, 71, 74, 80, 83, 89. How many scores are in the 70s?
The bar graph gives the votes for pizza, tacos, pasta, and salad. Which food got the second most votes?
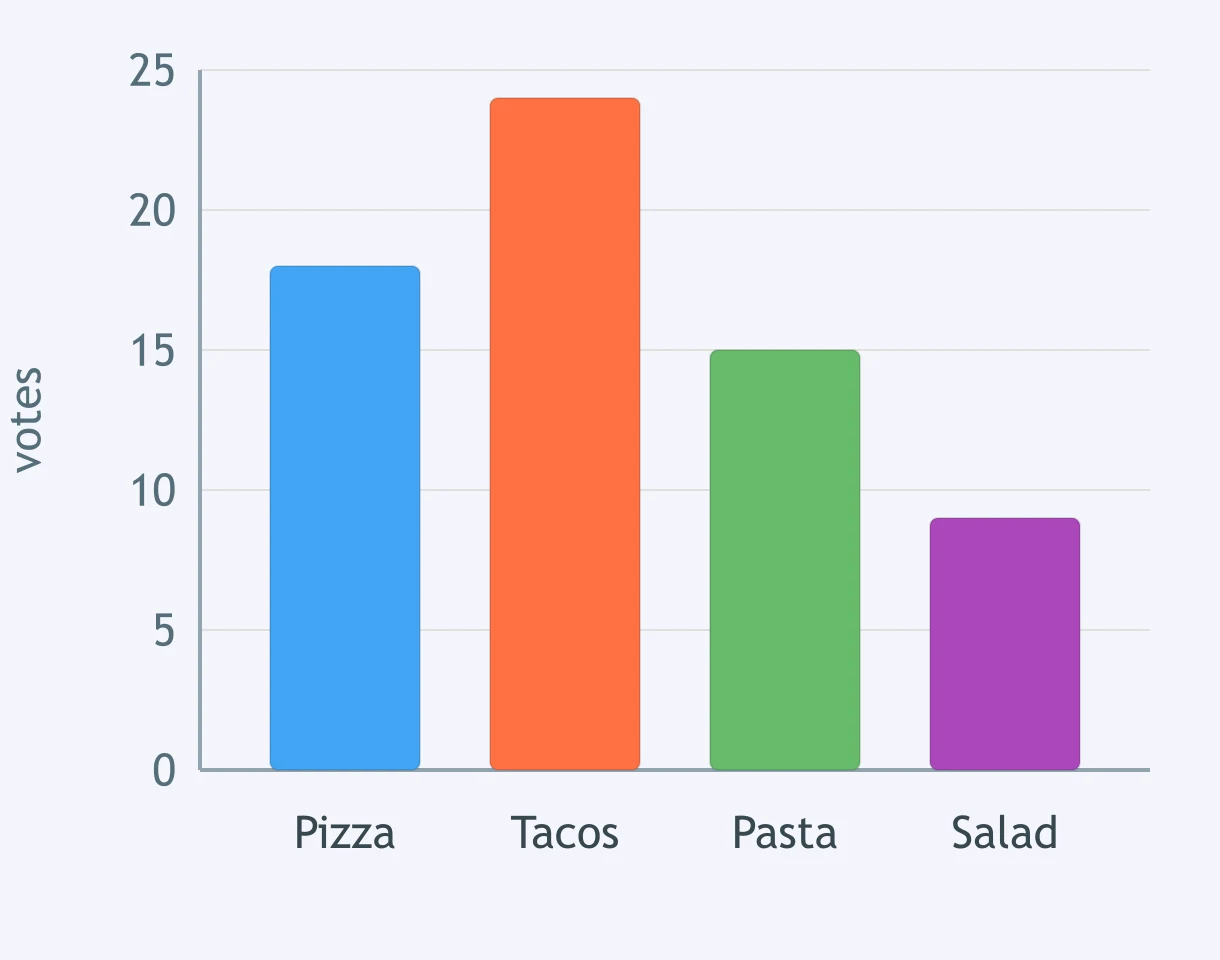
A frequency table shows minutes read: Mon 25, Tue 30, Wed 20, Thu 35. How many minutes were read in all four days? ___
A bar graph counts by 5s. Ana's bar stops at the fourth mark above zero. How many does the bar show? ___
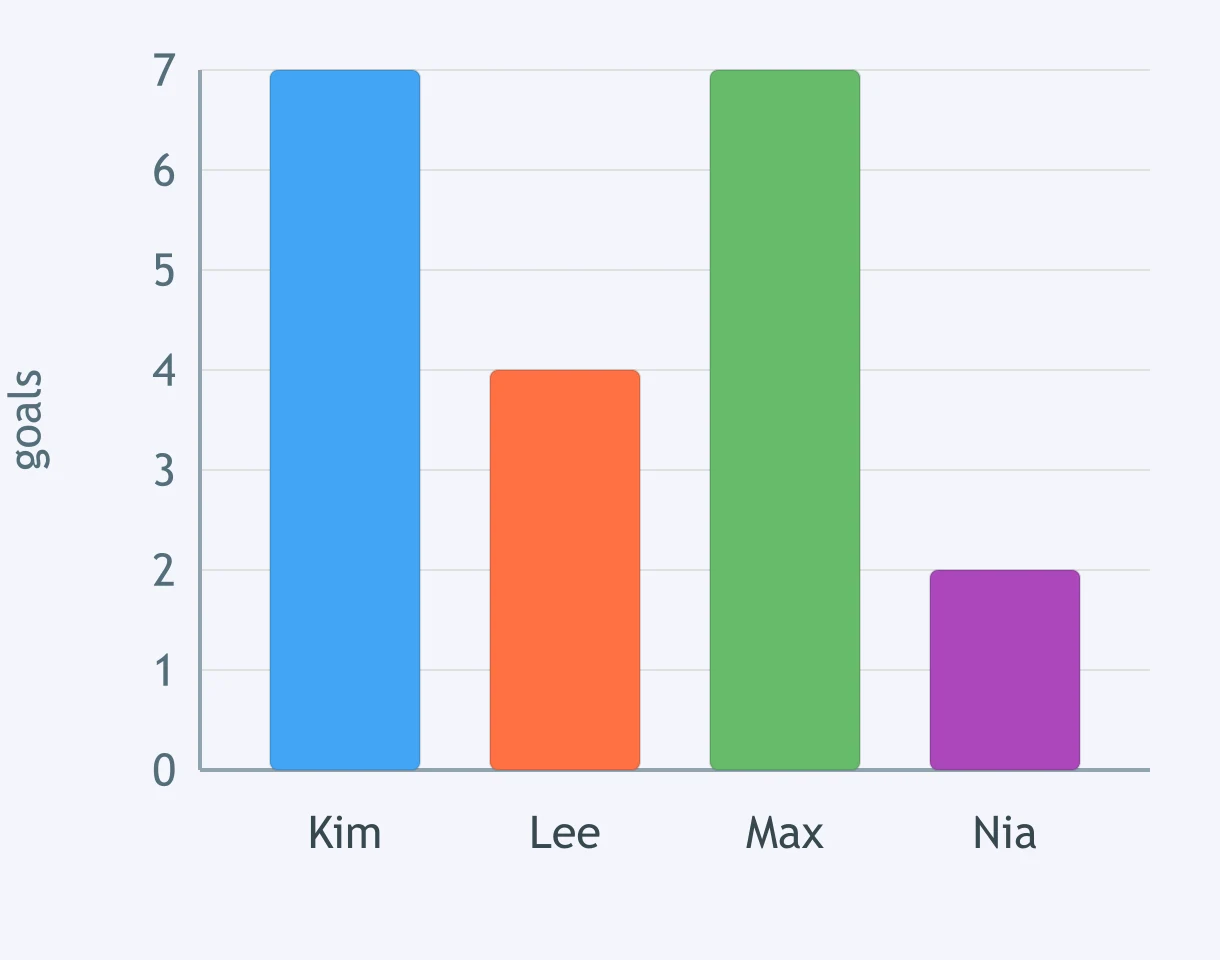
A bar graph compares the goals scored by Kim, Lee, Max, and Nia. Is this statement true or false: Kim and Max scored the same number of goals?
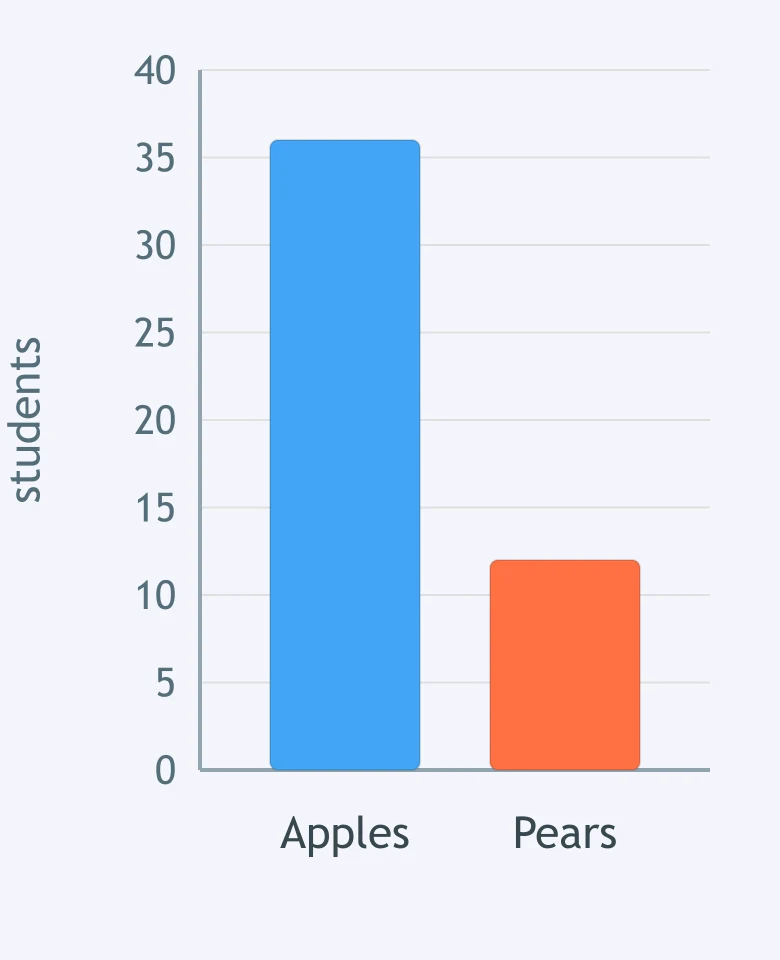
A bar graph of fruit chosen shows apples 36 and pears 12. It shows twice as many apples as pears.
Which display groups numbers by their tens digit and lists each ones digit beside it?
A bar graph shows books read: Mia 8, Noah 5, Ava 8, and Liam 3. Who read the same number of books?
A table shows favorite fruits: apples 12, bananas 9, grapes 6, oranges 10. How many more students chose apples than grapes?
In a pictograph, each star stands for 2 votes. Soccer has 7 stars. How many votes does soccer have?
A line plot shows ribbon lengths in inches: 4, 4, 5, 6, 6, 6, 7. Which length appears most often?
A survey table shows pets owned: dogs 11, cats 8, fish 5, birds 2. How many pets are shown in all?
A bar graph should have labels so readers know what the bars and numbers mean.
A line plot shows scores: 10, 10, 20, 20, 20, 30, 40. How many scores are shown?
A pictograph key says each circle equals 5 tickets. If the theater row has 4 circles, how many tickets were sold?
A bar graph shows minutes practiced: Piano 30, Violin 45, Drums 25, Flute 45. Which instruments had the greatest practice time?
A frequency table shows how many students picked each game: tag 14, jump rope 7, kickball 9. How many fewer students picked jump rope than tag?
In a line plot, each X usually represents one data value.
A table shows sunny days by month: March 16, April 18, May 21, June 20. Which month had the most sunny days?
Crack the passcode before the zombies get in.
Answer, then swat bugs for bonus points.
Race through questions at your own speed.
Same question on every screen. Fastest wins.

Pick a tile, answer, hit bonuses and steals.

Classifying Angles
40 questions