Loading
by BlastRoom
Read a graph qualitatively: where the quantity rises, falls or stays the same.
#us_grade_8_math

20 questions
One question set, multiple game modes. Tap any game to see it in action. Not sure which to pick?
Answer to place stones and capture territory.
Outrun the snow together.
Earn blasts, then hunt the other team.
Answer to earn energy, then climb.

The class blasts through walls together.
Bid on mystery lots. Most money wins.
Sell tours. Nice, standard, or a total scam.

Answer, restock, and serve the rush.
More correct answers pulls the rope your way.
Answer, then shoot down the alien wave.
Answer, then tap to leap the frozen ridge.
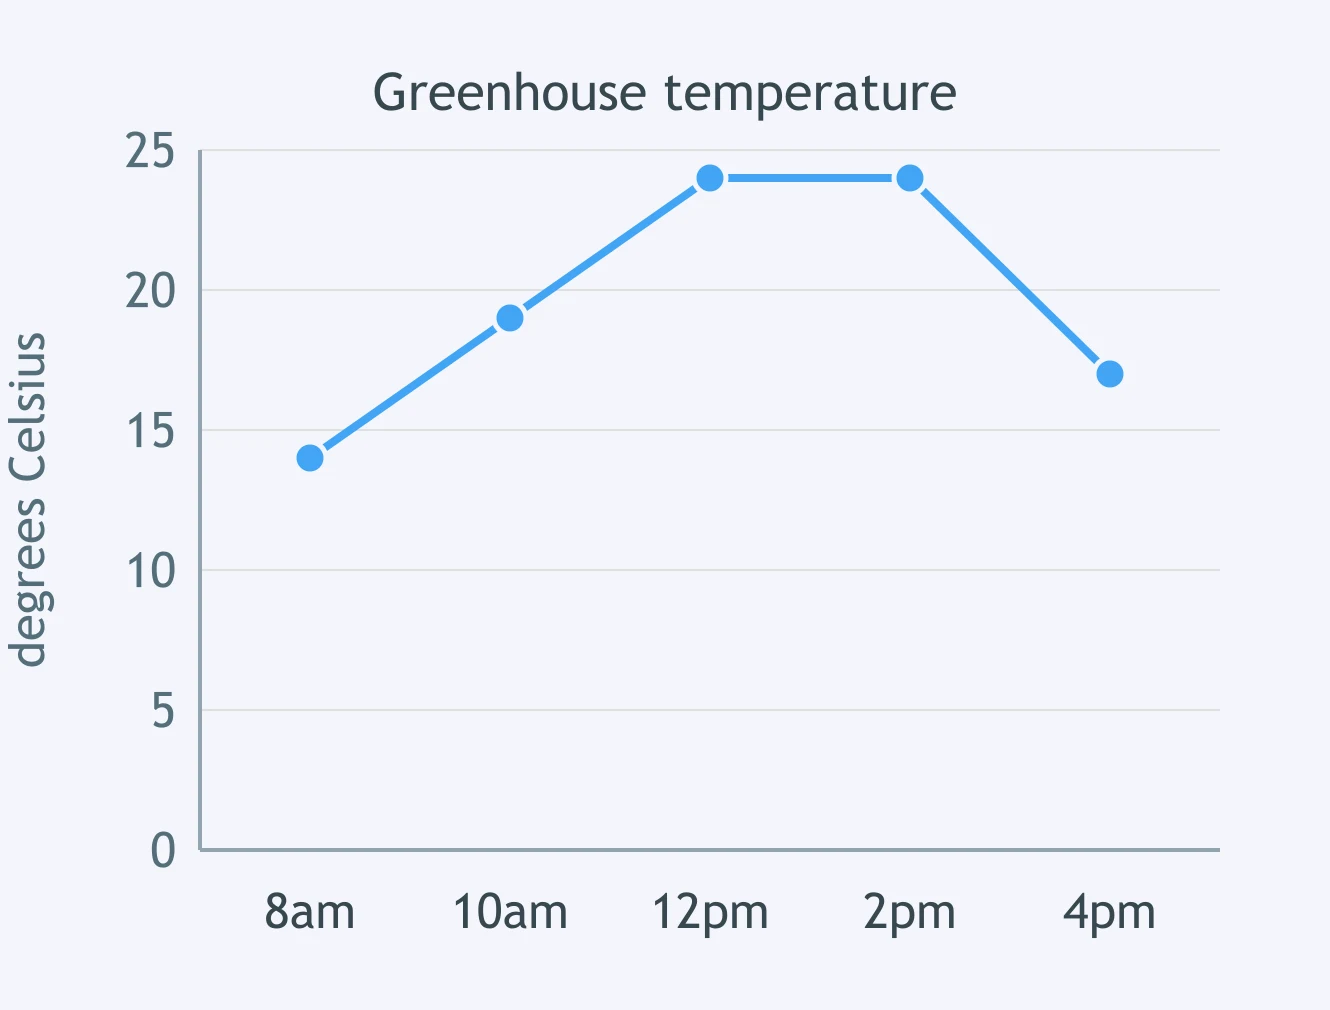
The graph shows the temperature inside a greenhouse through one day. What does the temperature do from 12 pm to 2 pm?
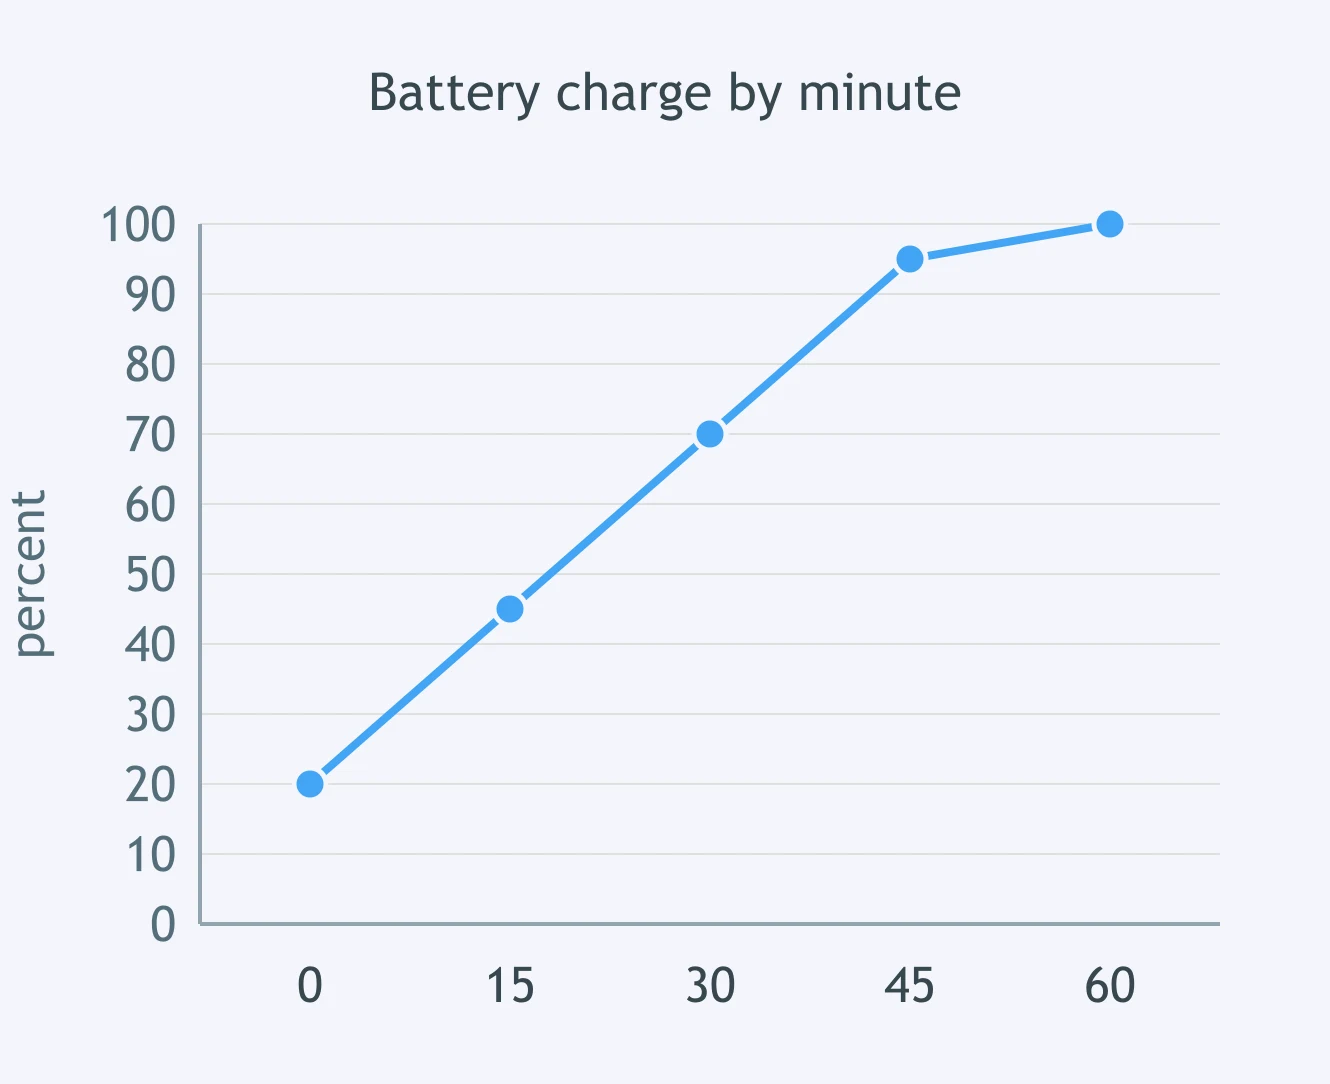
A phone is put on charge. Using the graph of its battery charge, what does the charge do from minute 0 to minute 45?
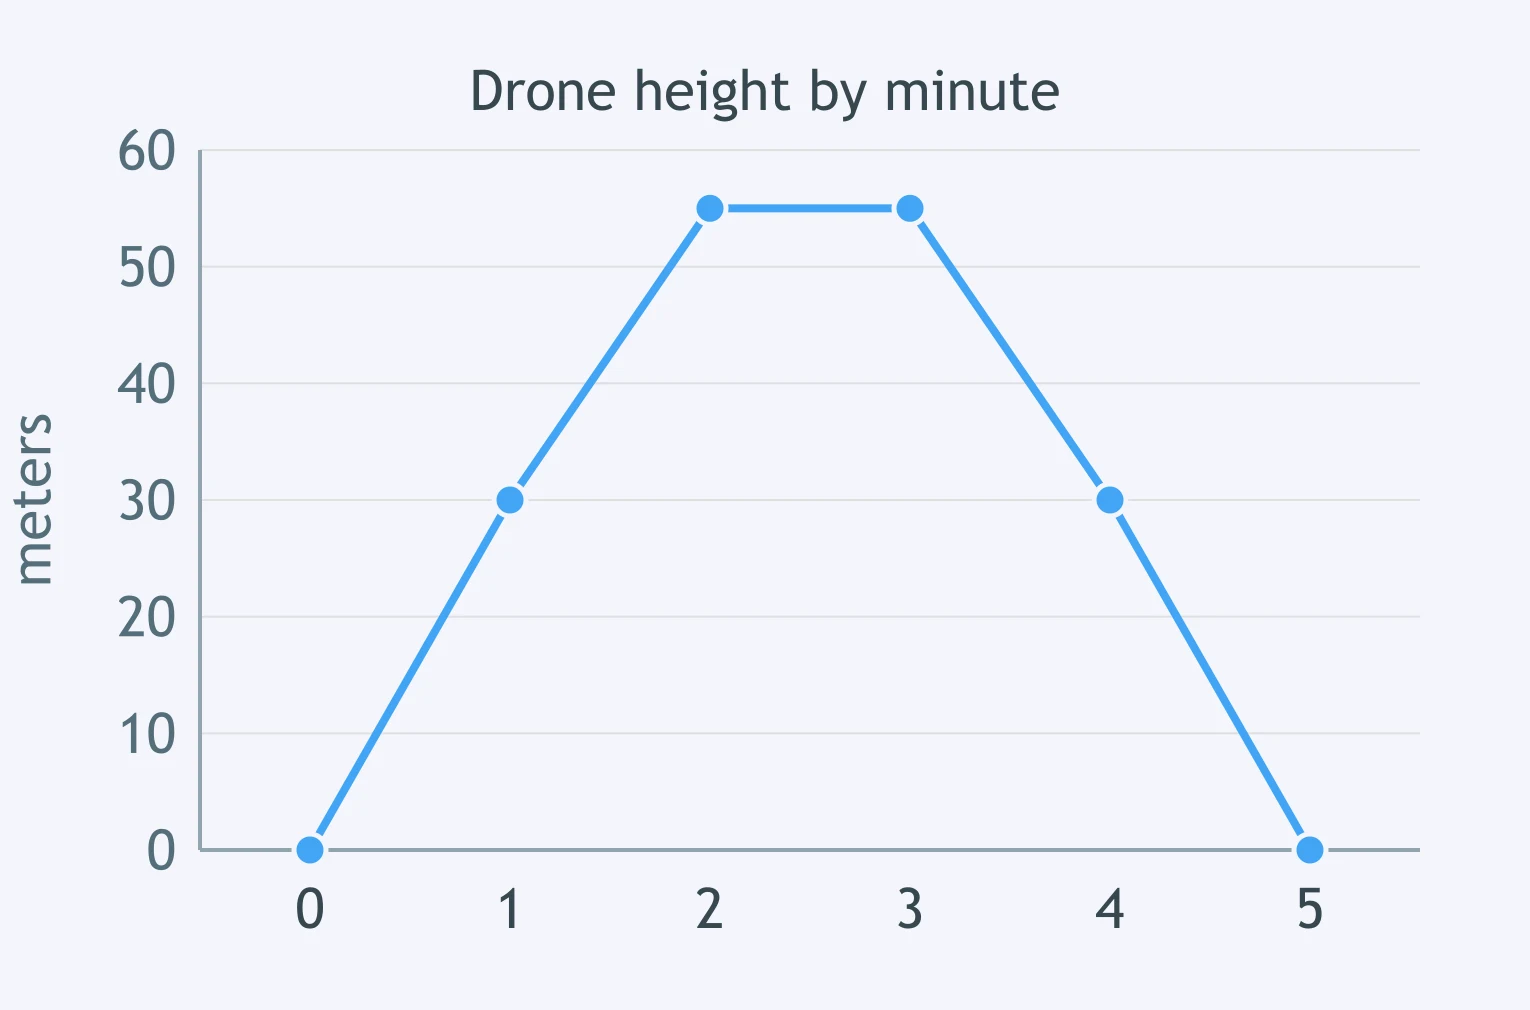
The graph shows a drone's height above the ground. What does the height do from minute 3 to minute 5?
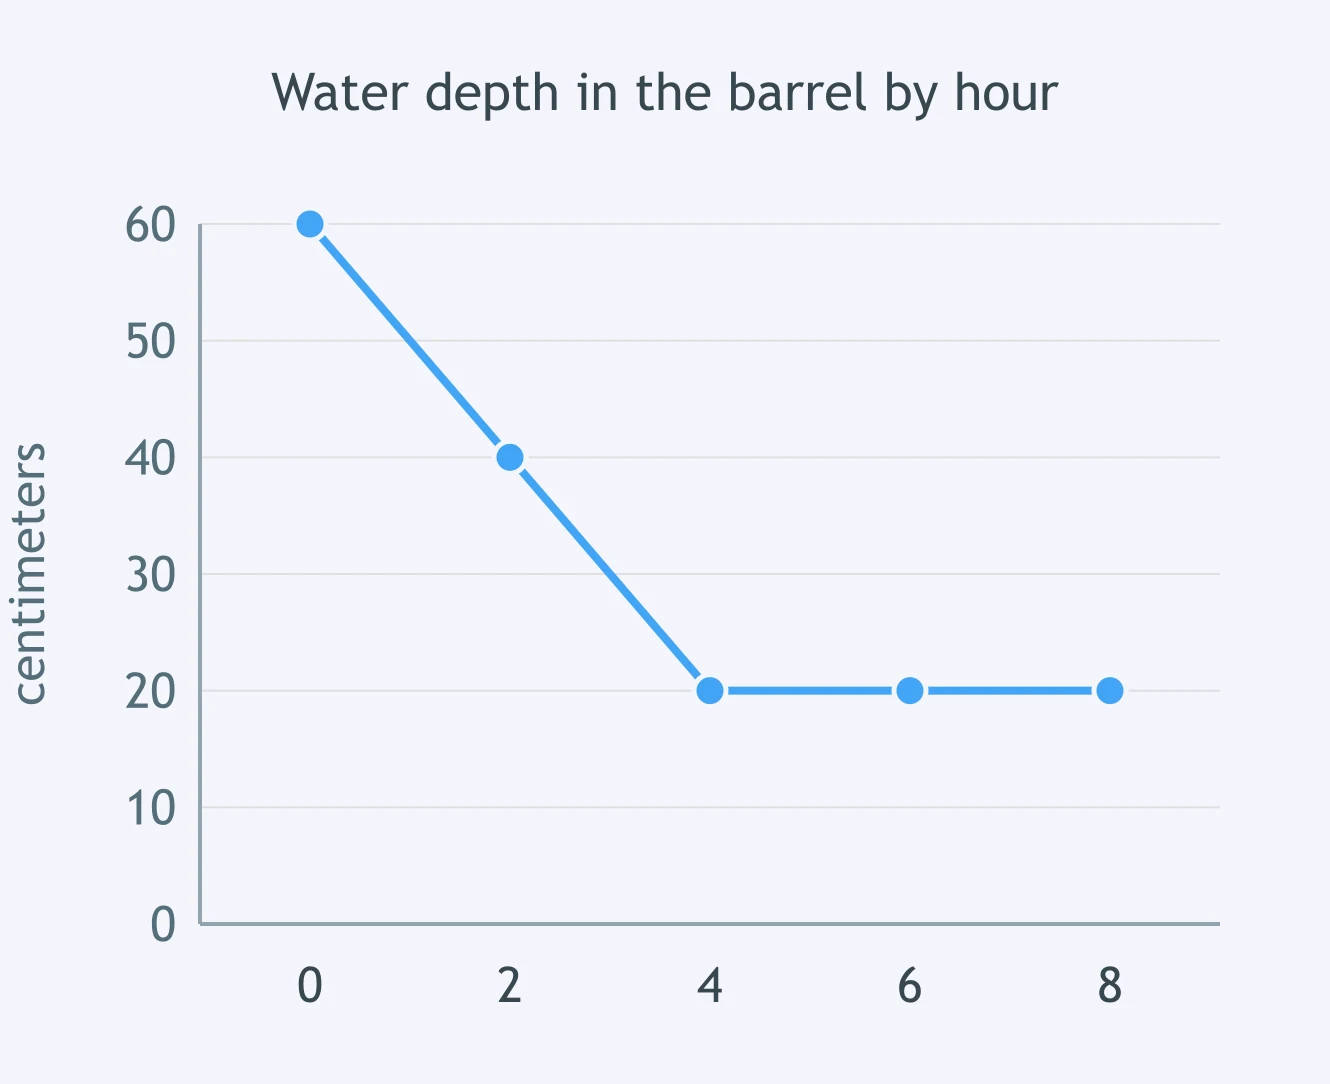
Water is drawn from a rain barrel. From hour 0 to hour 4, what does the depth of water in the barrel do?
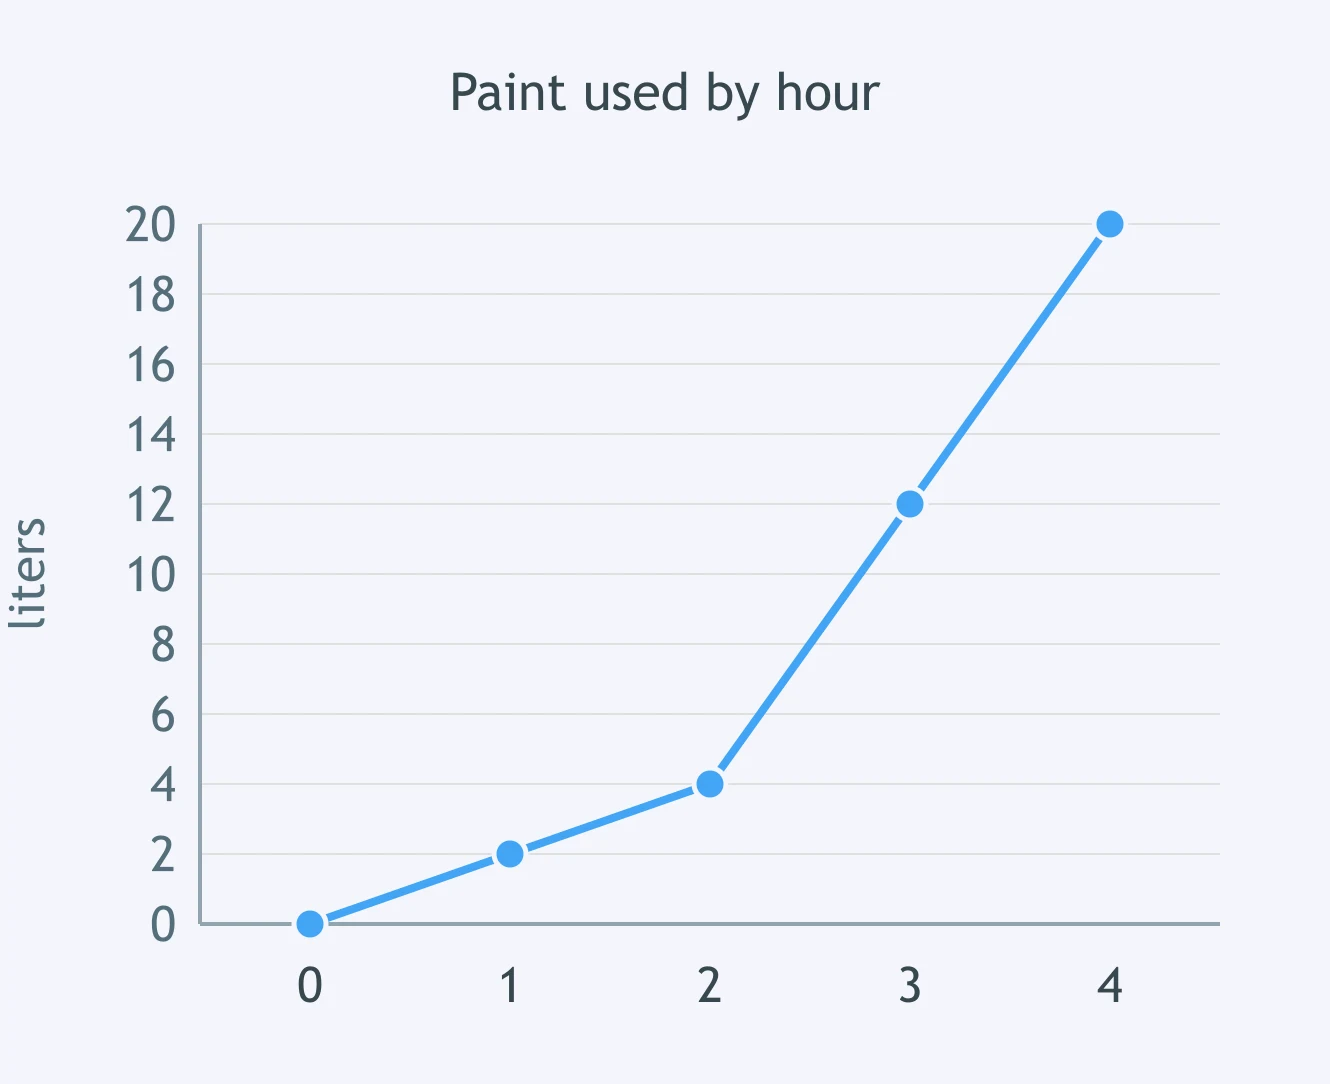
A painting crew records the paint it has used. What does the amount used do from hour 2 to hour 4?
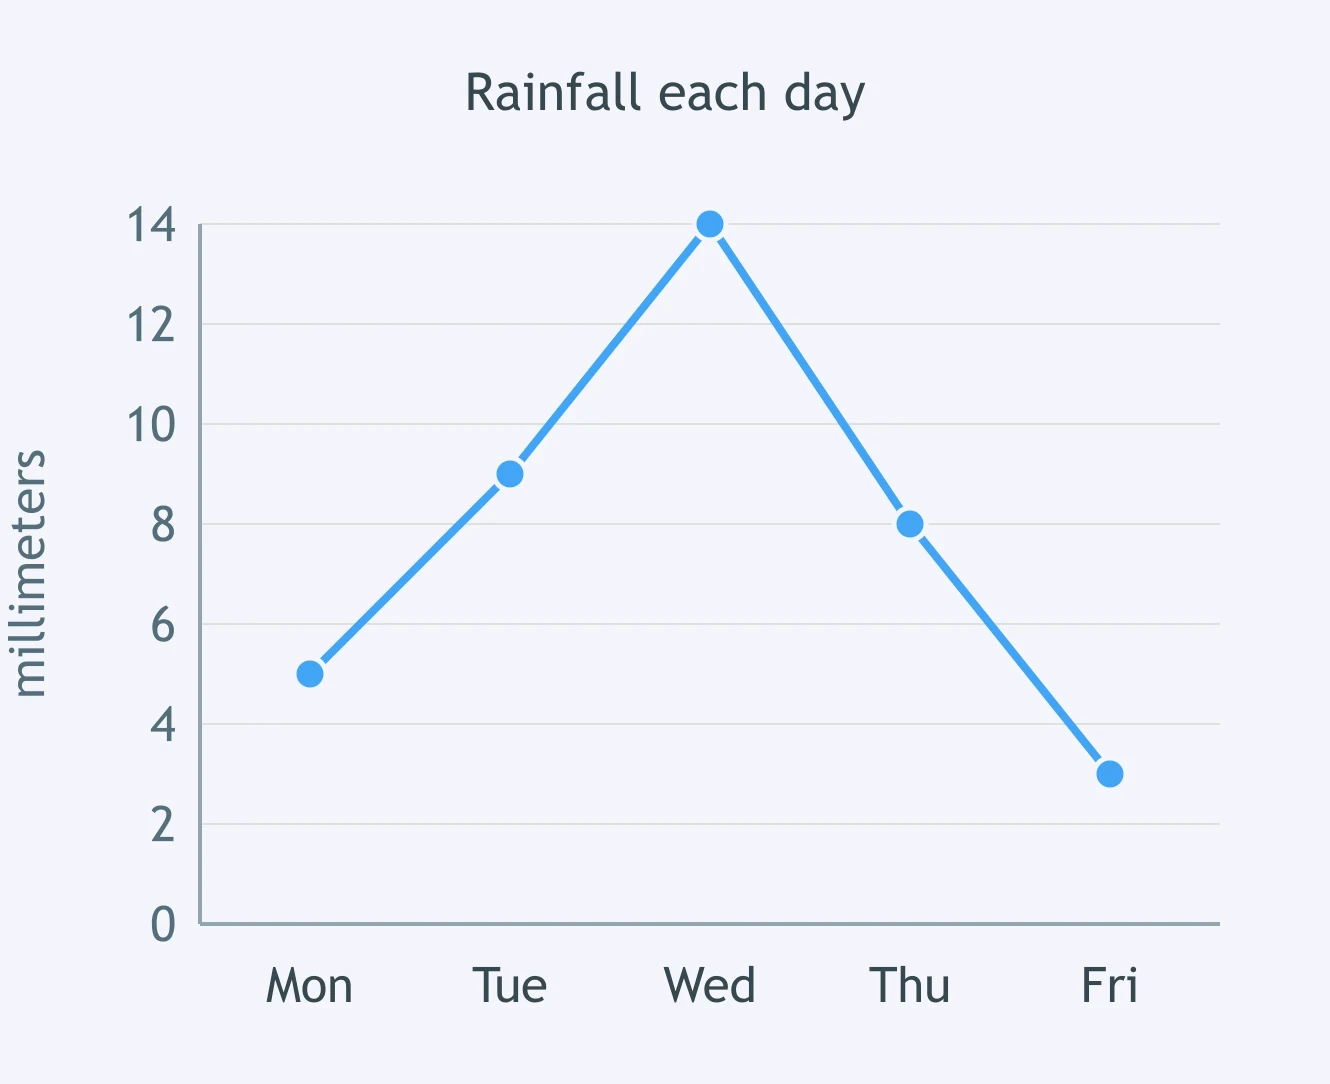
The graph shows the rainfall recorded on five days of one week. What does the rainfall do across the whole week, from Monday to Friday?
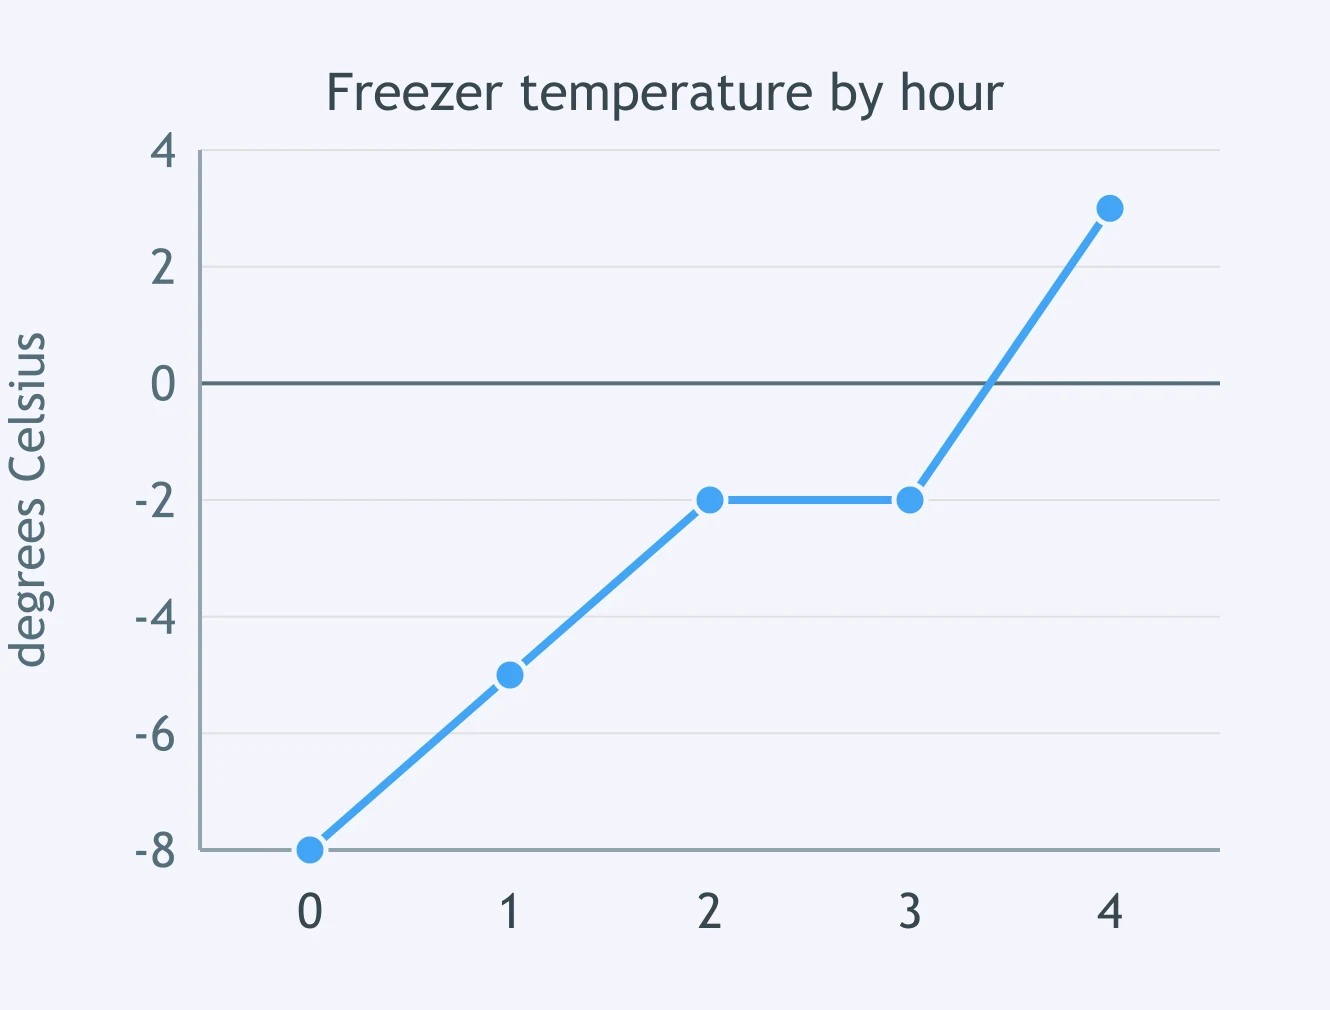
A freezer door is left open and the temperature inside is graphed. What does the temperature do from hour 0 to hour 2?
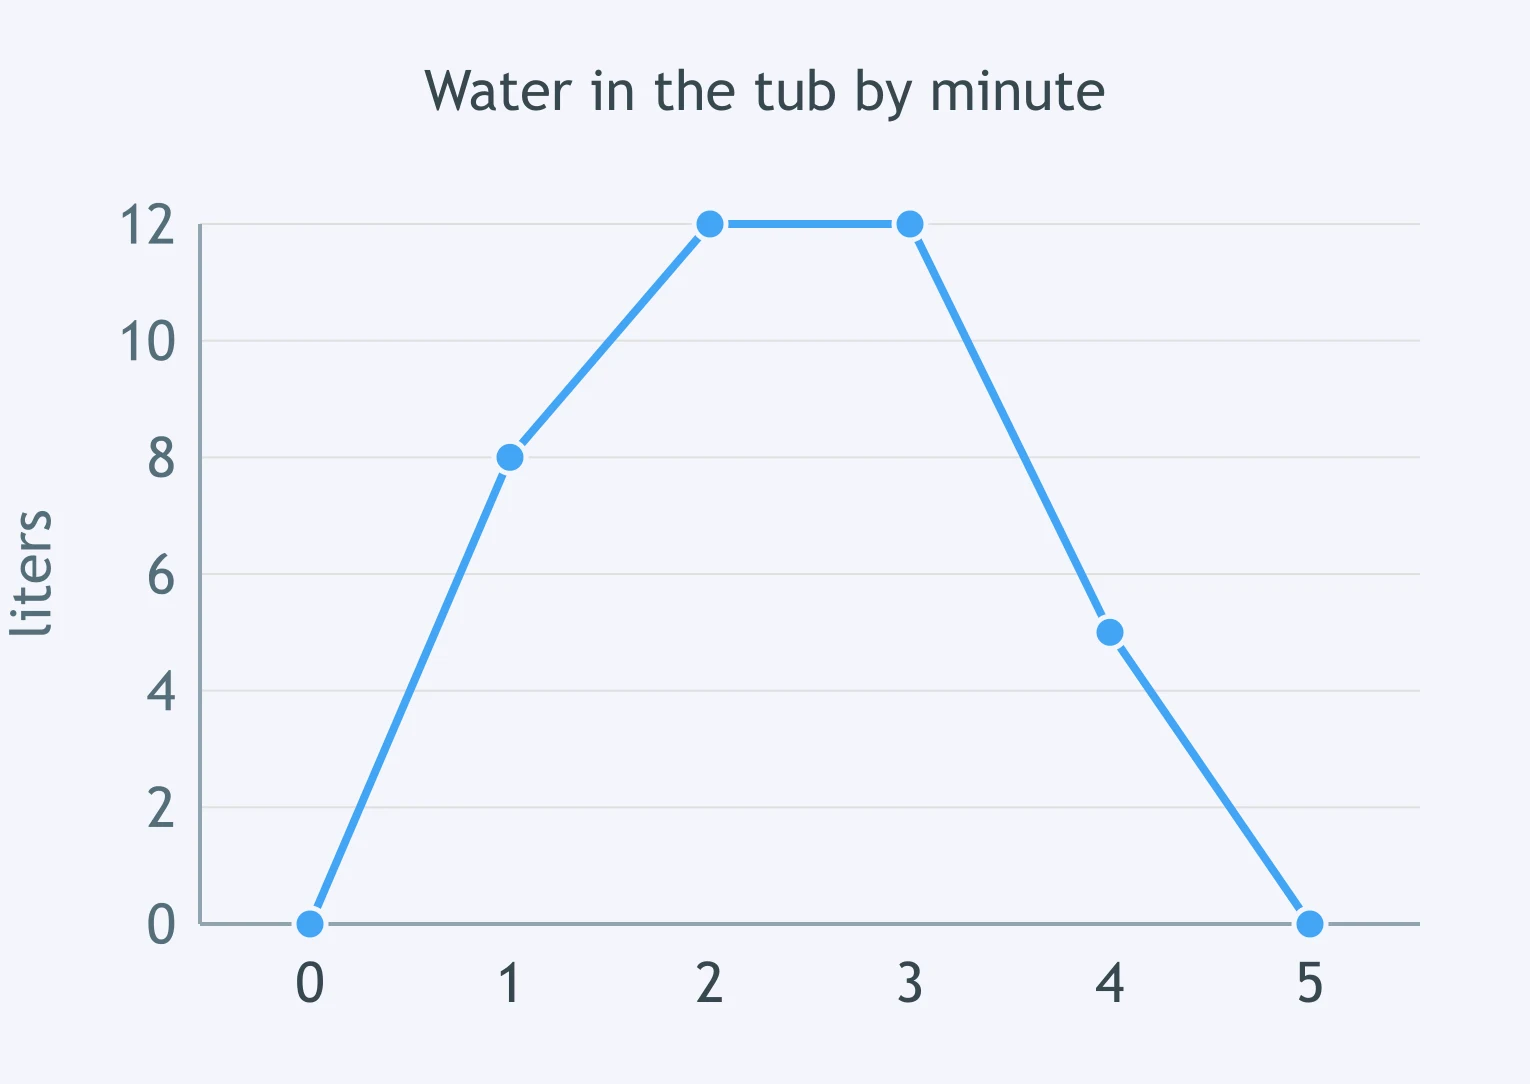
The graph shows the water in a tub as it is filled and then emptied. Over which one-minute interval does the amount of water fall the fastest?
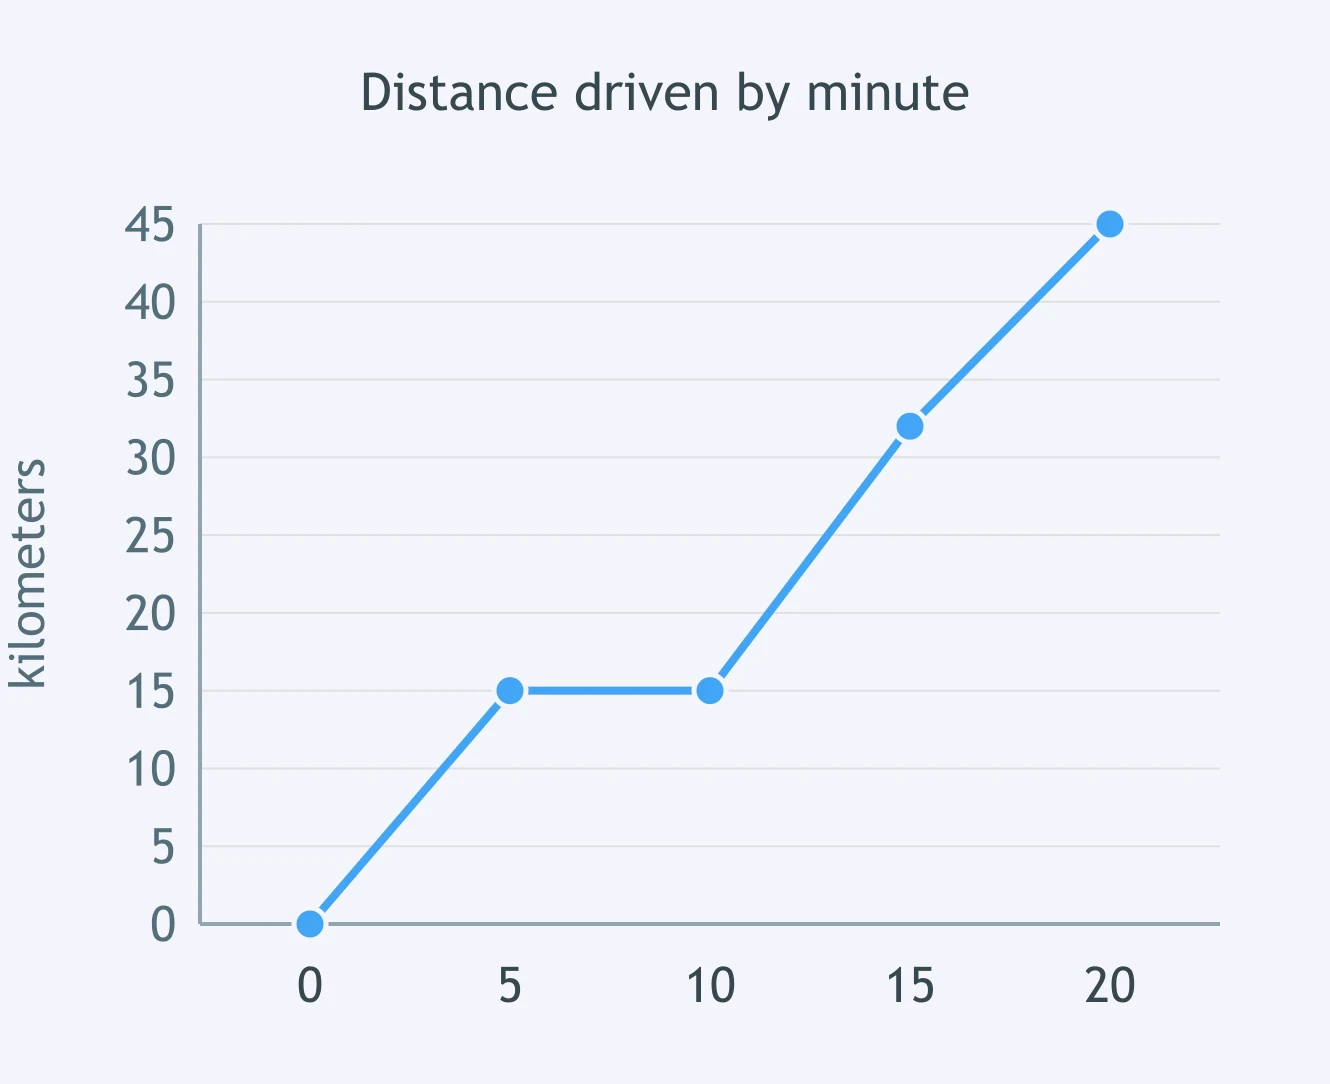
A driver records the total distance driven. Over which interval does the distance stay the same?
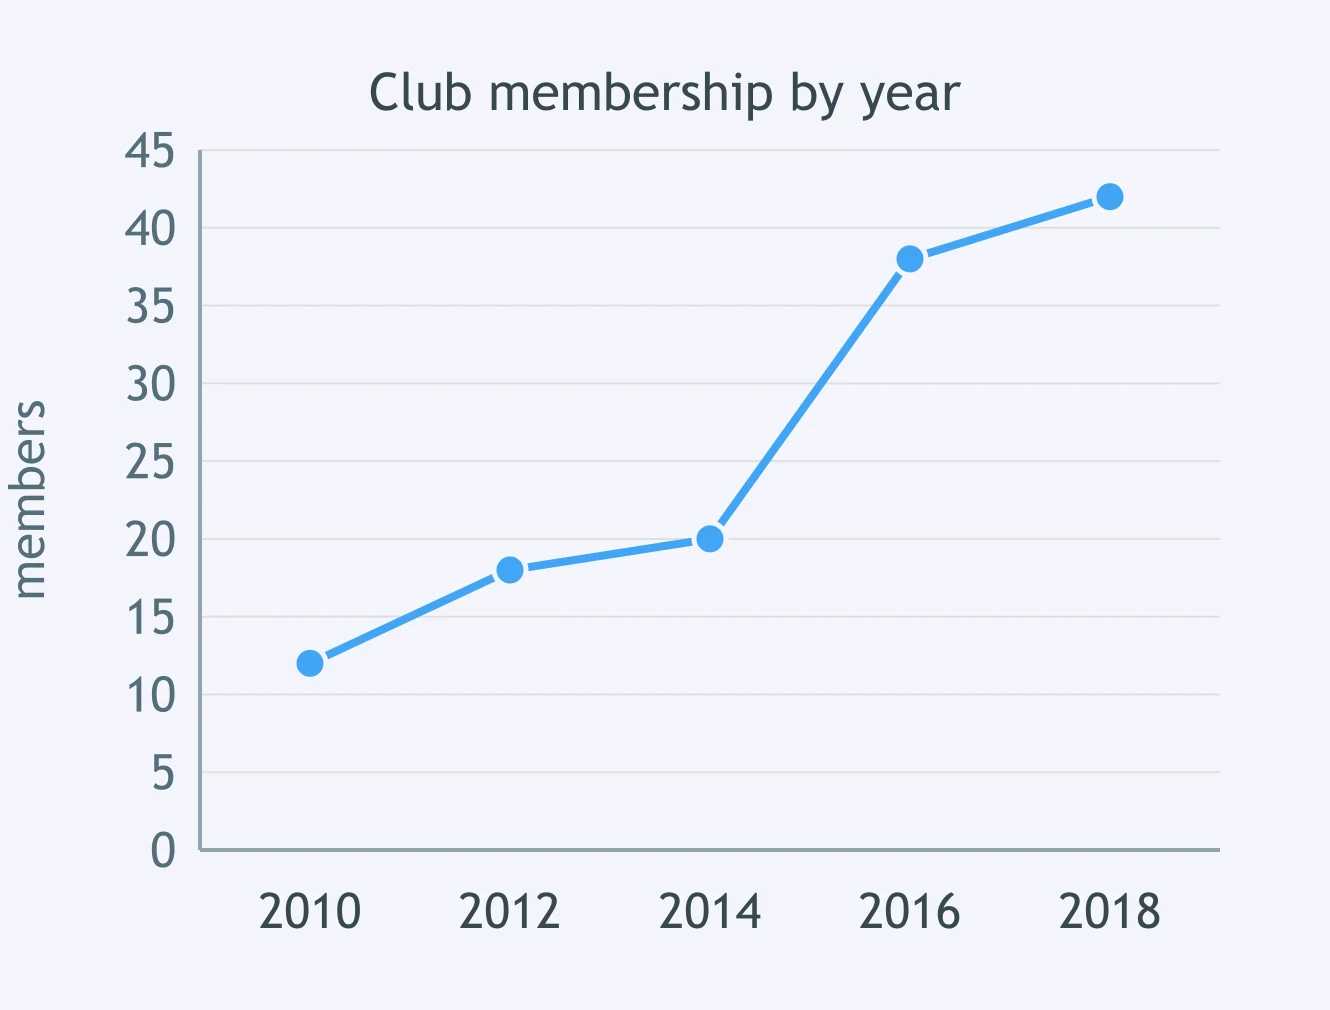
A running club graphs its membership every two years. Over which two-year interval does the membership rise the fastest?
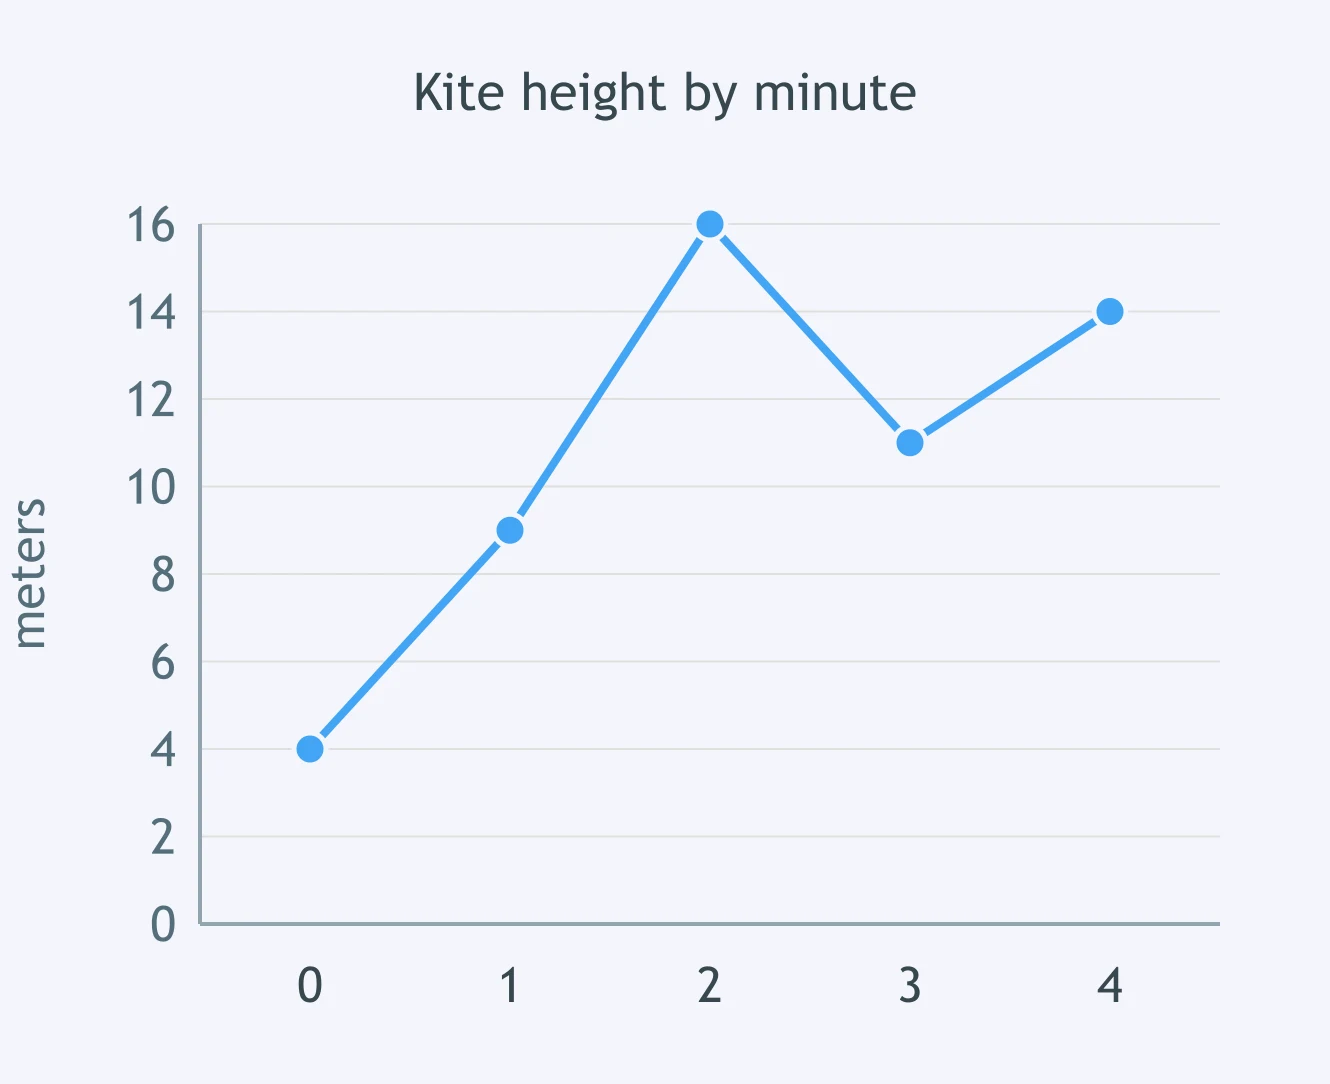
The graph shows the height of a kite above the ground. Over which one-minute interval does the height decrease?
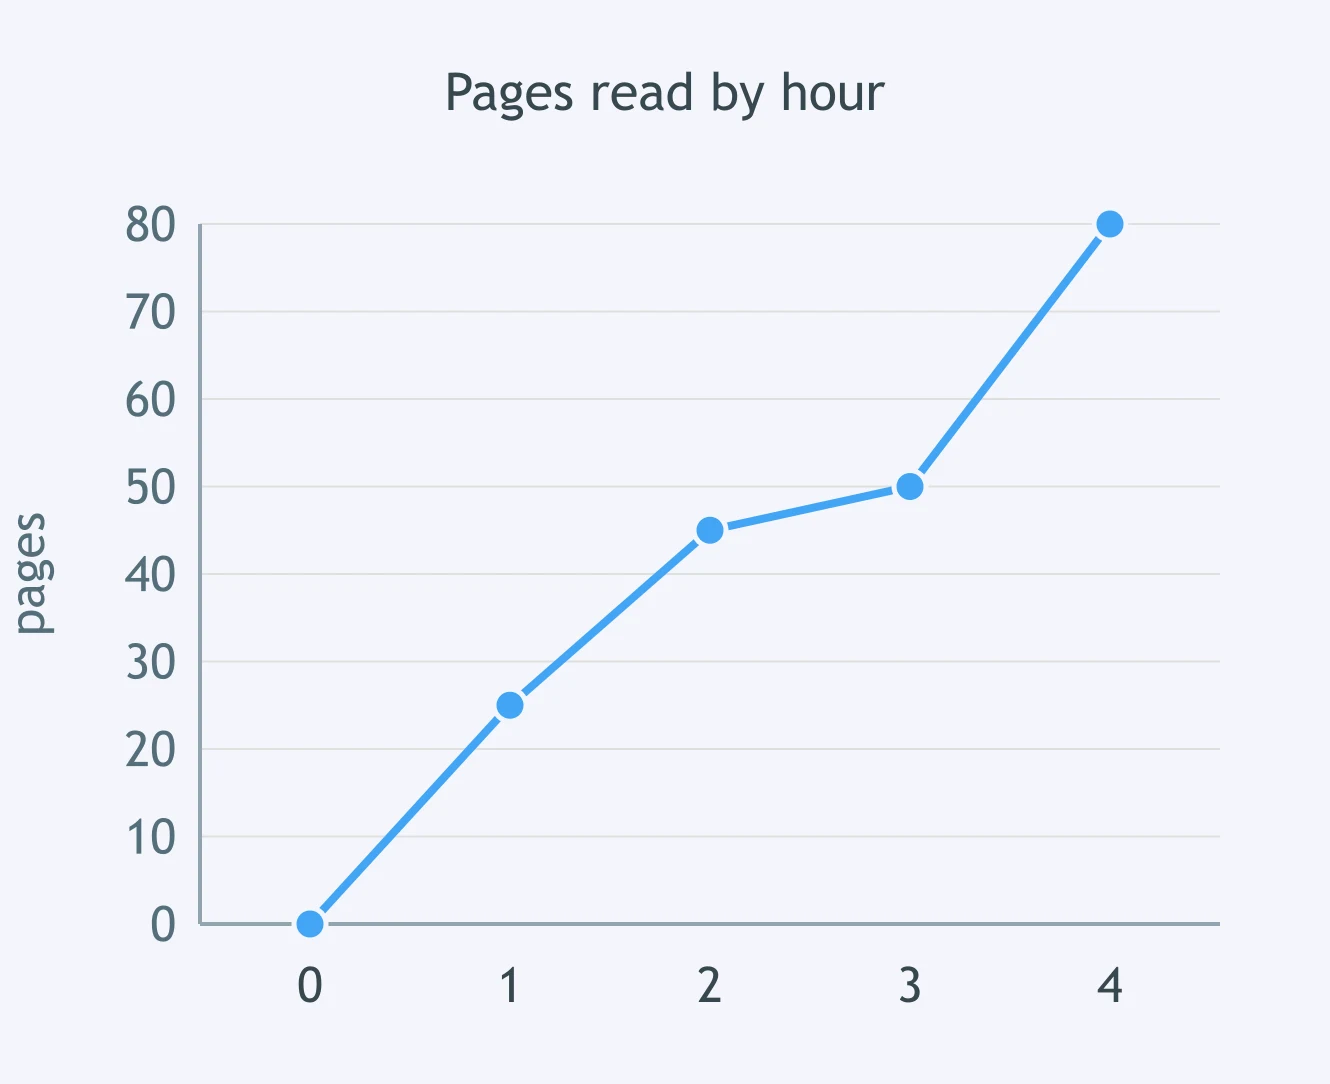
A student graphs the pages read each hour of a study session. Over which one-hour interval does the total rise the most slowly?
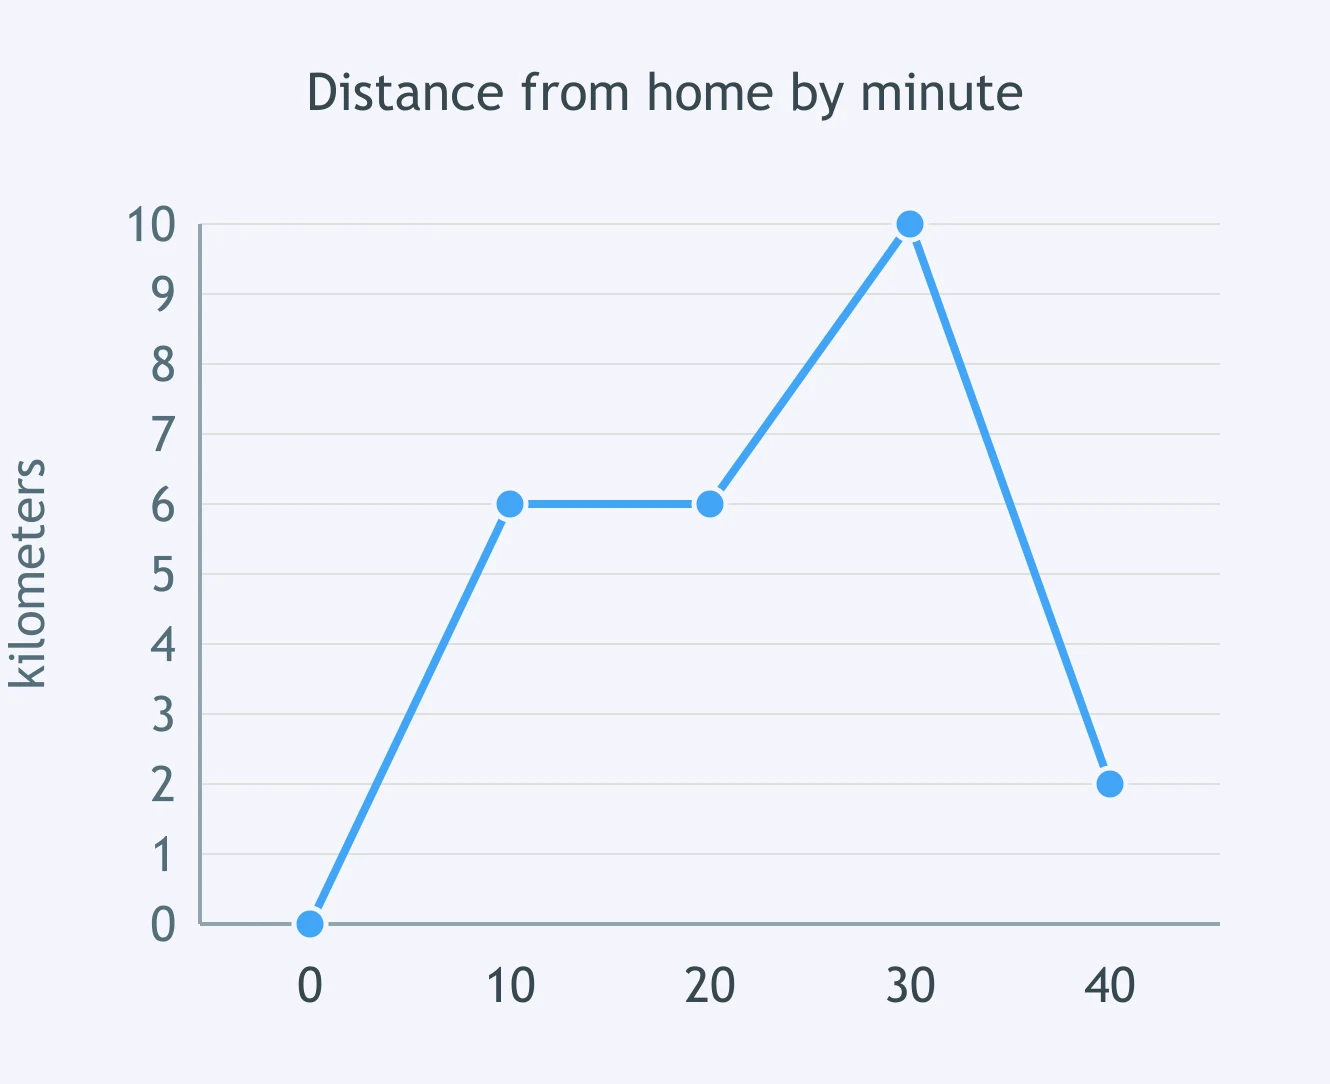
The graph shows a walker's distance from home. Over which interval is the walker heading back toward home?
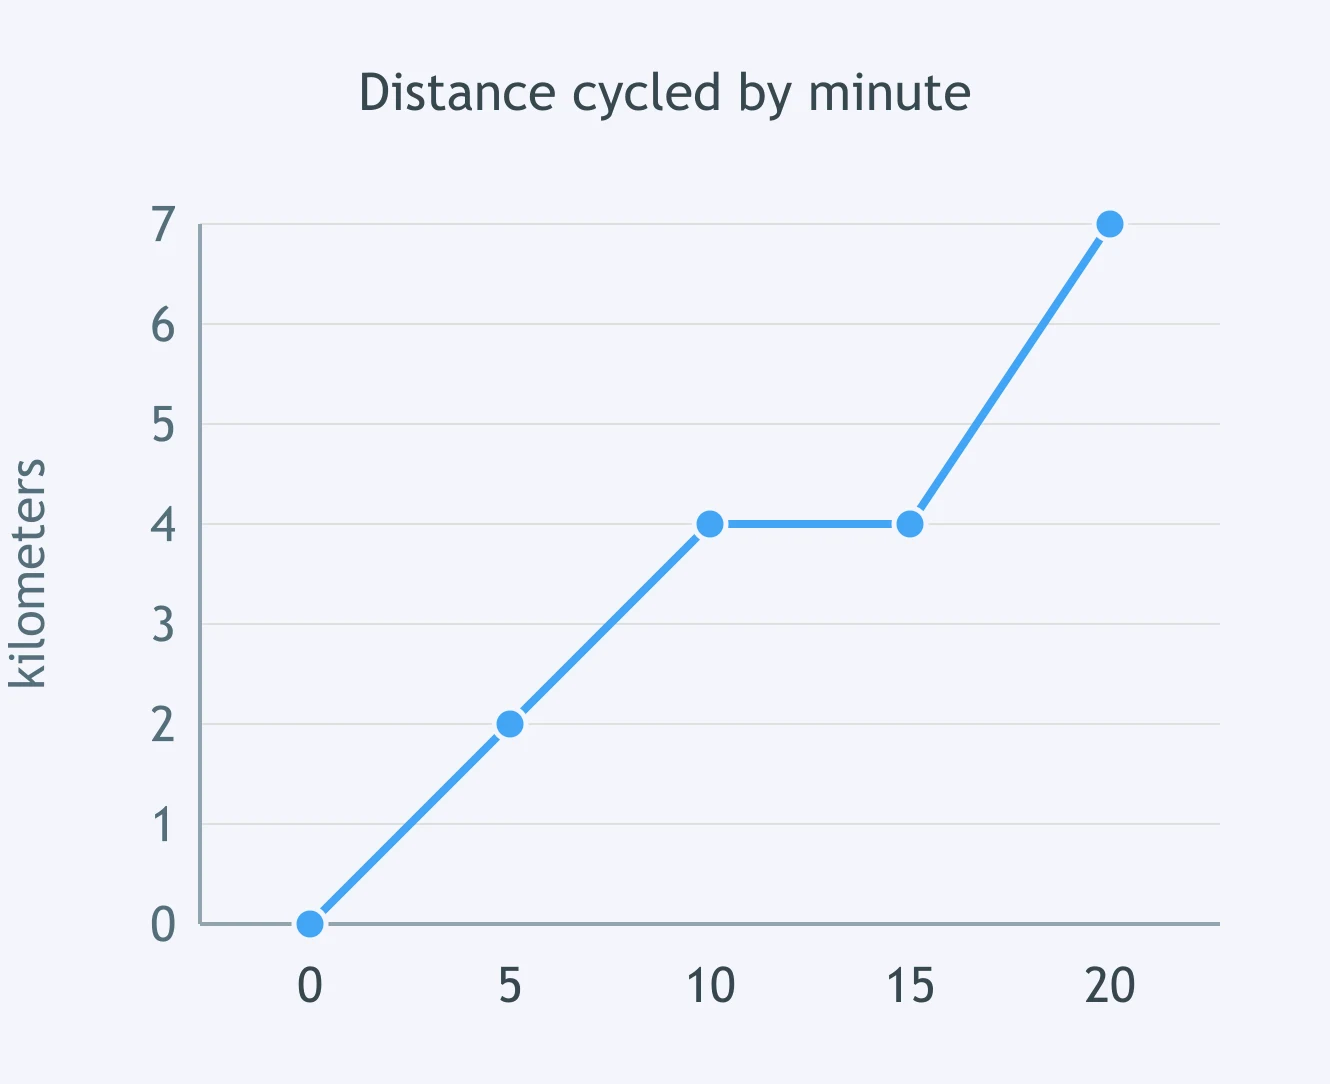
The graph shows how far a cyclist has traveled since setting off. What is happening between minute 10 and minute 15?
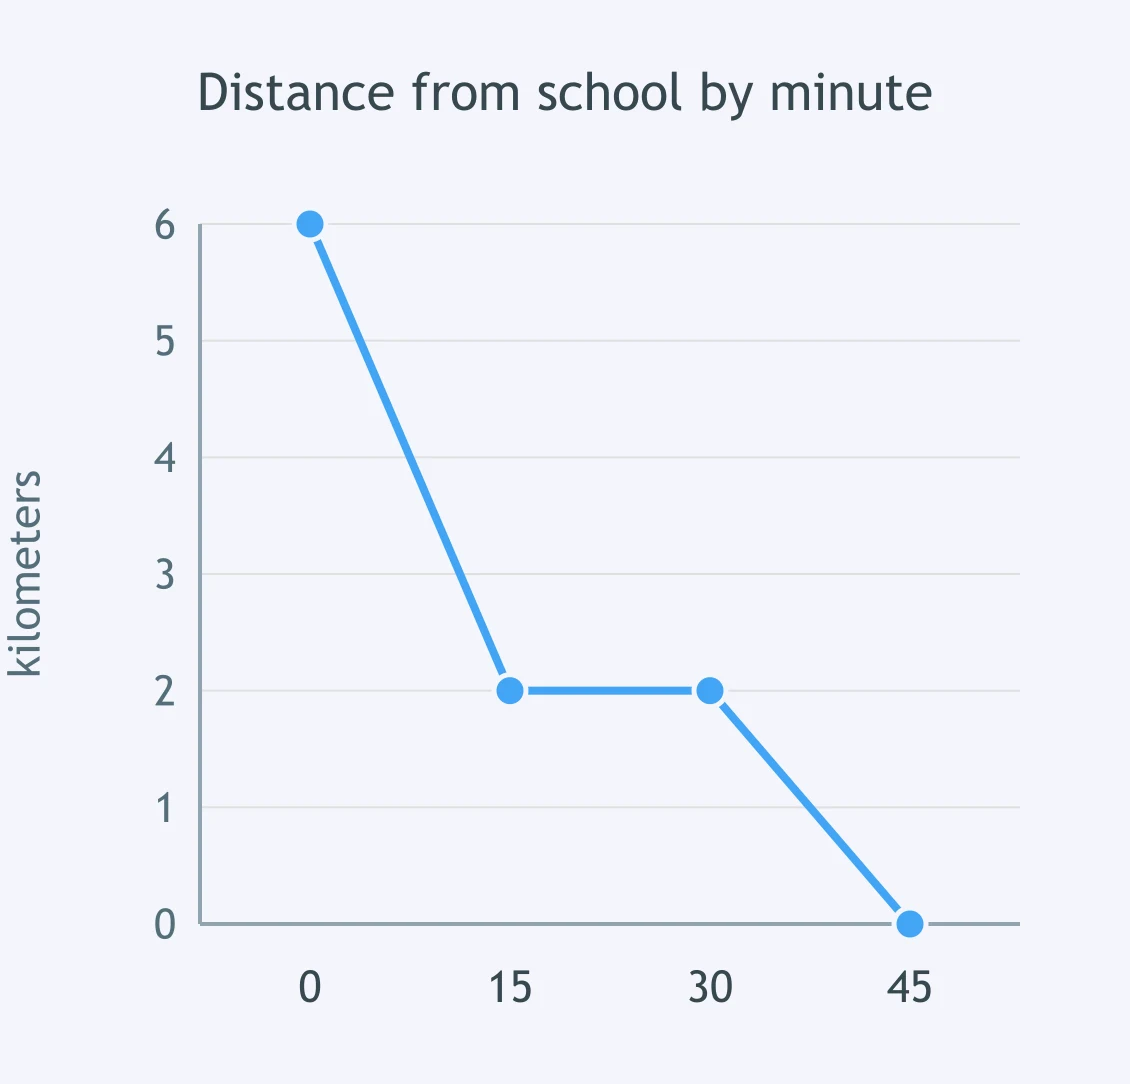
A runner's distance from school is graphed for 45 minutes. What is happening between minute 30 and minute 45?
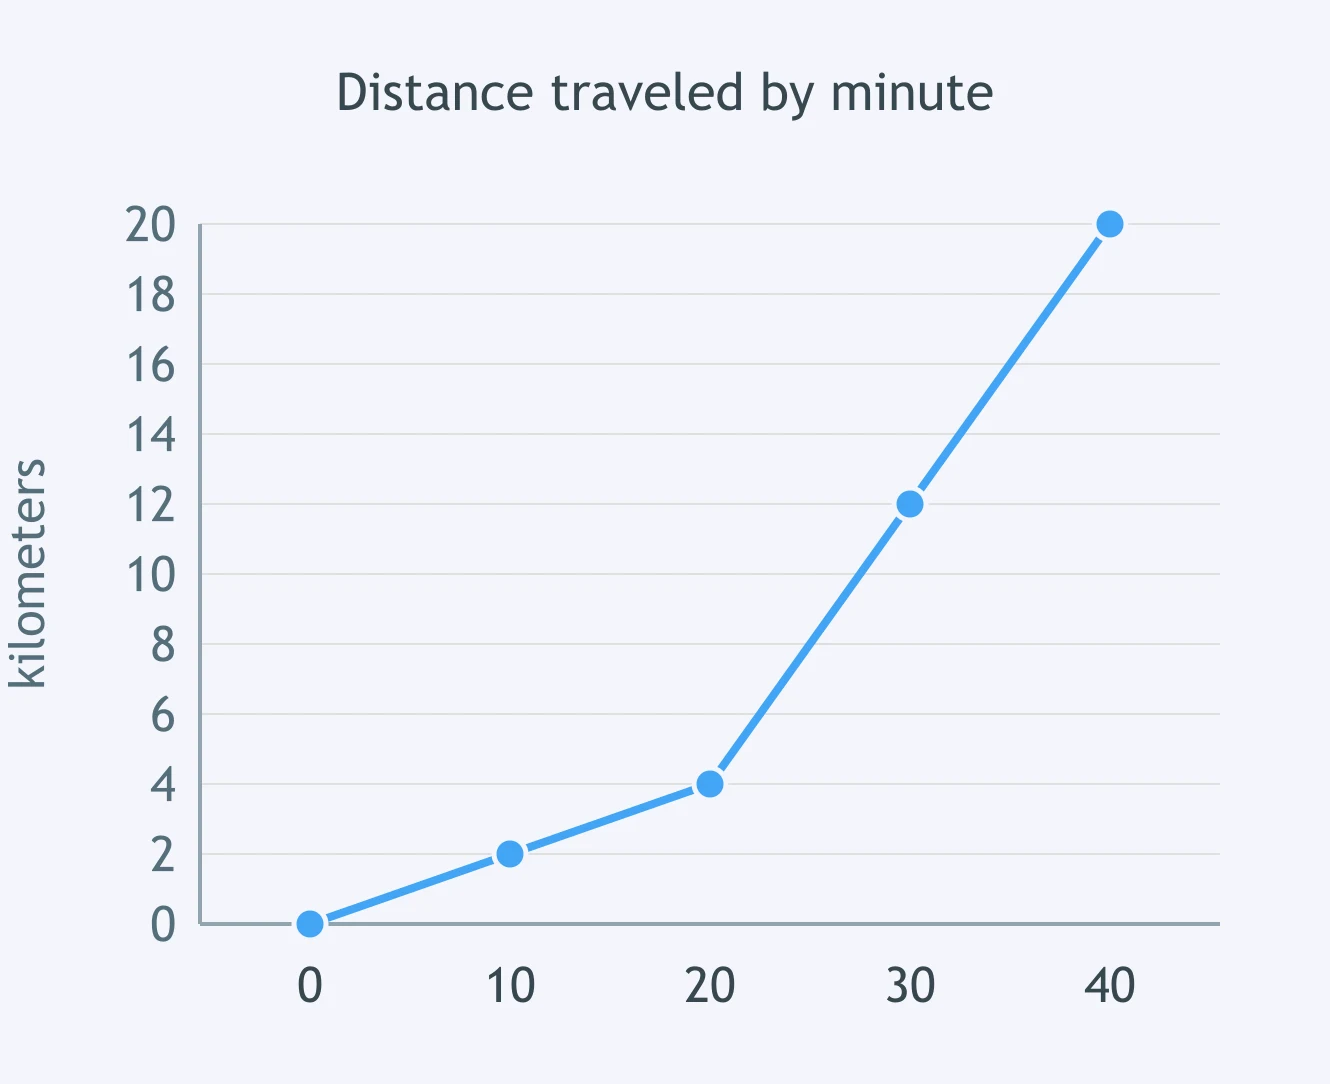
A car's total distance traveled is graphed by minute. What is happening after minute 20?
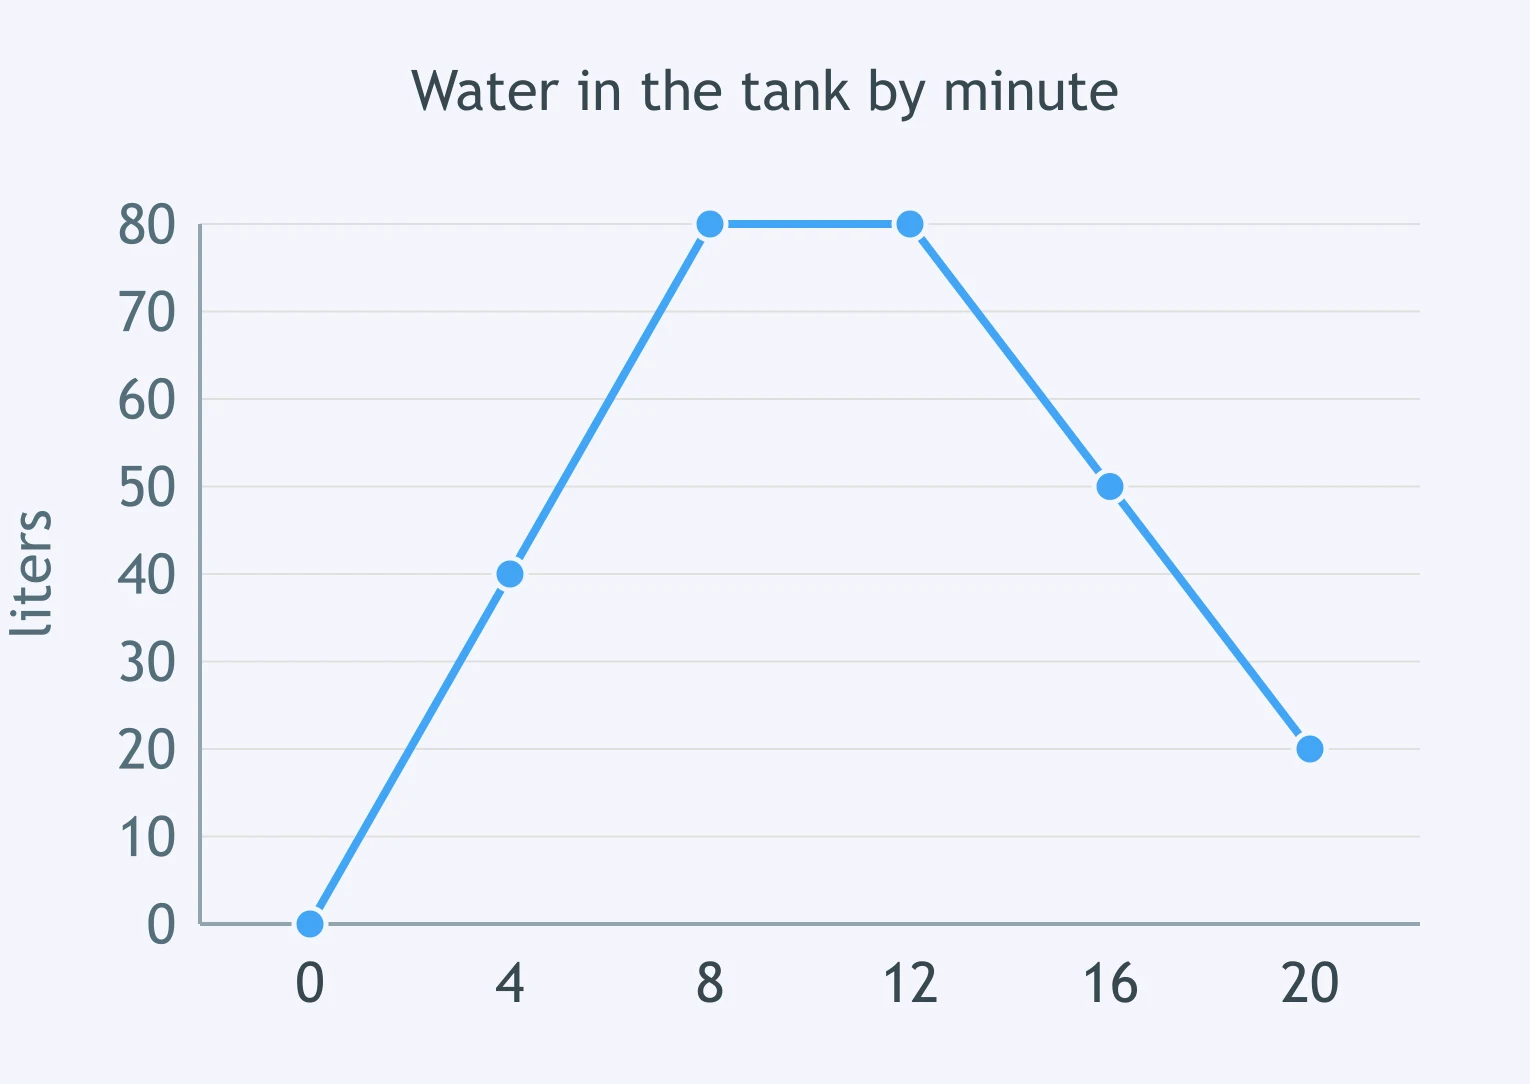
The graph shows the water in a storage tank. What is happening between minute 12 and minute 20?
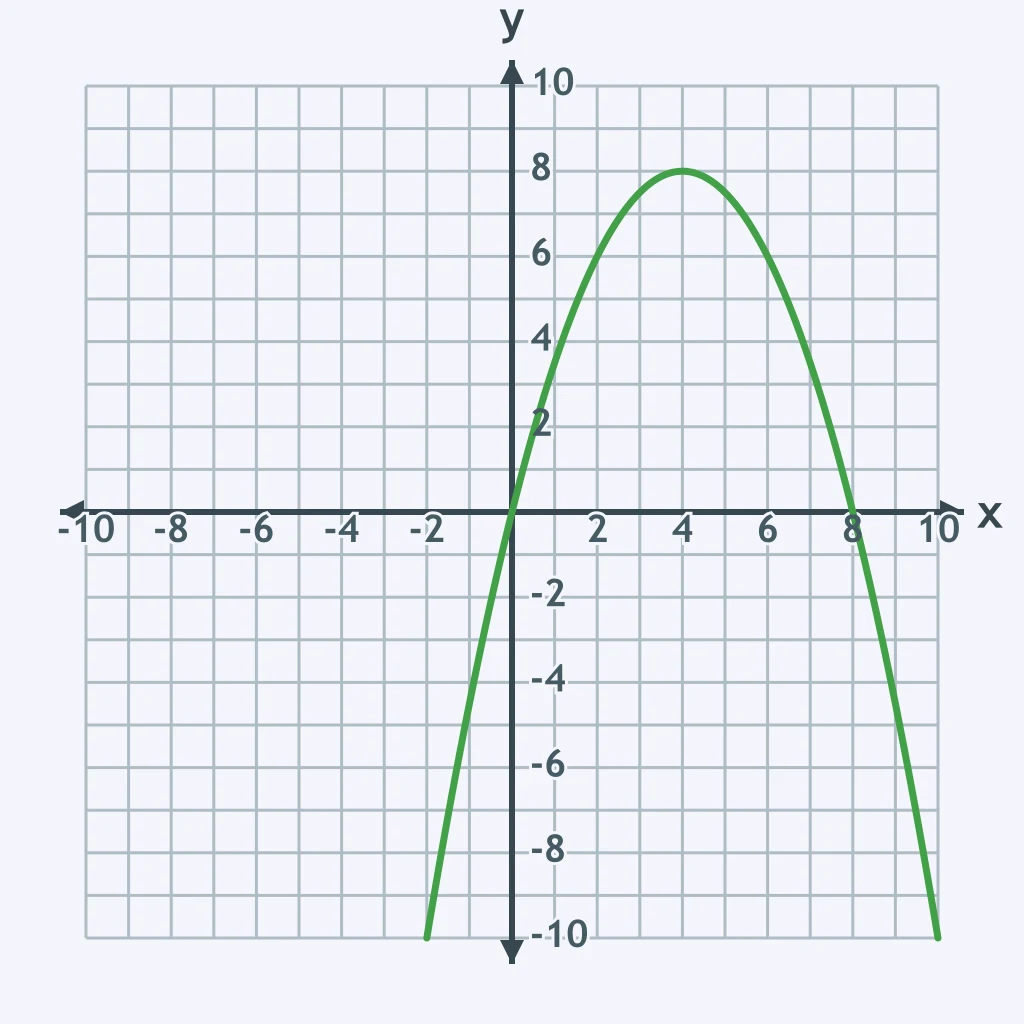
The curve shows a ball's height above the ground as time runs from 0 to 8 seconds. What does the height do across that stretch?
The curve shows a workshop's monthly cost as x runs from 0 to 10. What does the cost do across that stretch?
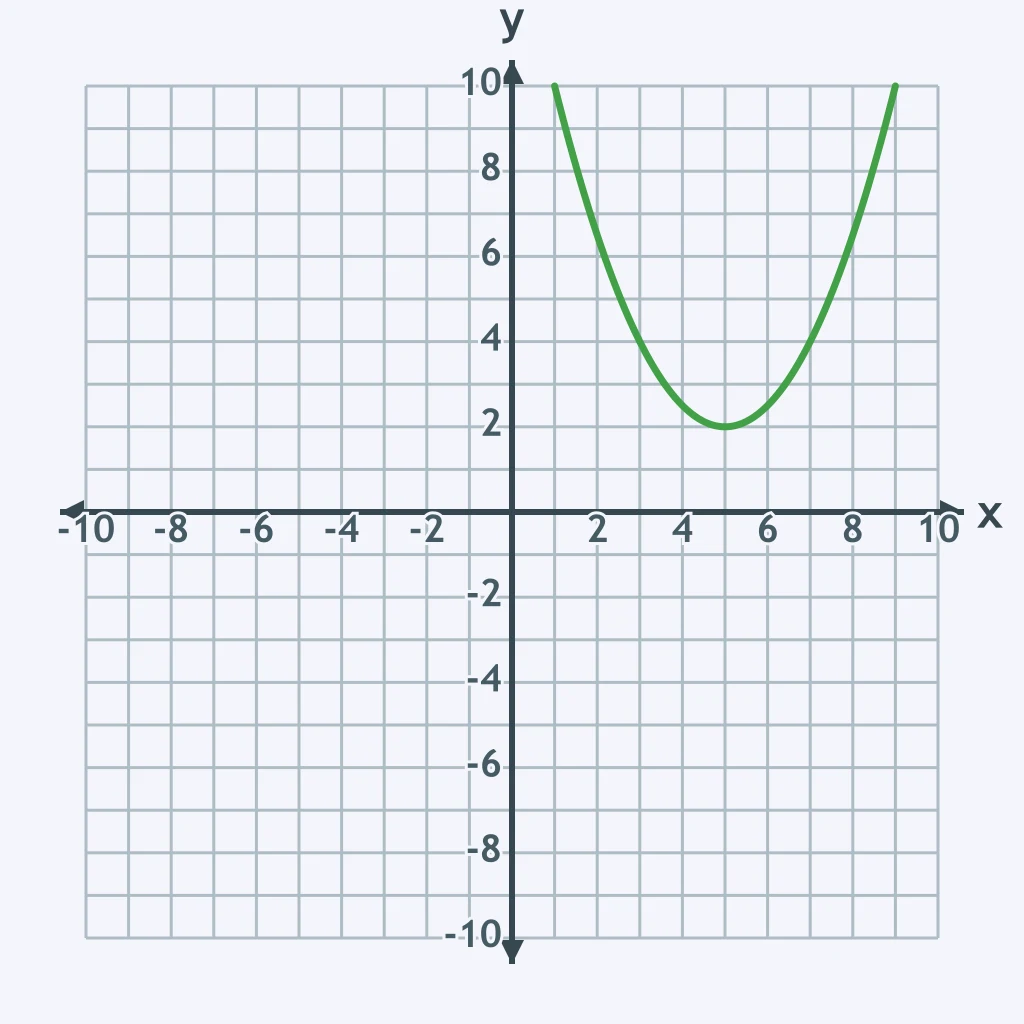
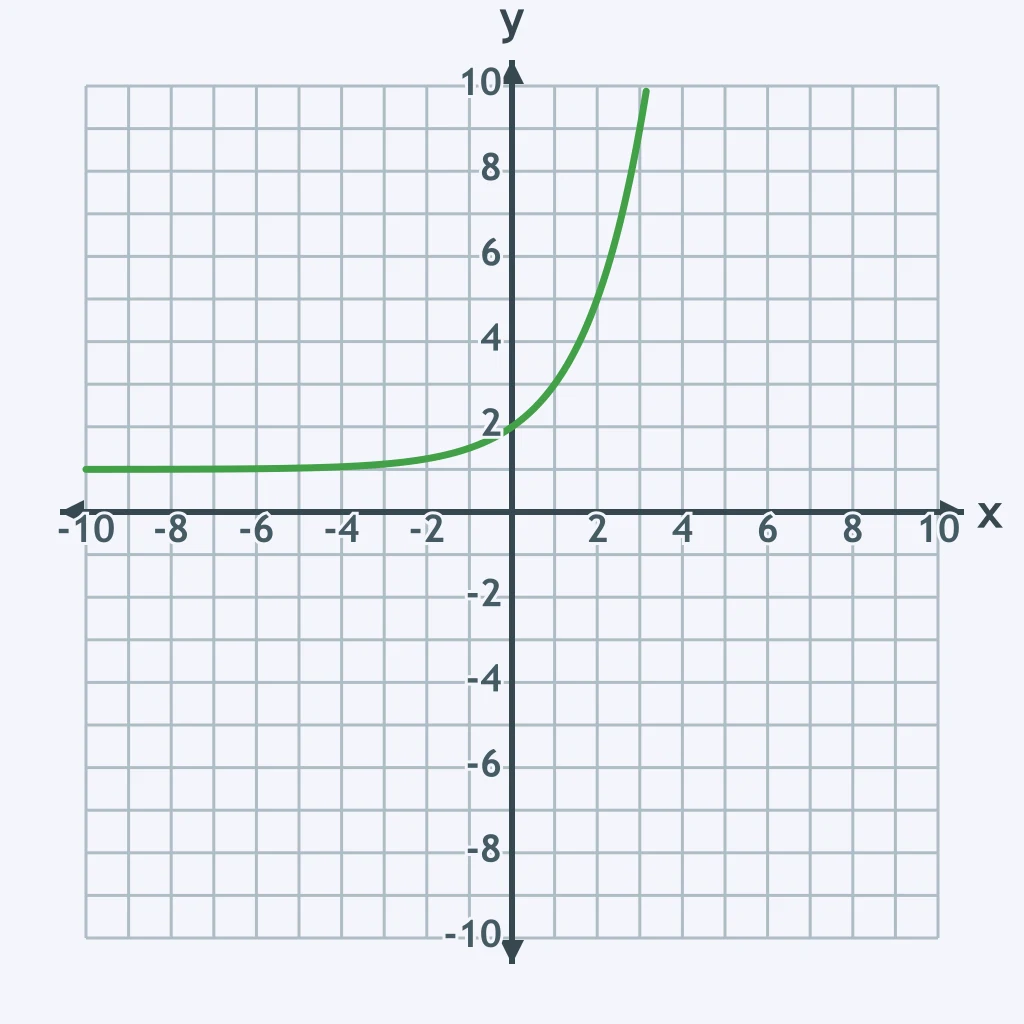
The curve shows the number of bacteria in a dish as x runs from 0 to 3 hours. How does the count change across that stretch?
Crack the passcode before the zombies get in.
Answer, then swat bugs for bonus points.
Race through questions at your own speed.
Same question on every screen. Fastest wins.

Pick a tile, answer, hit bonuses and steals.
Solving a System by Graphing
40 questions