Loading
by BlastRoom
Practice reading and interpreting maps, graphs, charts, and timelines as sources of information about communities.
#inquiry#us_grade_3_social_studies
20 questions
One question set, multiple game modes. Tap any game to see it in action. Not sure which to pick?
Answer to place stones and capture territory.
Outrun the snow together.
Earn blasts, then hunt the other team.
Answer to earn energy, then climb.

The class blasts through walls together.
Bid on mystery lots. Most money wins.
Sell tours. Nice, standard, or a total scam.

Answer, restock, and serve the rush.
More correct answers pulls the rope your way.
Answer, then shoot down the alien wave.
Answer, then tap to leap the frozen ridge.
What part of a map tells you what each symbol means?

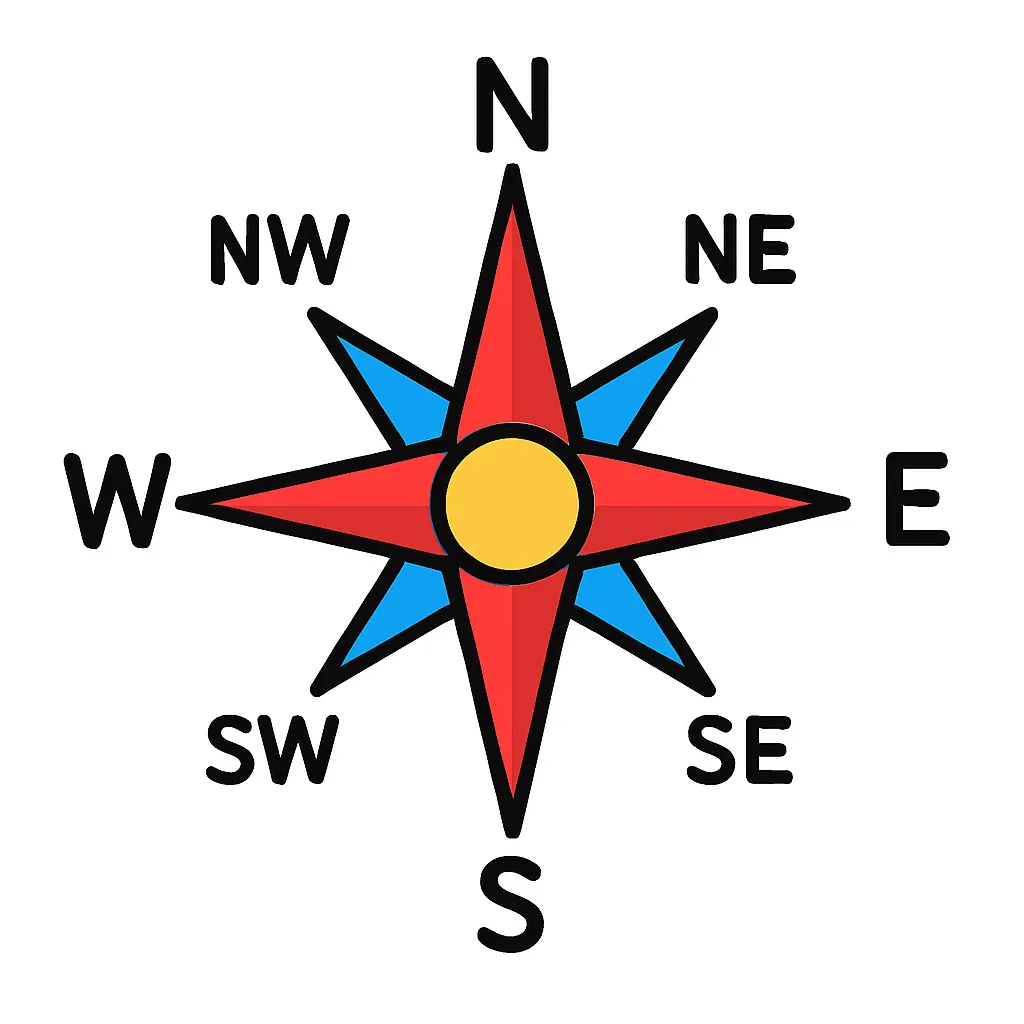
What does a compass rose on a map show?
A timeline shows events in the order they happened. Is this true or false?
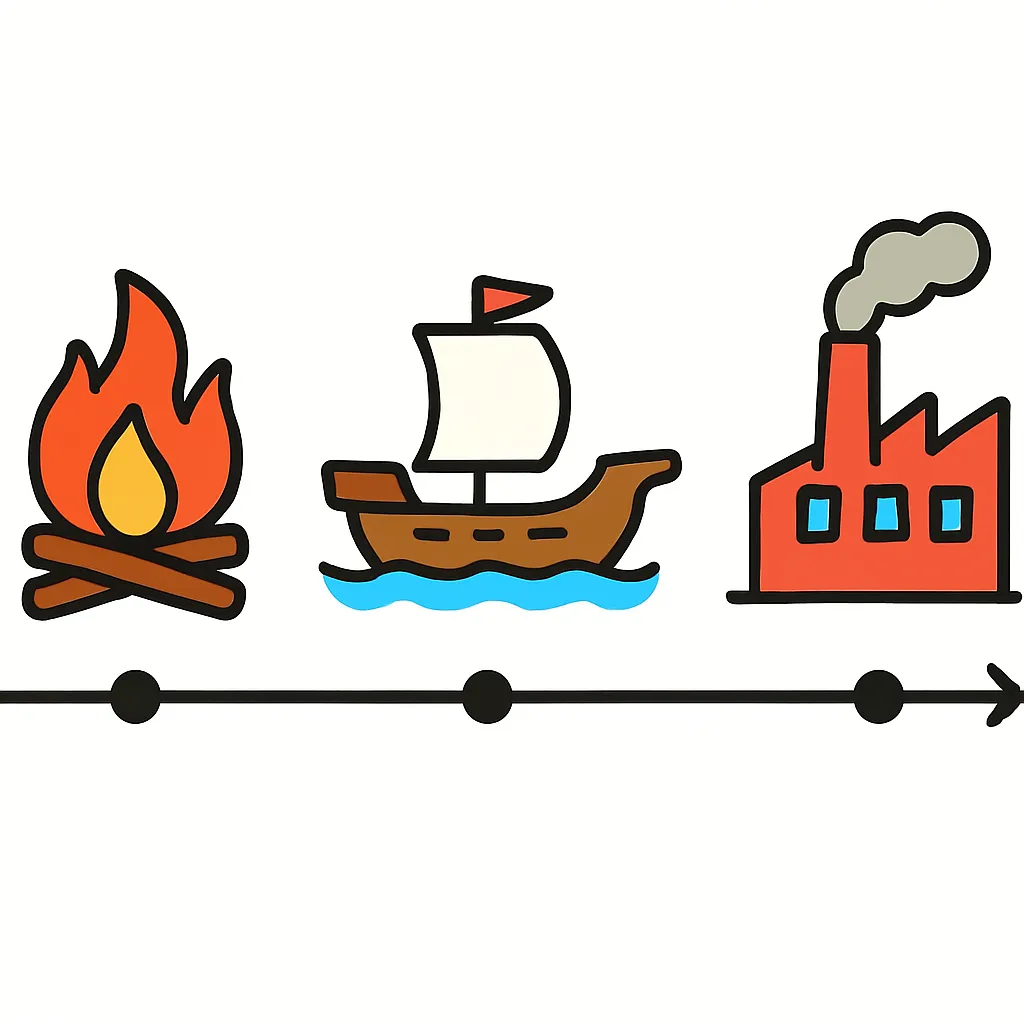
On a map, which direction is usually shown at the top?

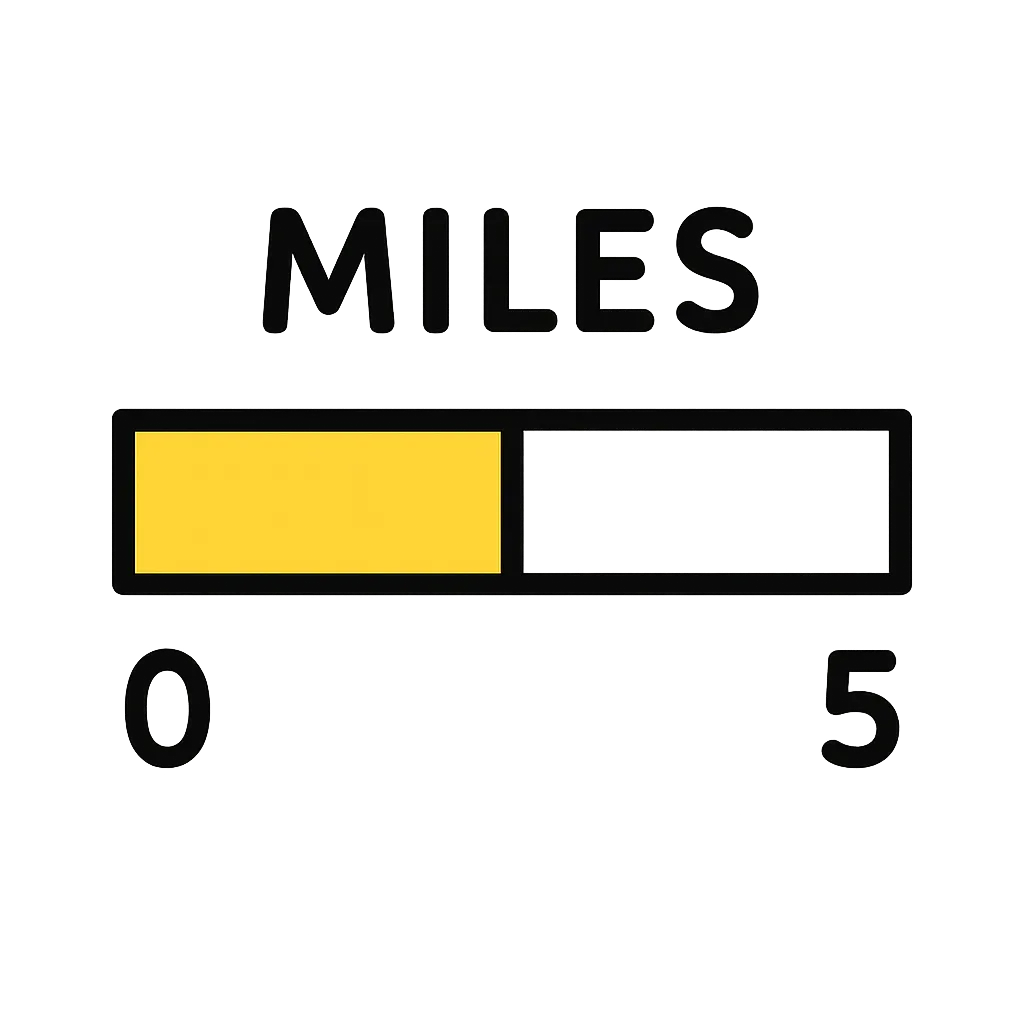
What does the scale on a map help you find out?
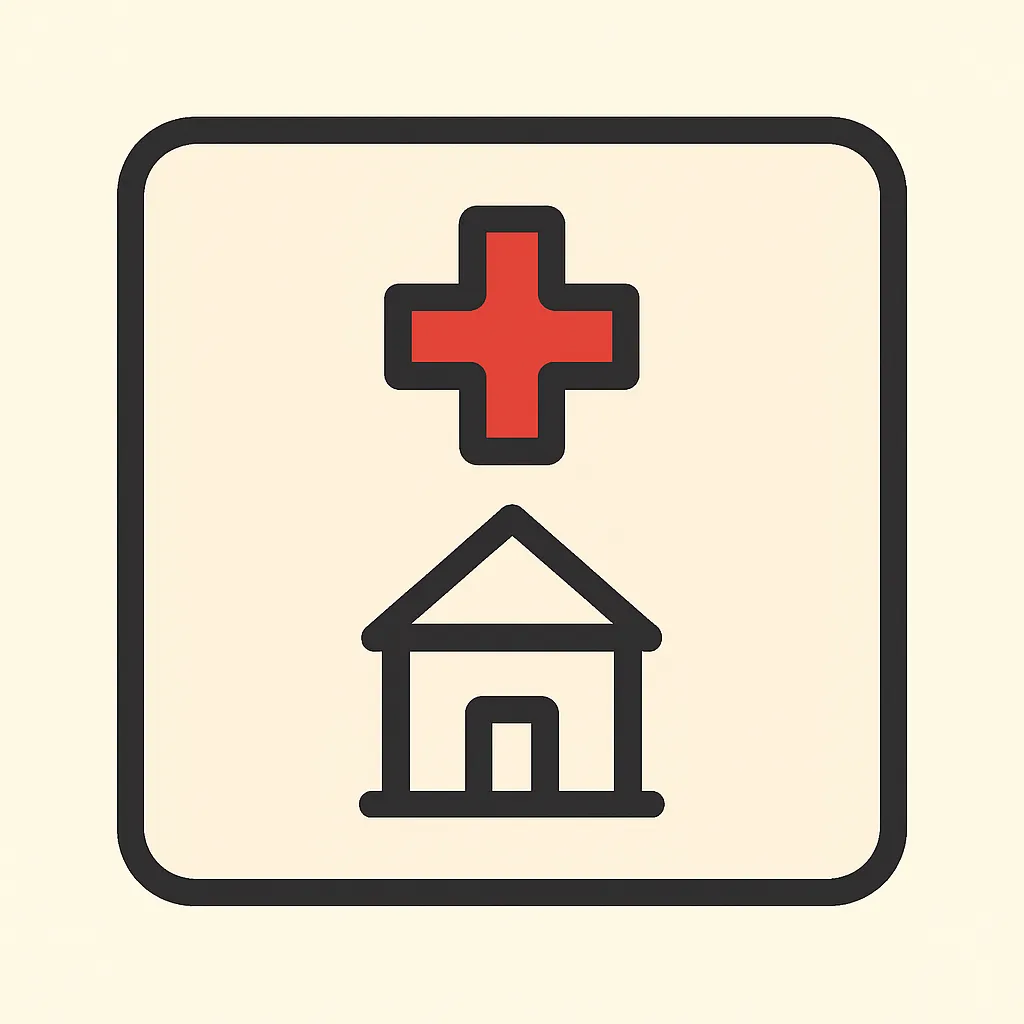
A map's key shows a small red cross next to a picture of a building. What does that symbol most likely show on the map?
A bar graph shows how a class gets to school: bus 12, walk 8, bike 5, car 3. How many more children take the bus than walk?
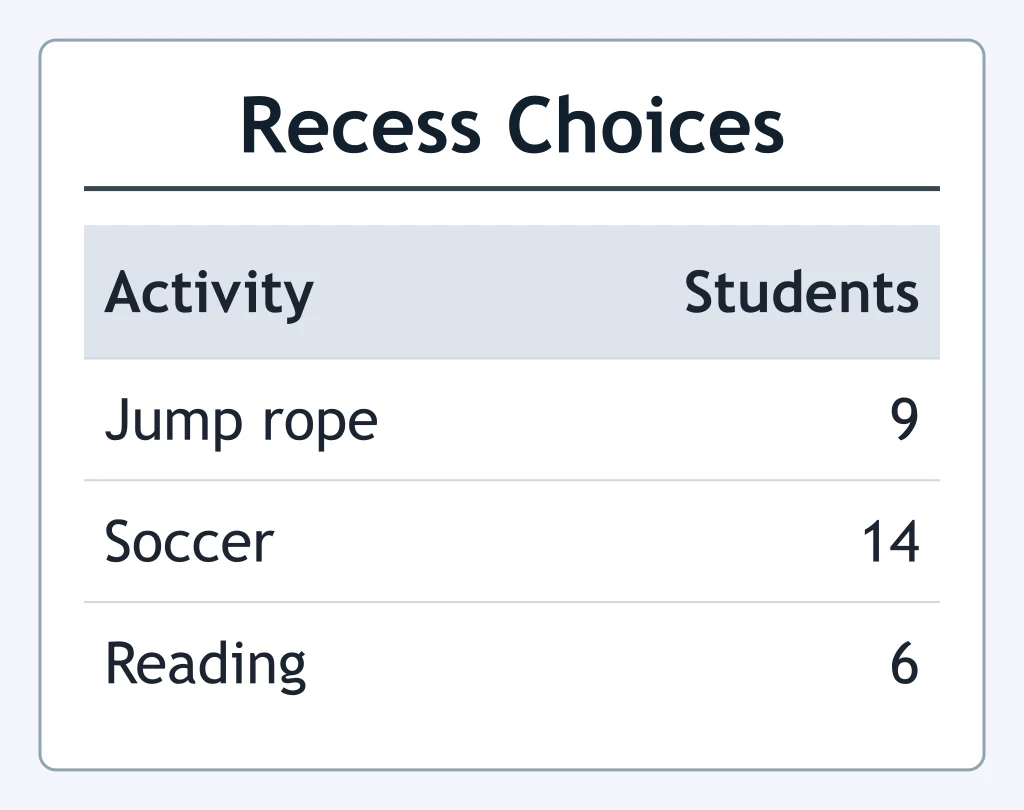
Look at the chart. Which recess activity did the most students choose?
A timeline of a town park shows: 1975, the park opened; 1990, a playground was added; 2004, a pond was dug; 2018, a walking path was built. The pond was dug in which year on this timeline?
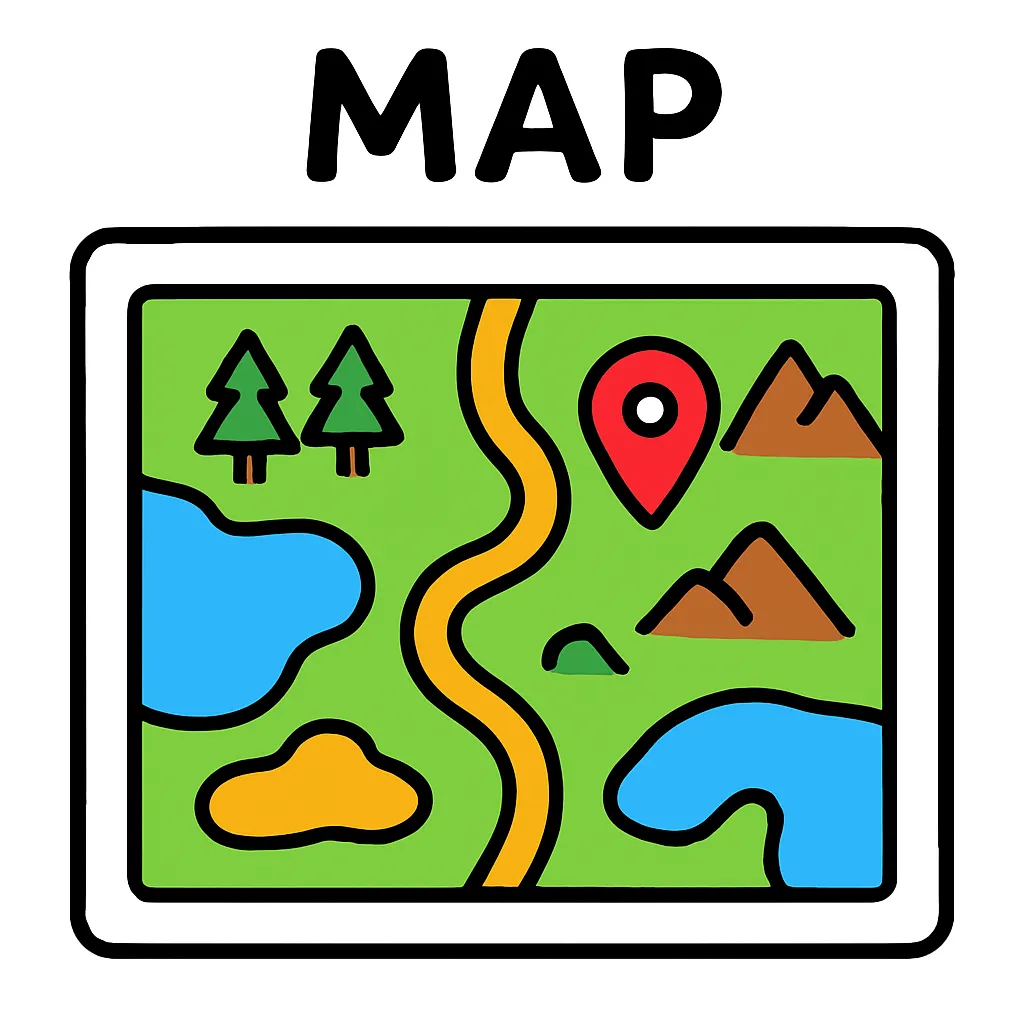
What does the title of a map usually tell you?
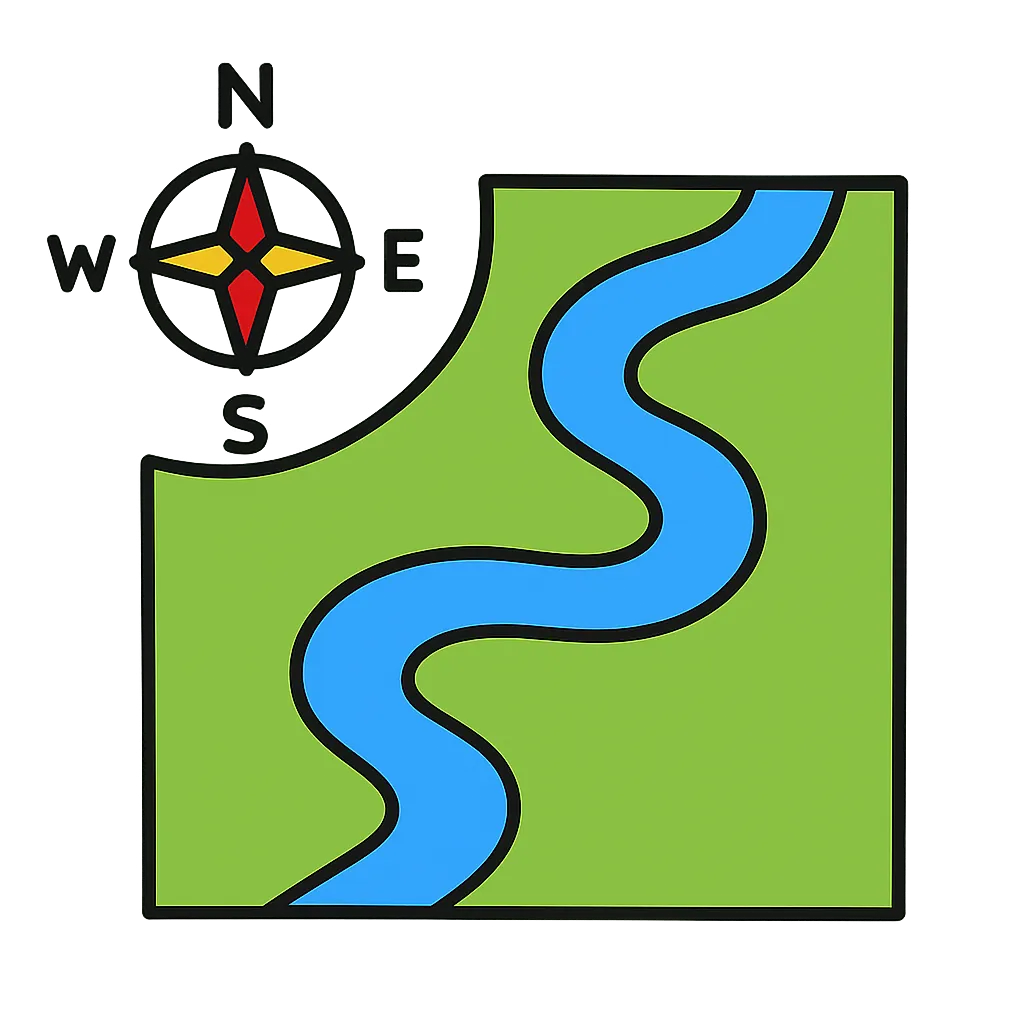
You want to find out if a river flows north or south on a map. Which map tool helps most?
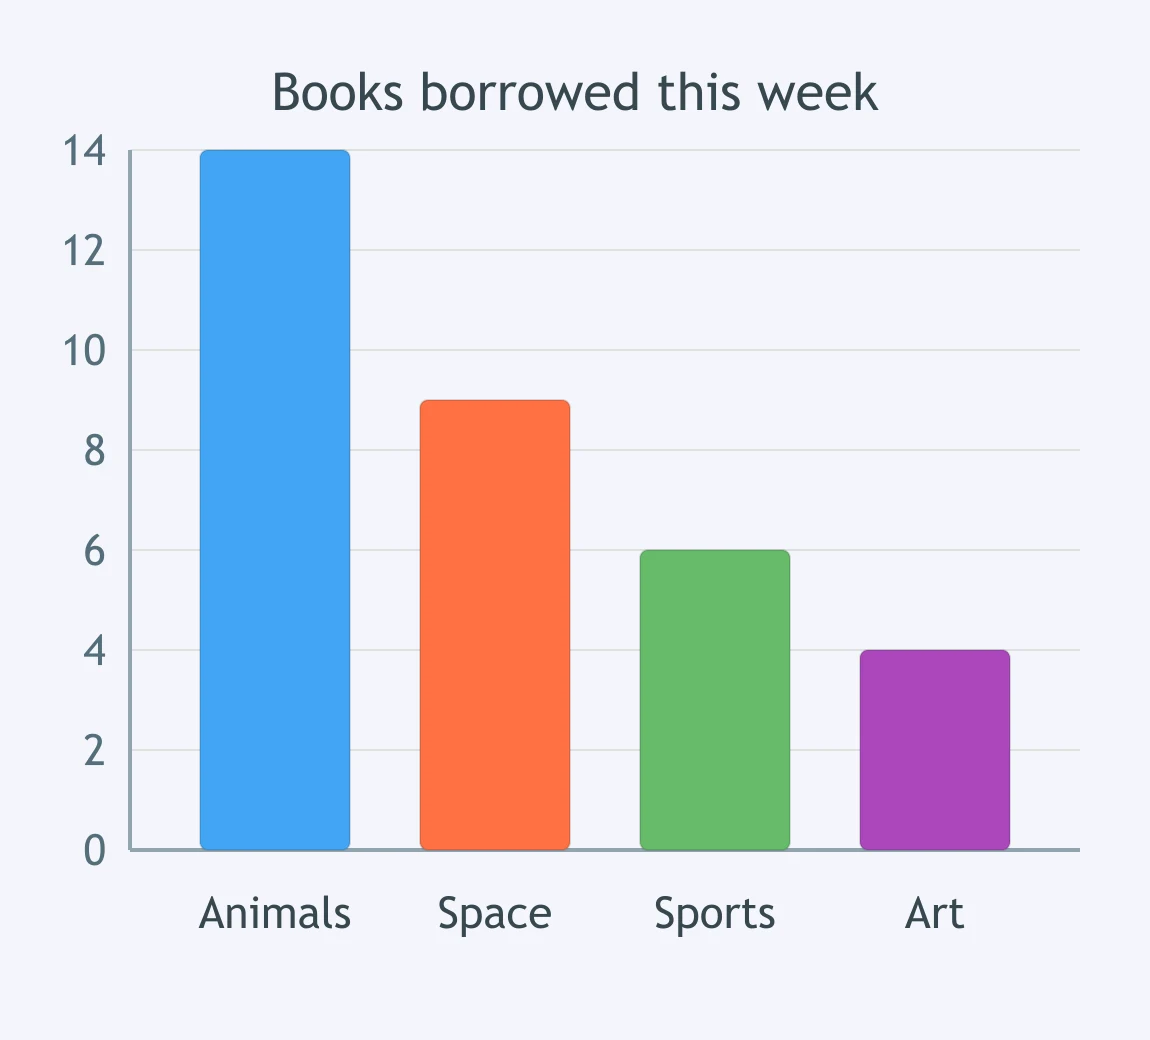
Look at the bar graph. Which topic had the fewest books borrowed this week?
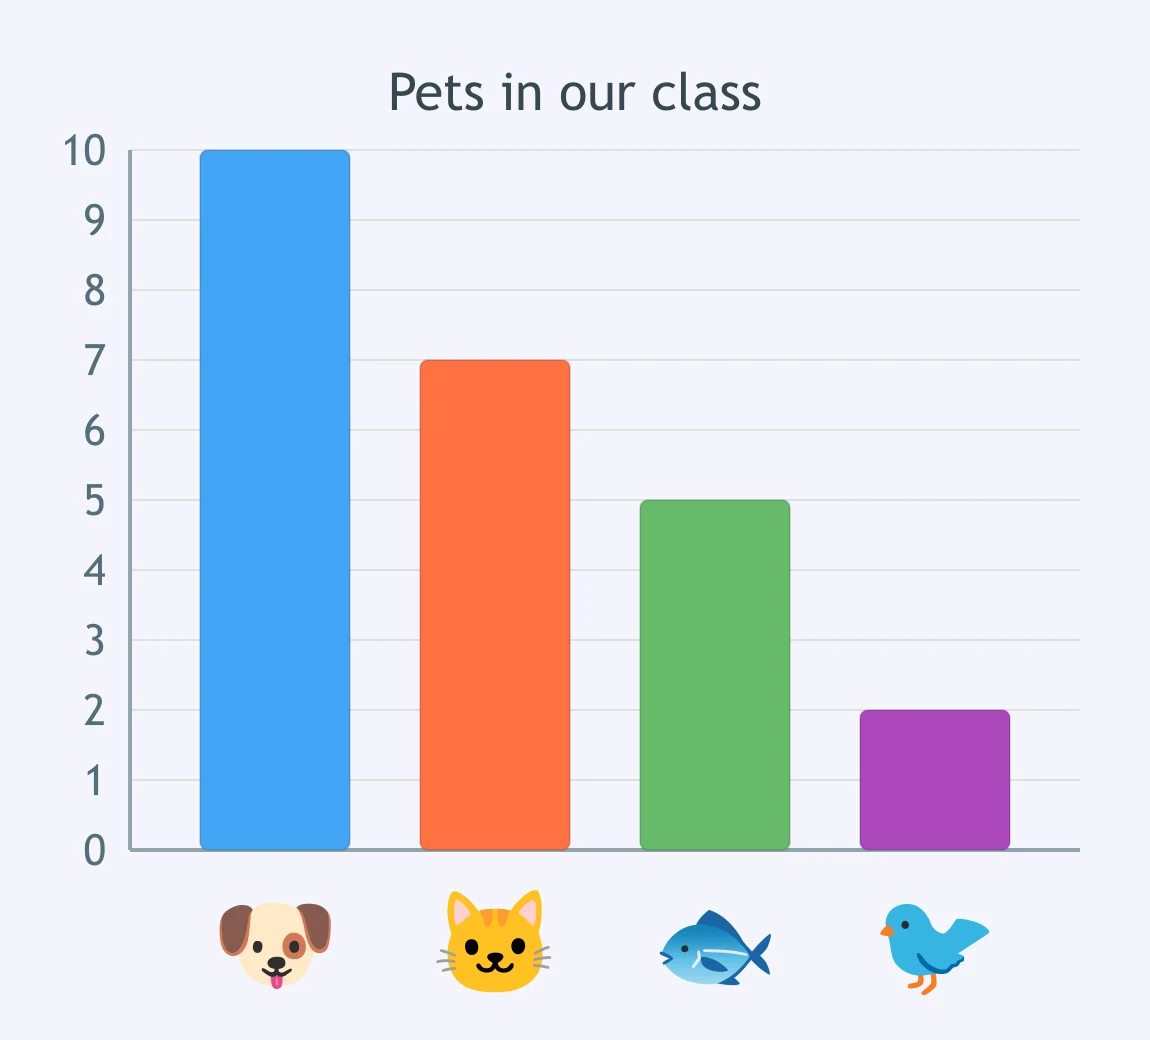
Look at the bar graph. How many children in the class have a fish?
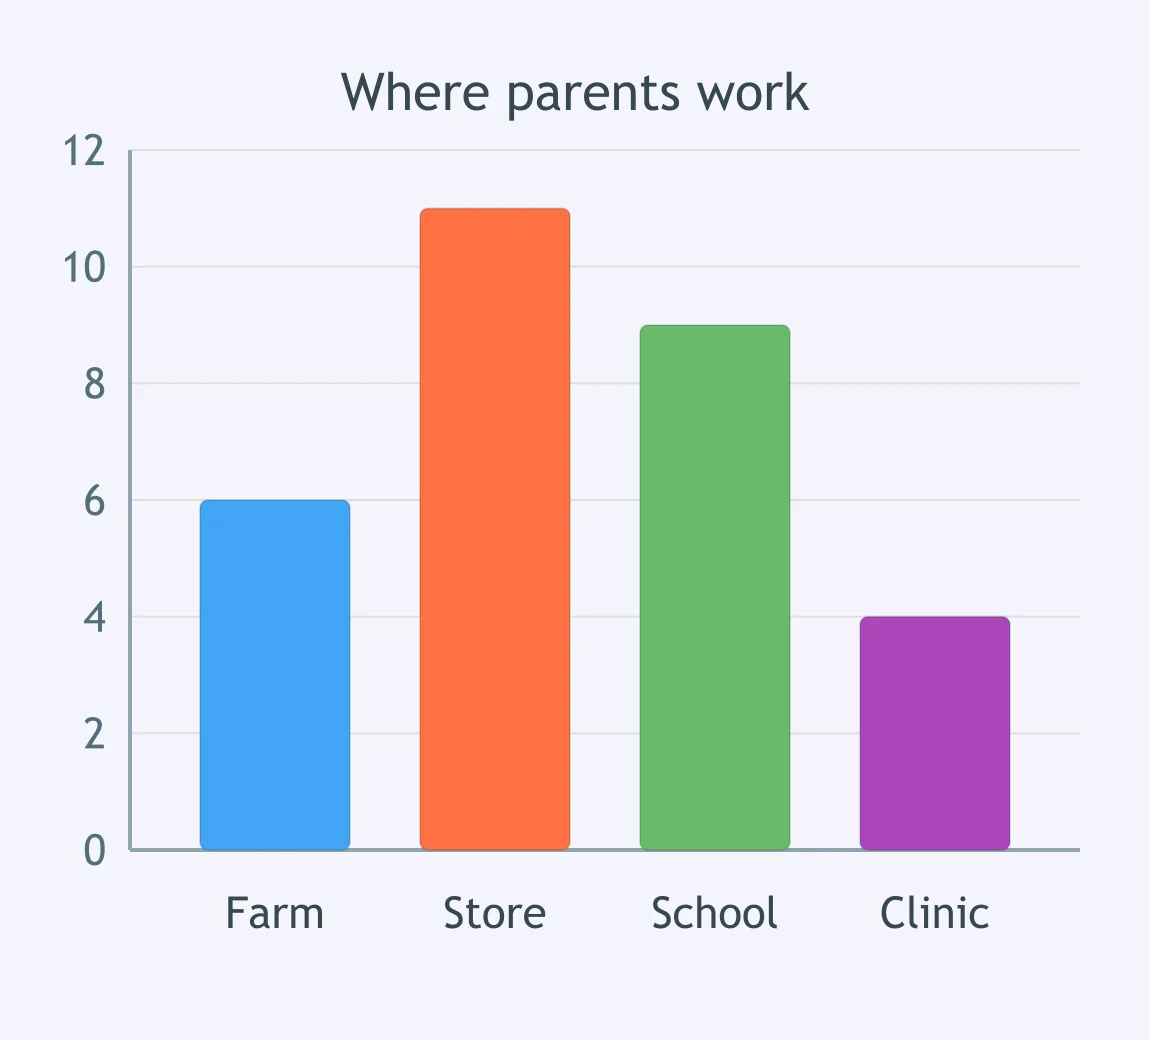
Look at the bar graph. How many more parents work at the store than at the school?
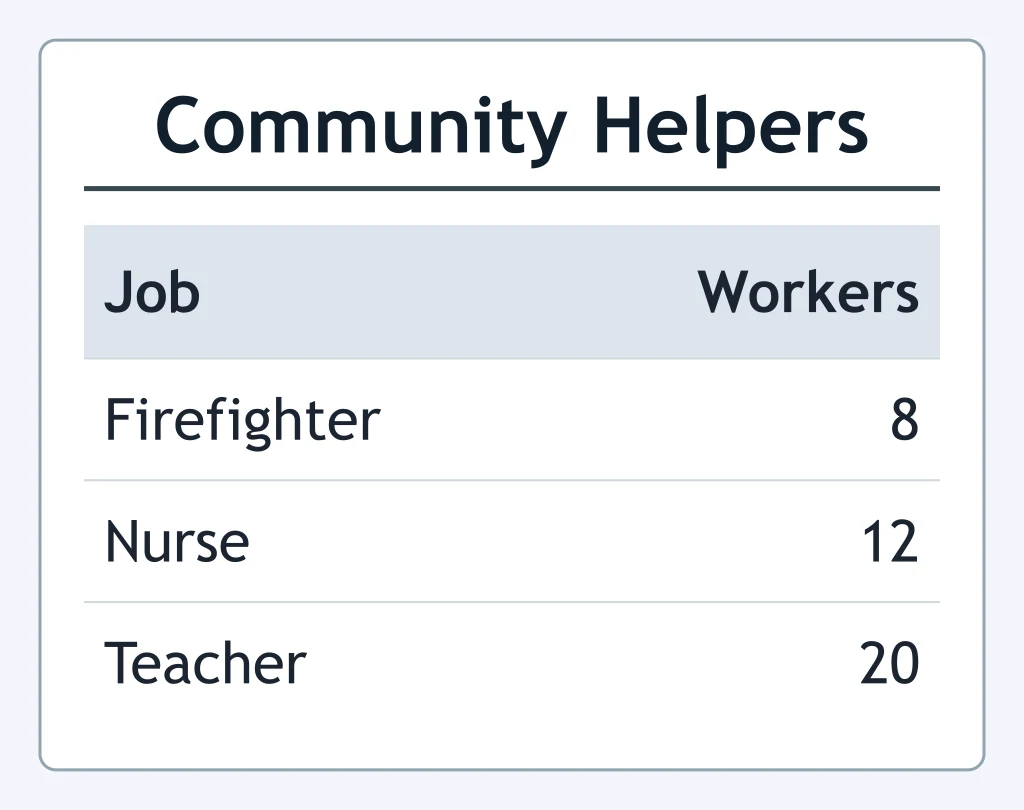
Look at the chart. Which community job has the smallest number of workers?
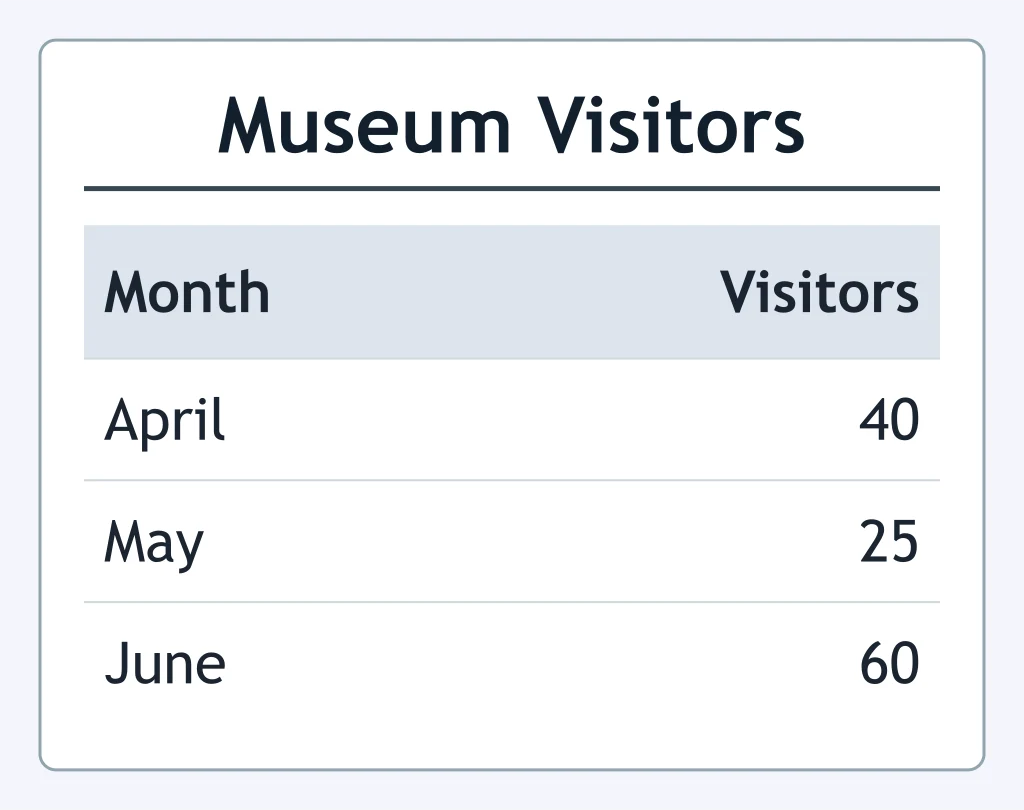
Look at the chart. How many more people visited the museum in June than in May?
Mrs. Lee wants to compare how many children chose each lunch. What is the best tool to show that?
What do the numbers along the side of a bar graph tell you?
A chart lists information in rows and columns. Is this true or false?
On a bar graph, the tallest bar stands for the smallest number. Is this true or false?
Crack the passcode before the zombies get in.
Answer, then swat bugs for bonus points.
Race through questions at your own speed.
Same question on every screen. Fastest wins.

Pick a tile, answer, hit bonuses and steals.
Fact or Opinion?
40 questions