Loading
by BlastRoom
Read production possibilities curves for efficiency, scarcity, opportunity cost, and growth.
#us_hs_economics

20 questions
One question set, multiple game modes. Tap any game to see it in action. Not sure which to pick?
Answer to place stones and capture territory.
Outrun the snow together.
Earn blasts, then hunt the other team.
Answer to earn energy, then climb.

The class blasts through walls together.
Bid on mystery lots. Most money wins.
Sell tours. Nice, standard, or a total scam.

Answer, restock, and serve the rush.
More correct answers pulls the rope your way.
Answer, then shoot down the alien wave.
Answer, then tap to leap the frozen ridge.
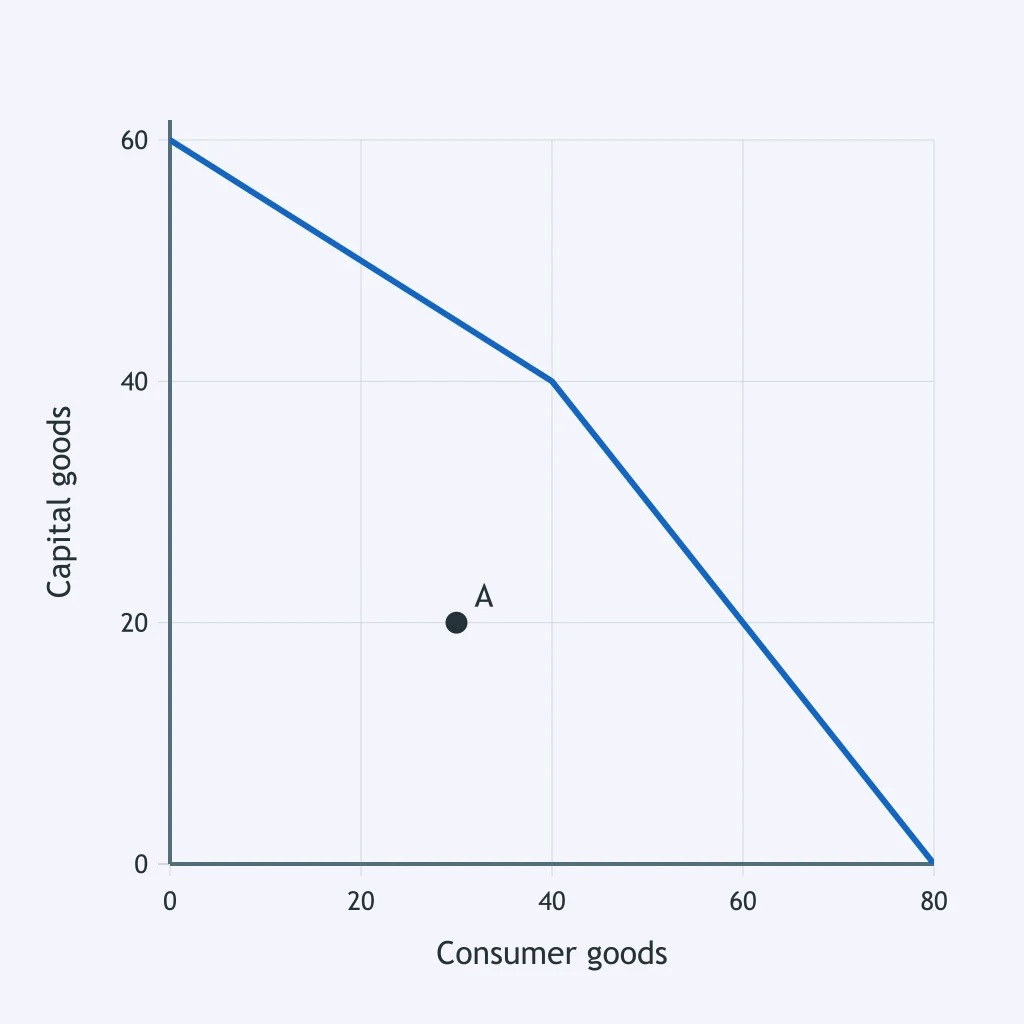
Use the PPC. How should point A be classified?
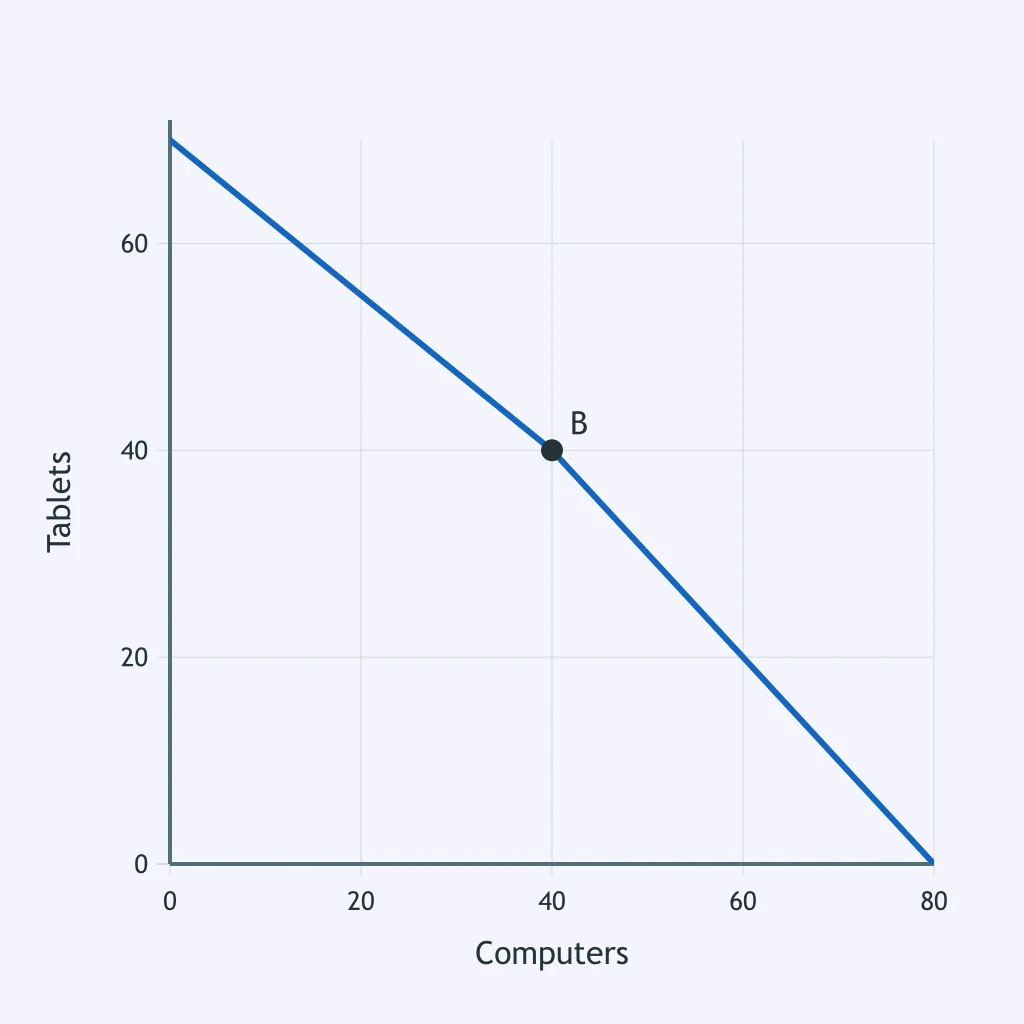
Use the PPC. How should point B be classified?
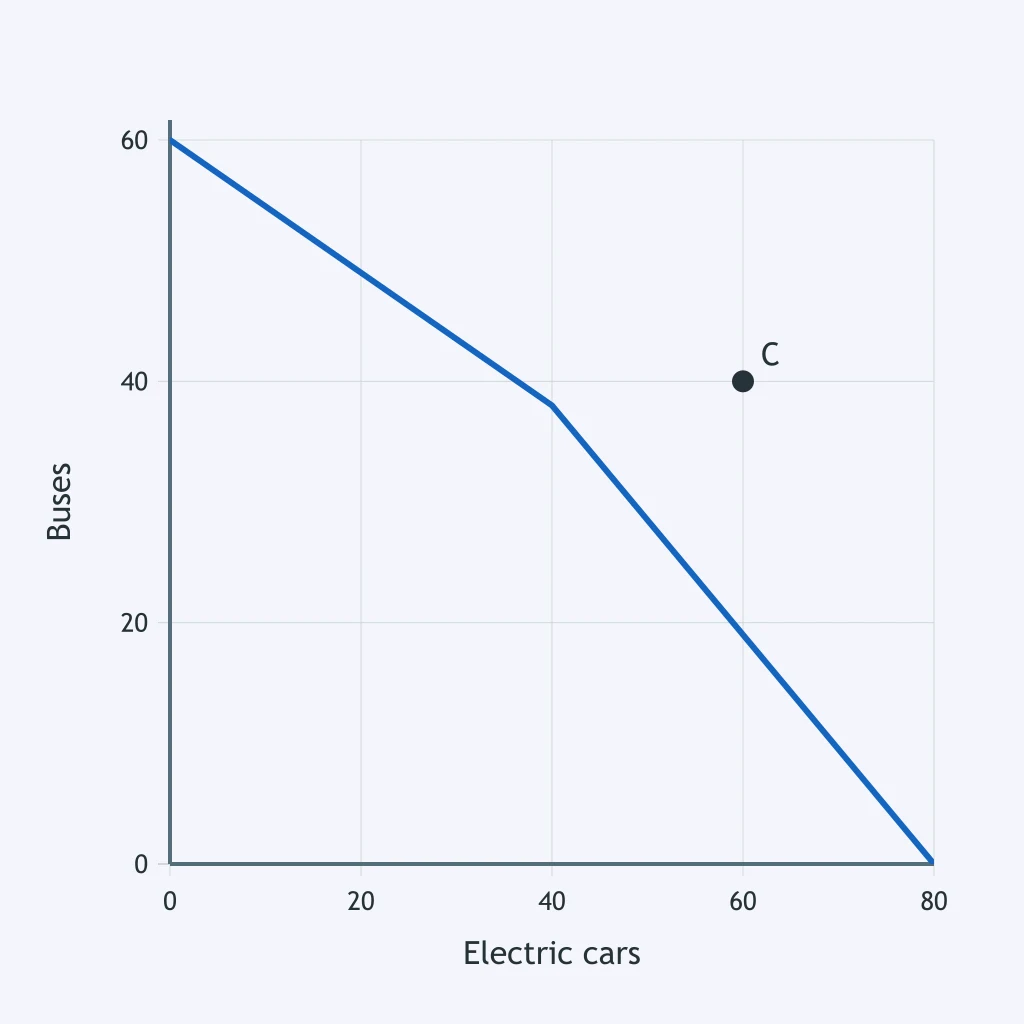
Use the PPC. How should point C be classified?
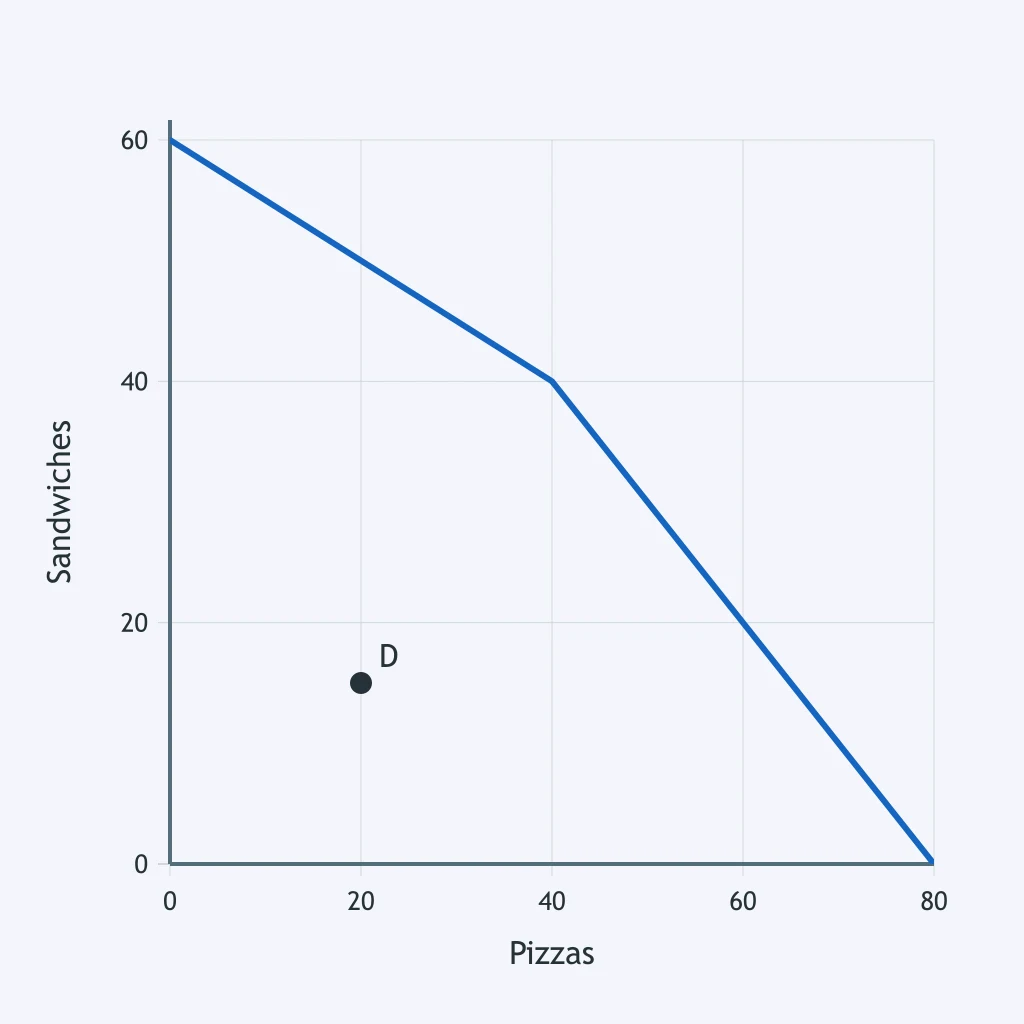
Use the PPC. What does point D show?
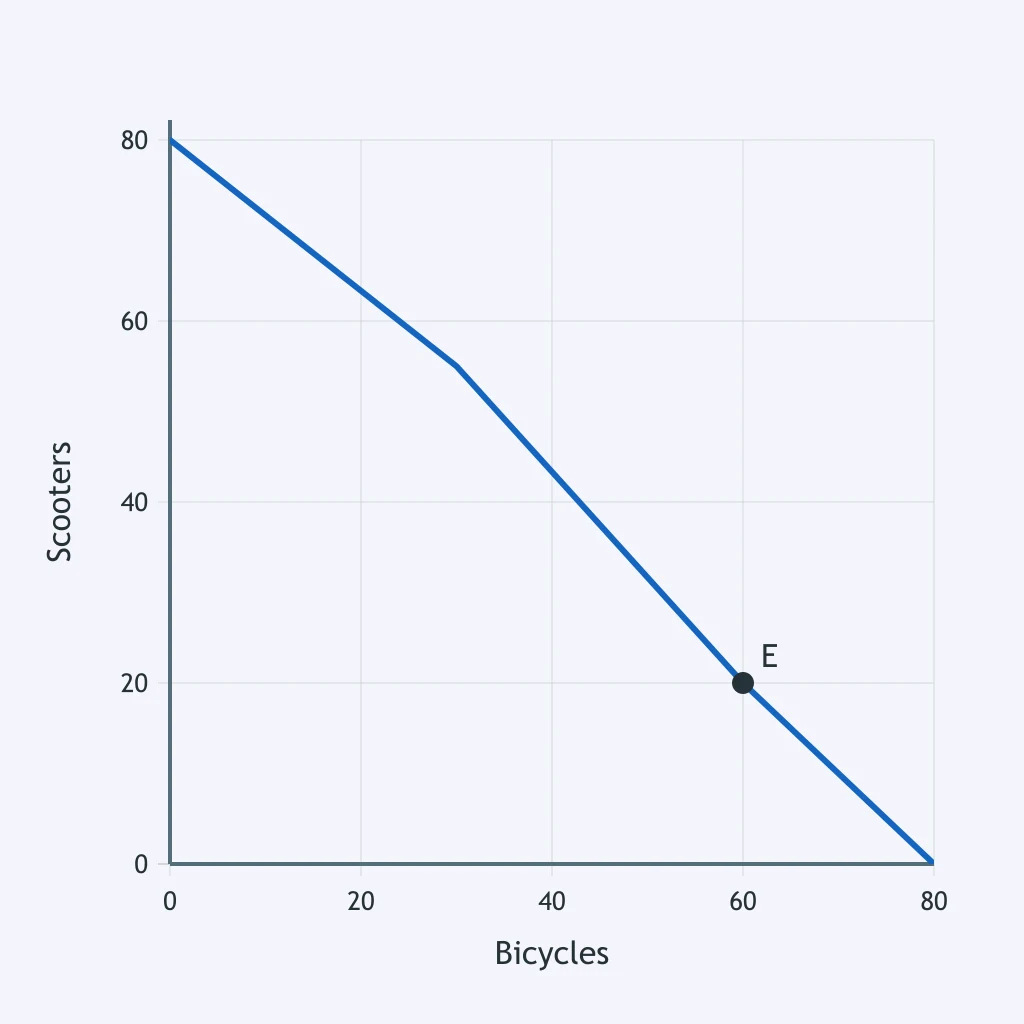
Use the PPC. What does point E indicate?
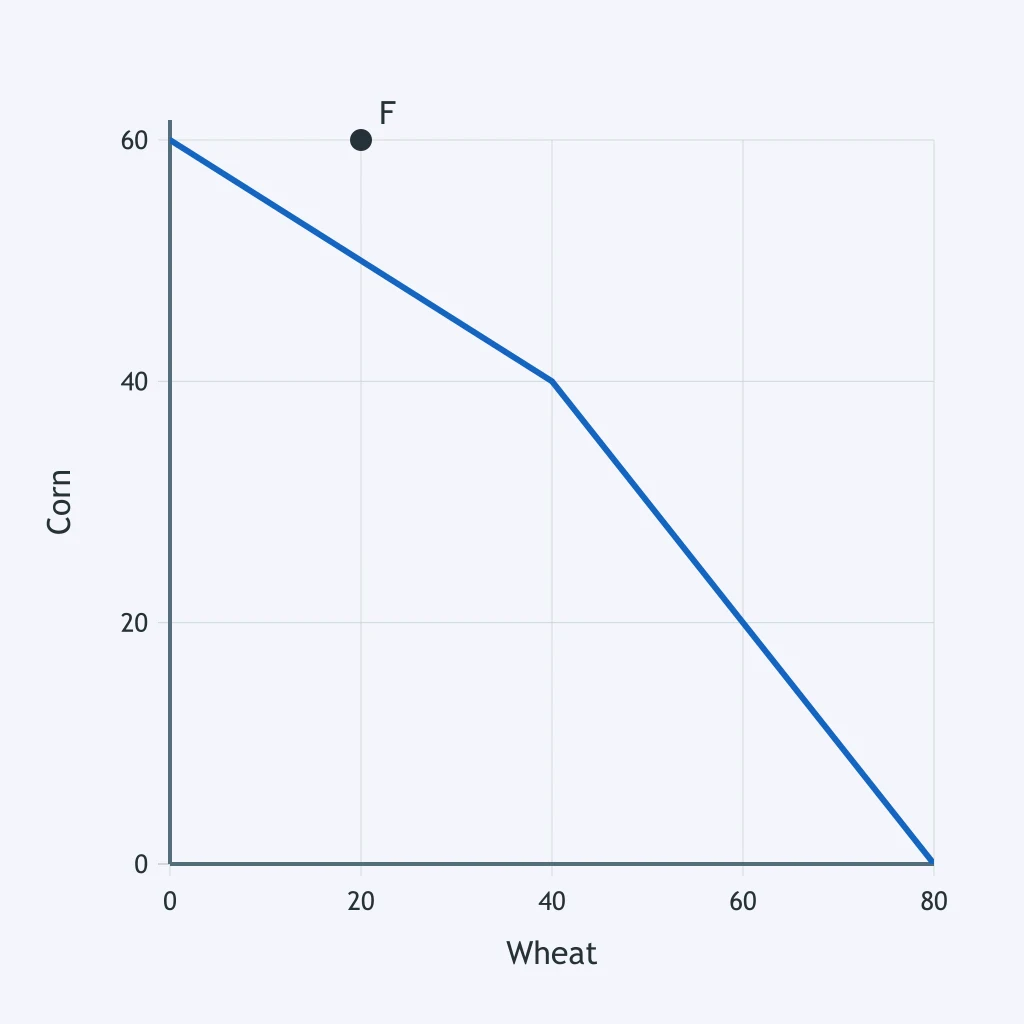
Use the PPC. What does point F reveal?
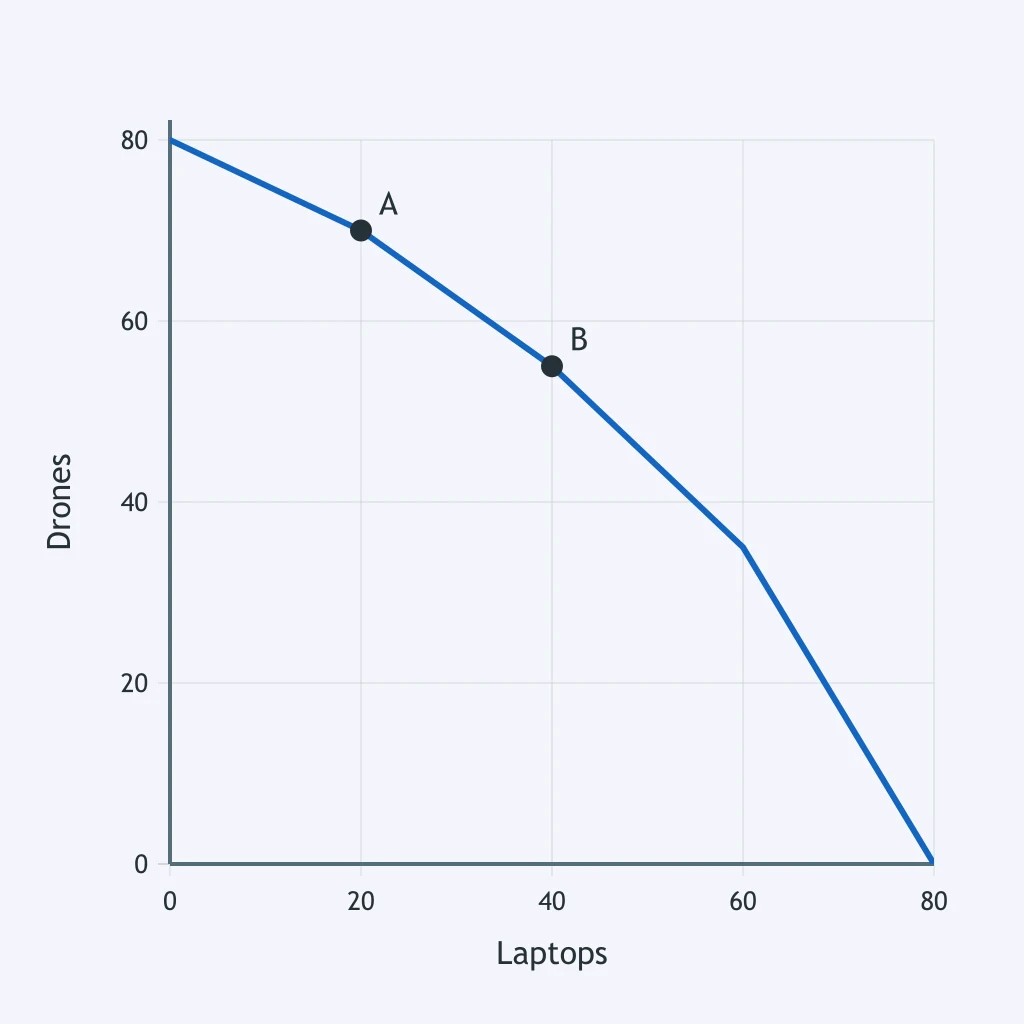
The PPC shows production moving from point A to point B. What is the opportunity cost of the additional laptops?
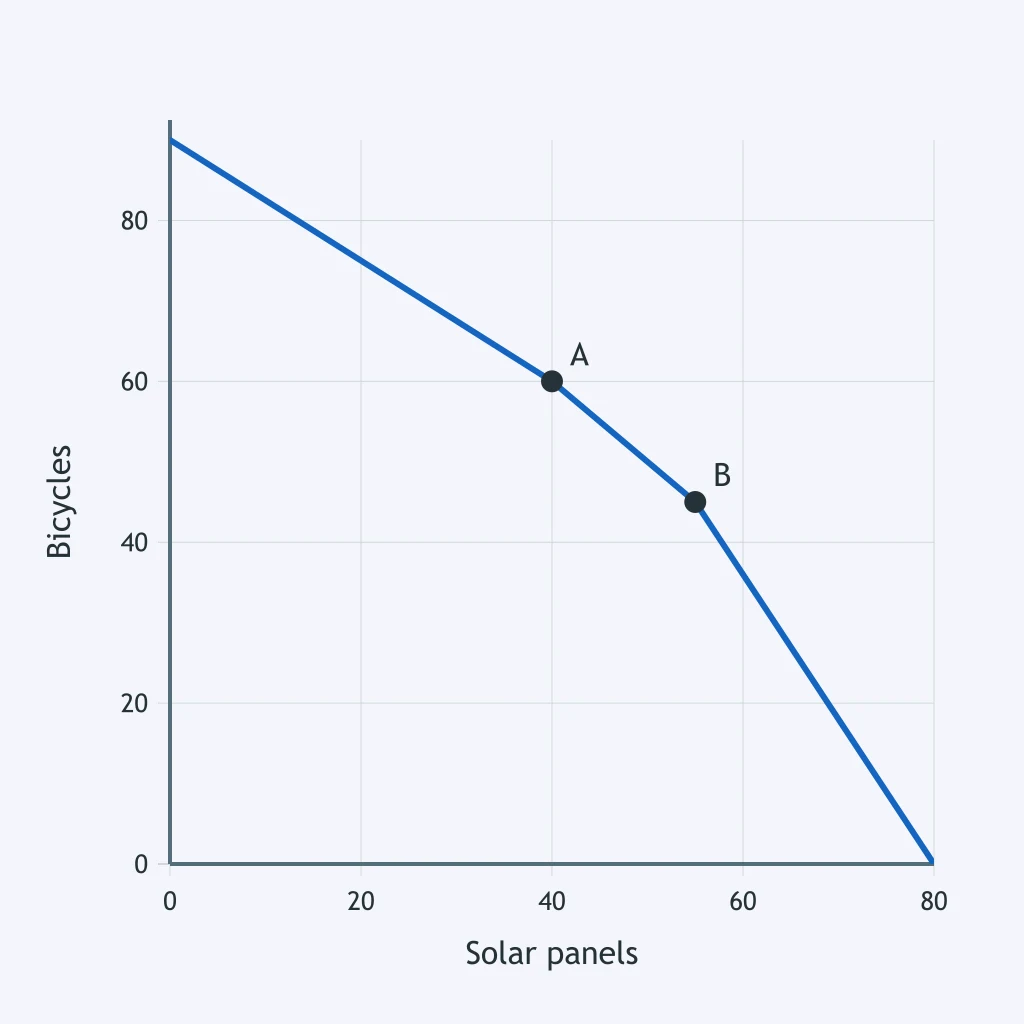
The figure shows output changing along the PPC from point A to point B. What is the opportunity cost of the additional solar panels?
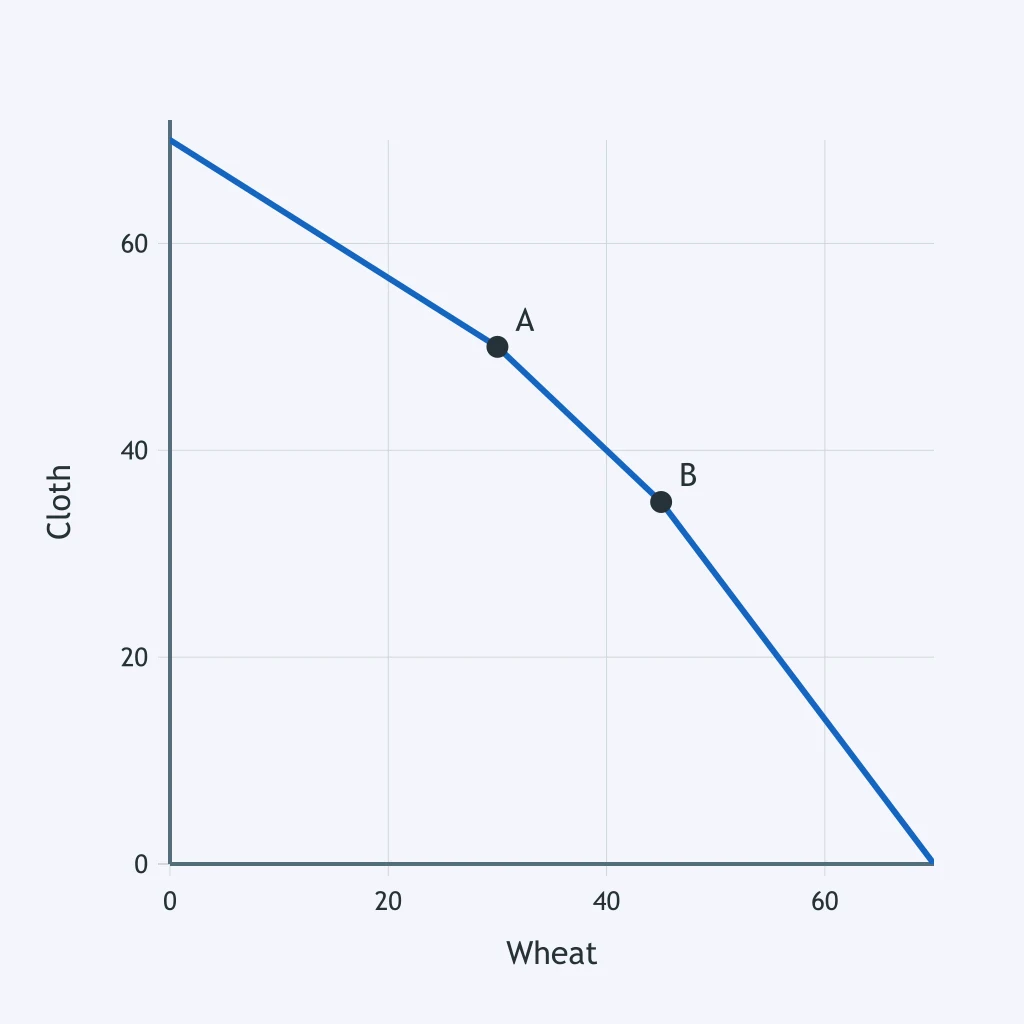
The PPC shows a nation moving from point A to point B. What is the opportunity cost of the extra wheat?
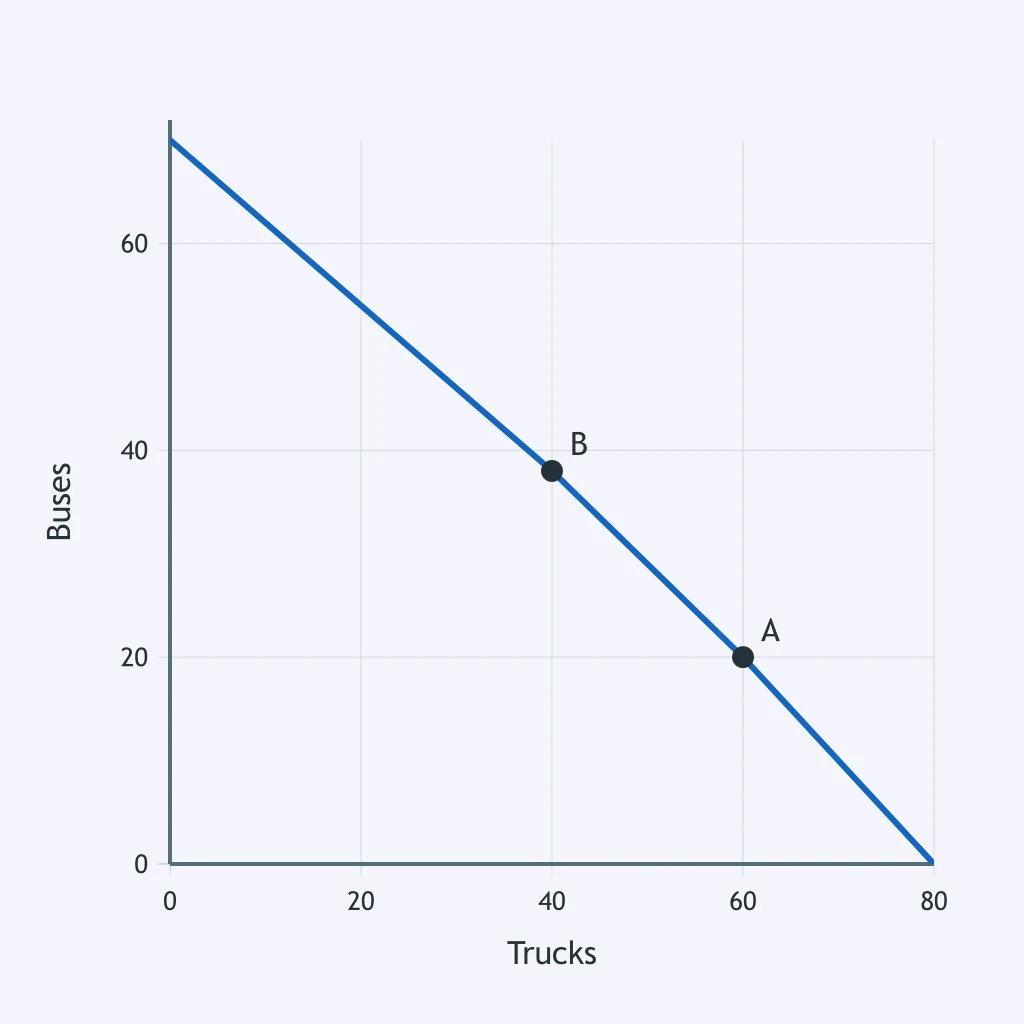
The PPC shows production shifting from point A to point B. What is the opportunity cost of producing the additional buses?
The graph shows the original PPC and a second, dashed PPC for the same economy. Which event best explains the change?
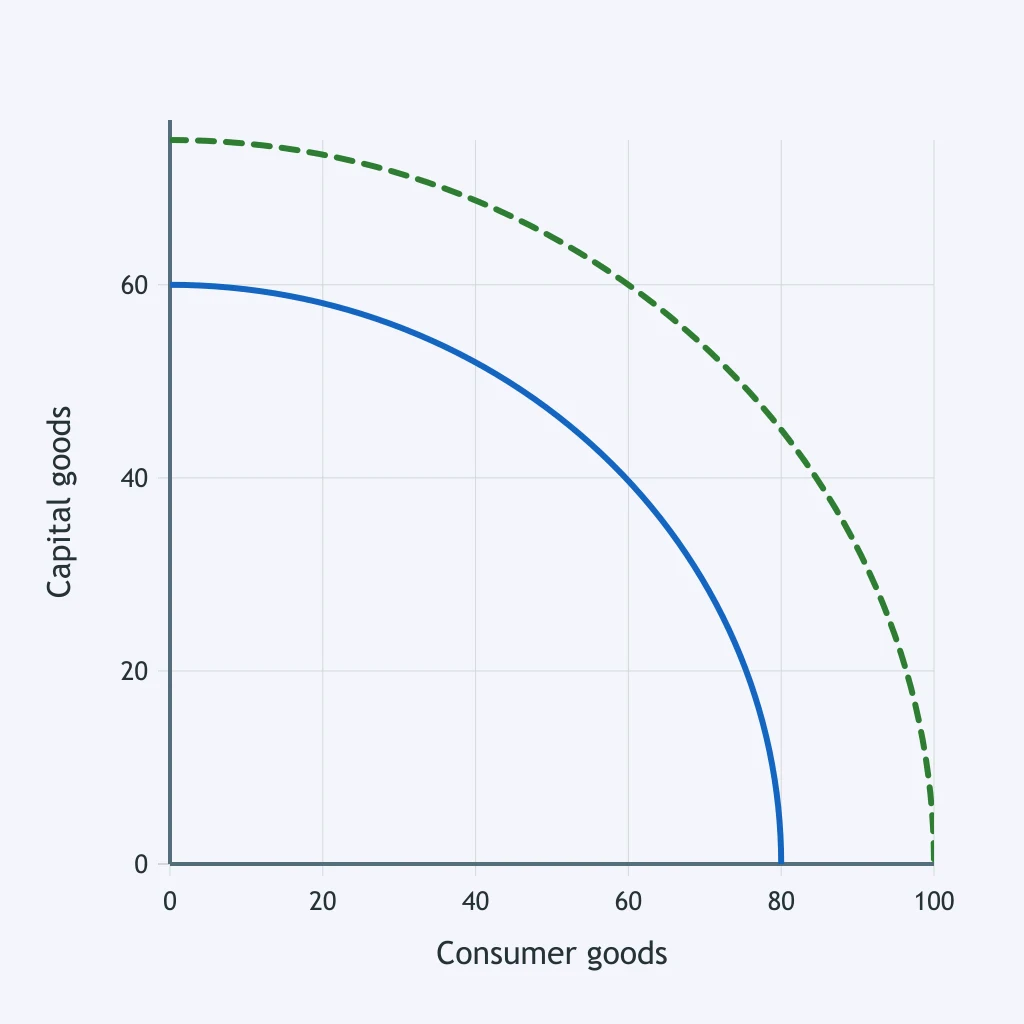
The graph shows the original PPC for farm equipment and crops and a second, dashed PPC. What is the most likely cause of the change?
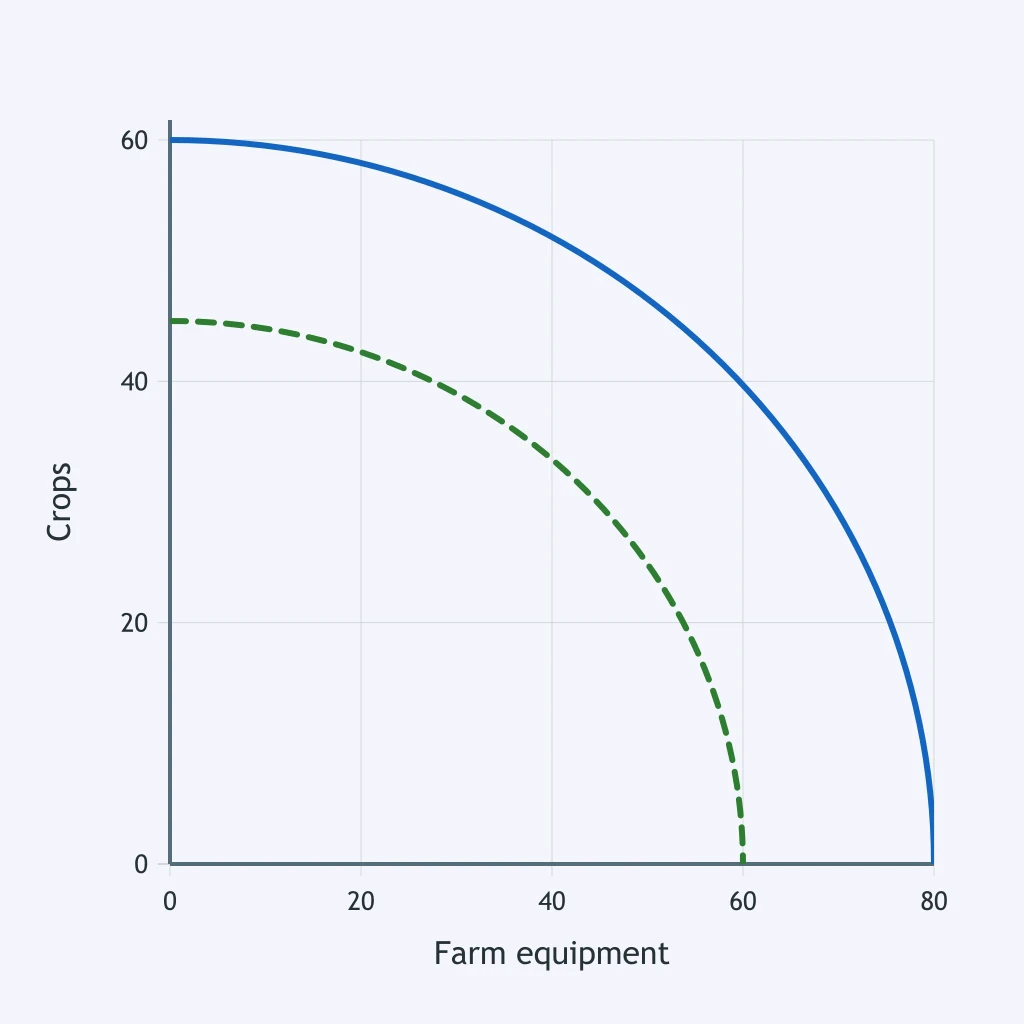
The graph shows a country's old PPC and a new, dashed PPC for medical services and other goods. Which development most likely caused the change?
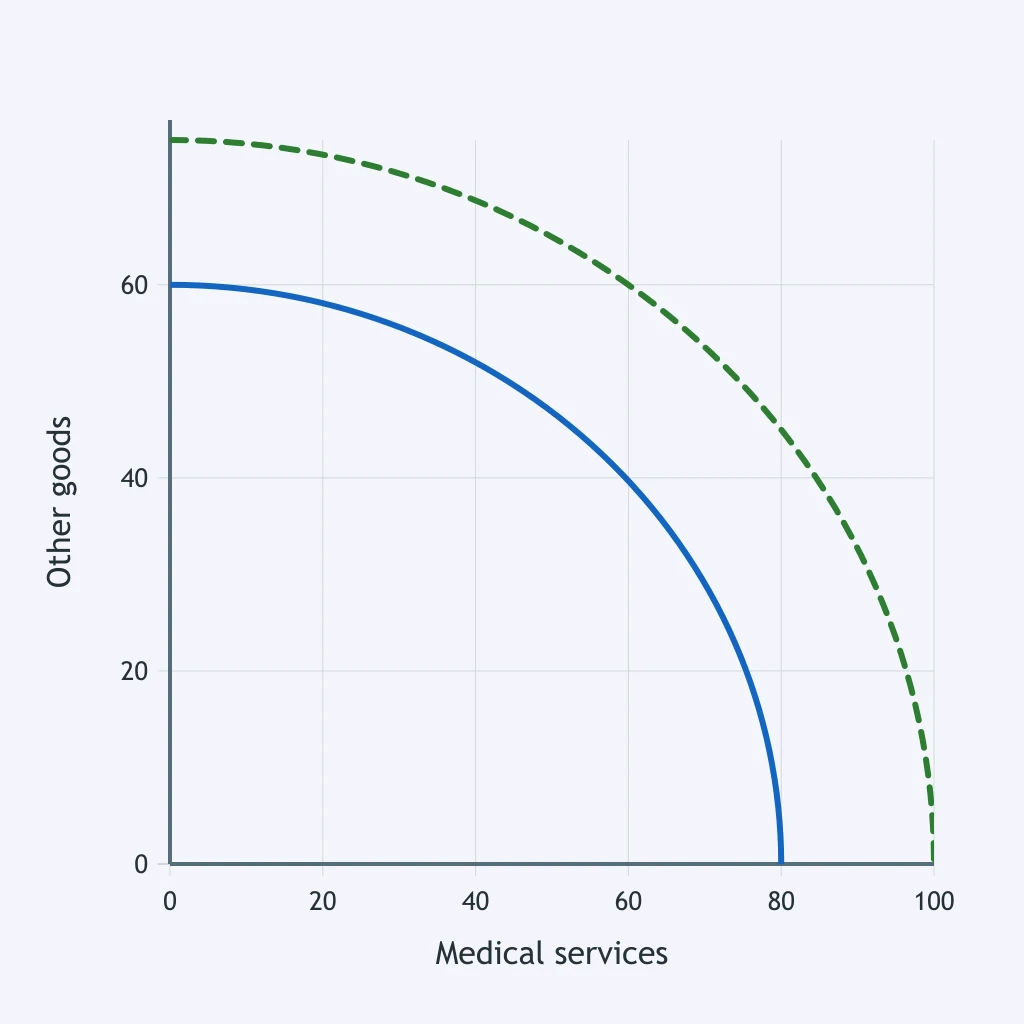
The graph shows two PPCs for housing and food. Which change most directly explains the dashed curve?
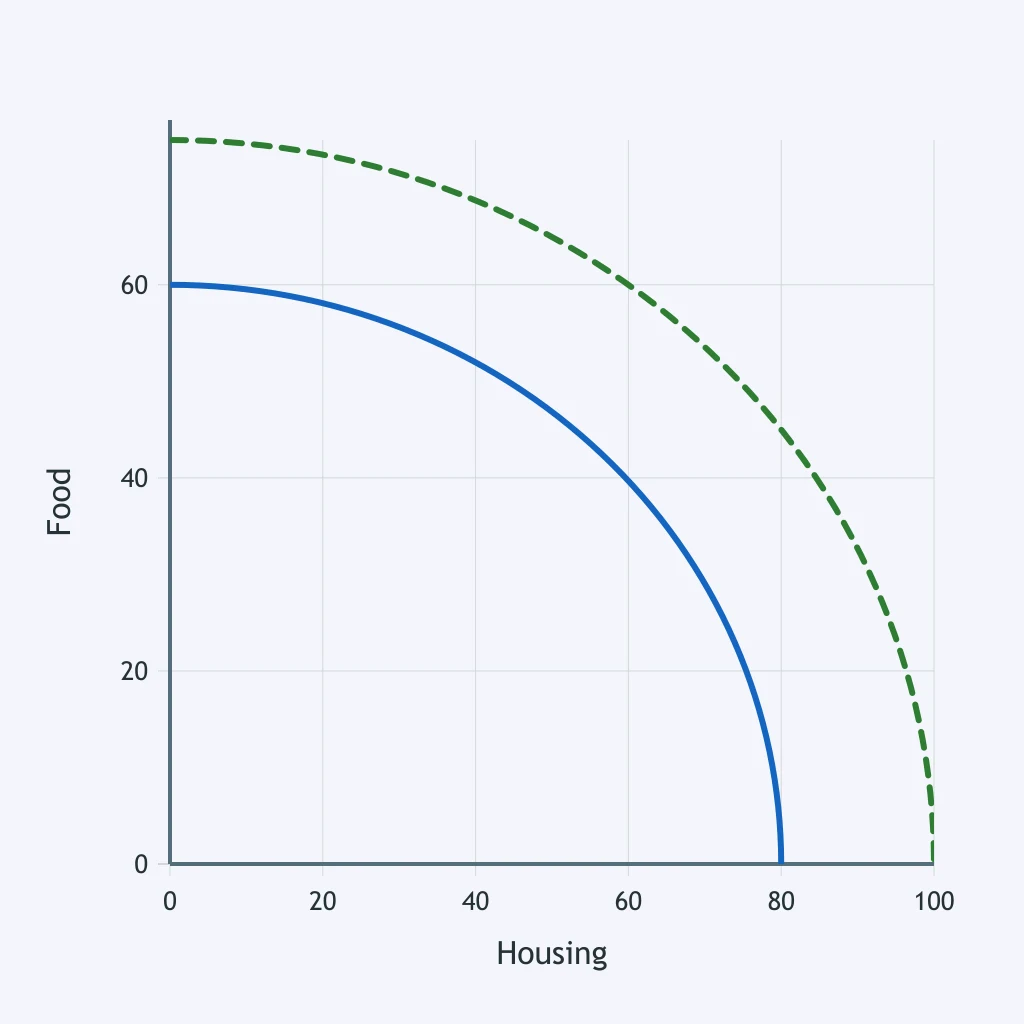
Why does a typical PPC bow outward from the origin rather than form a straight line?
What does a straight-line PPC indicate about the opportunity cost of shifting production from one good to another?
A PPC represents an economy's maximum output combinations at a particular time. Which condition is assumed to be fixed when the curve is drawn?
What does any point on a production possibilities curve represent?
Over several years, an economy becomes able to produce more of both goods. What happens to its PPC?
How does a PPC illustrate scarcity?
Crack the passcode before the zombies get in.
Answer, then swat bugs for bonus points.
Race through questions at your own speed.
Same question on every screen. Fastest wins.

Pick a tile, answer, hit bonuses and steals.

Goods, Services, Producers and Consumers
20 questions