Loading
by BlastRoom
Practice interpreting IELTS Task 1 bar charts and writing concise comparison sentences.
#writing_task_1#ielts_6_0
30 questions
One question set, multiple game modes. Tap any game to see it in action. Not sure which to pick?
Answer to place stones and capture territory.
Outrun the snow together.
Earn blasts, then hunt the other team.
Answer to earn energy, then climb.

The class blasts through walls together.
Bid on mystery lots. Most money wins.
Sell tours. Nice, standard, or a total scam.

Answer, restock, and serve the rush.
More correct answers pulls the rope your way.
Answer, then shoot down the alien wave.
Answer, then tap to leap the frozen ridge.
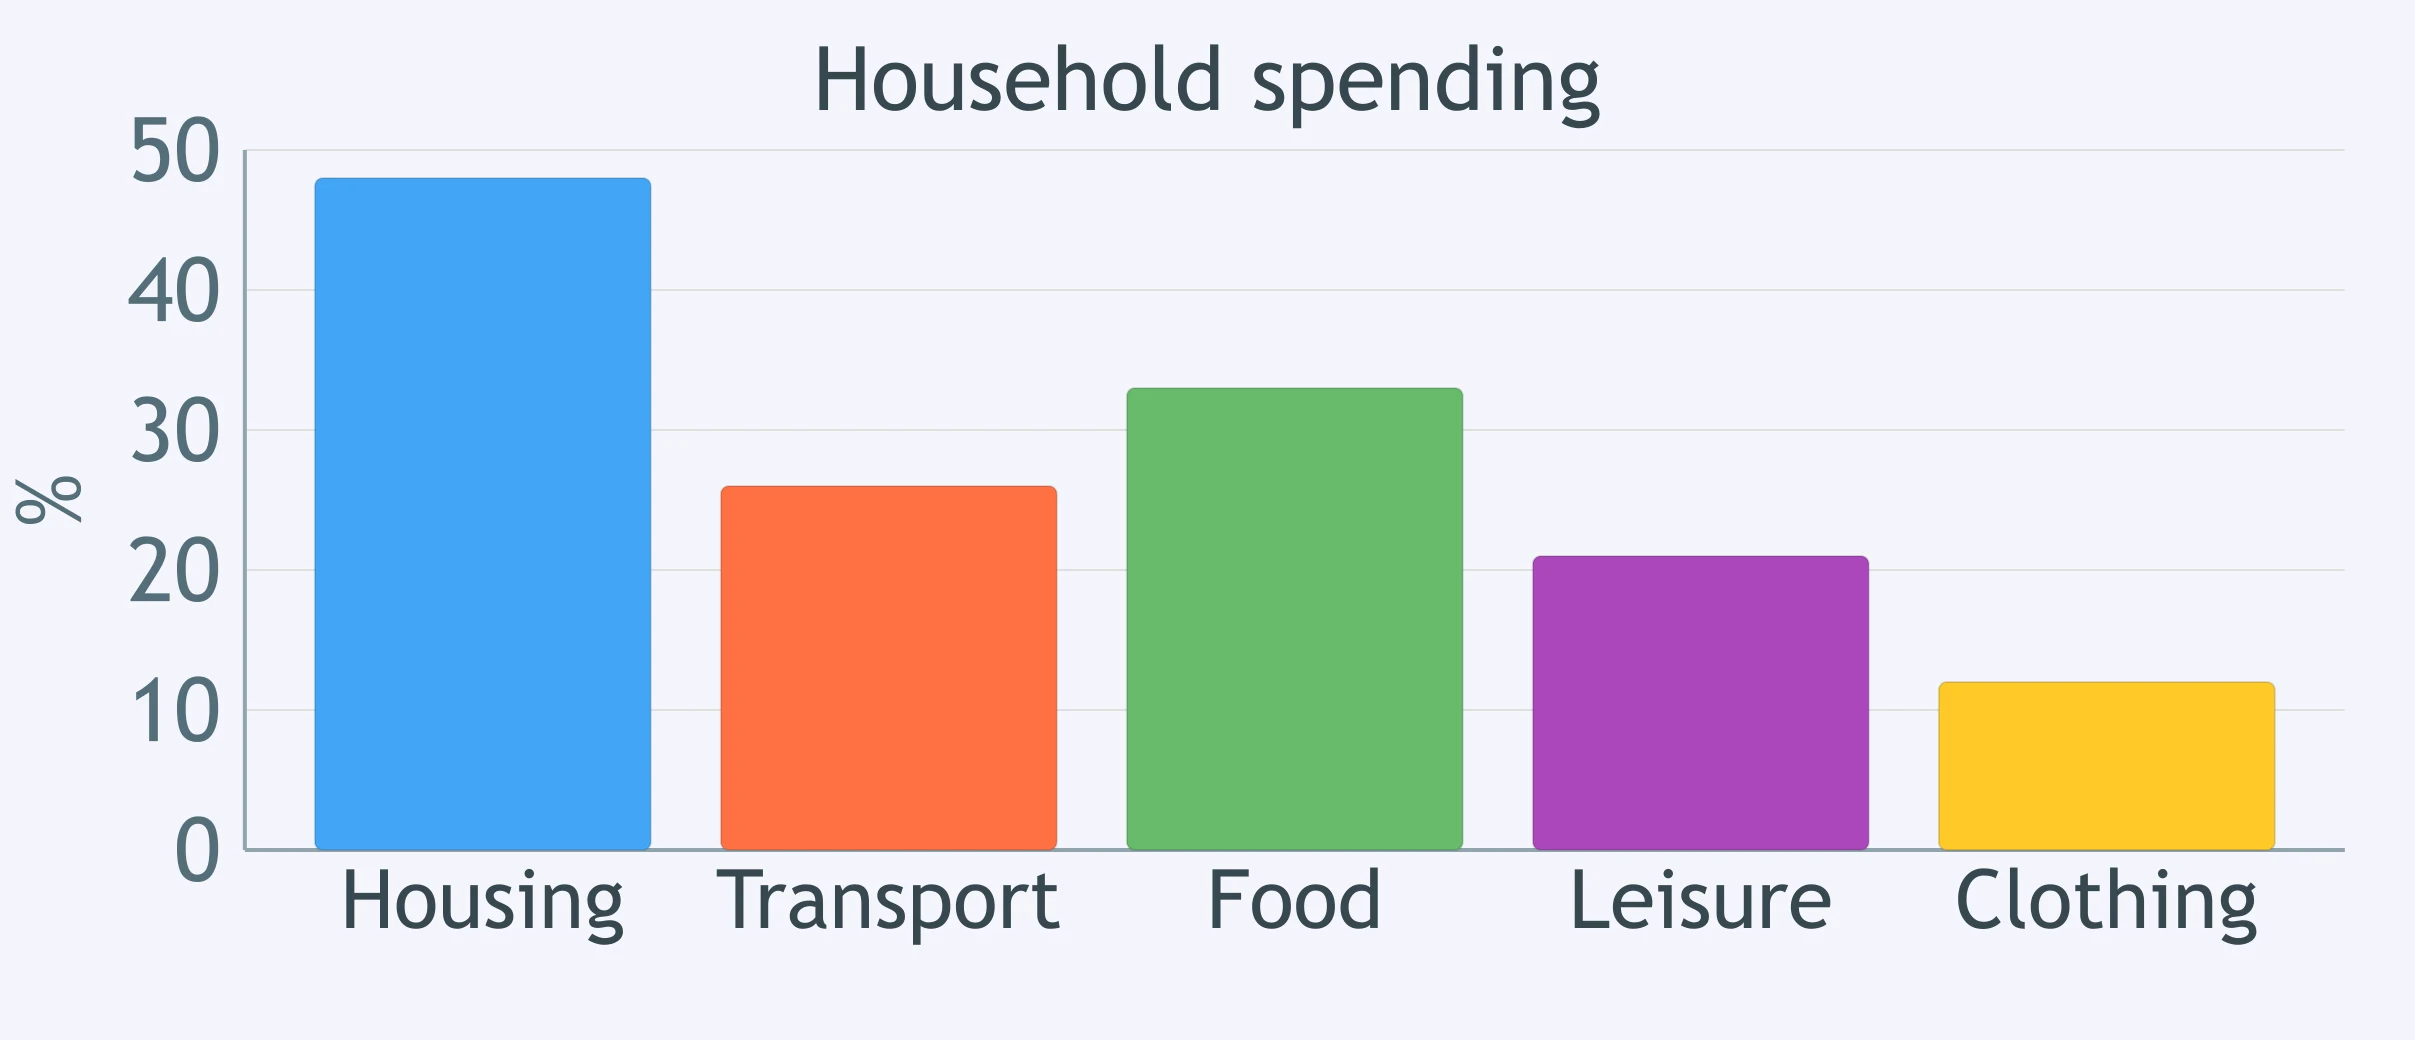
The chart compares household spending across five categories. Which sentence identifies the tallest column?
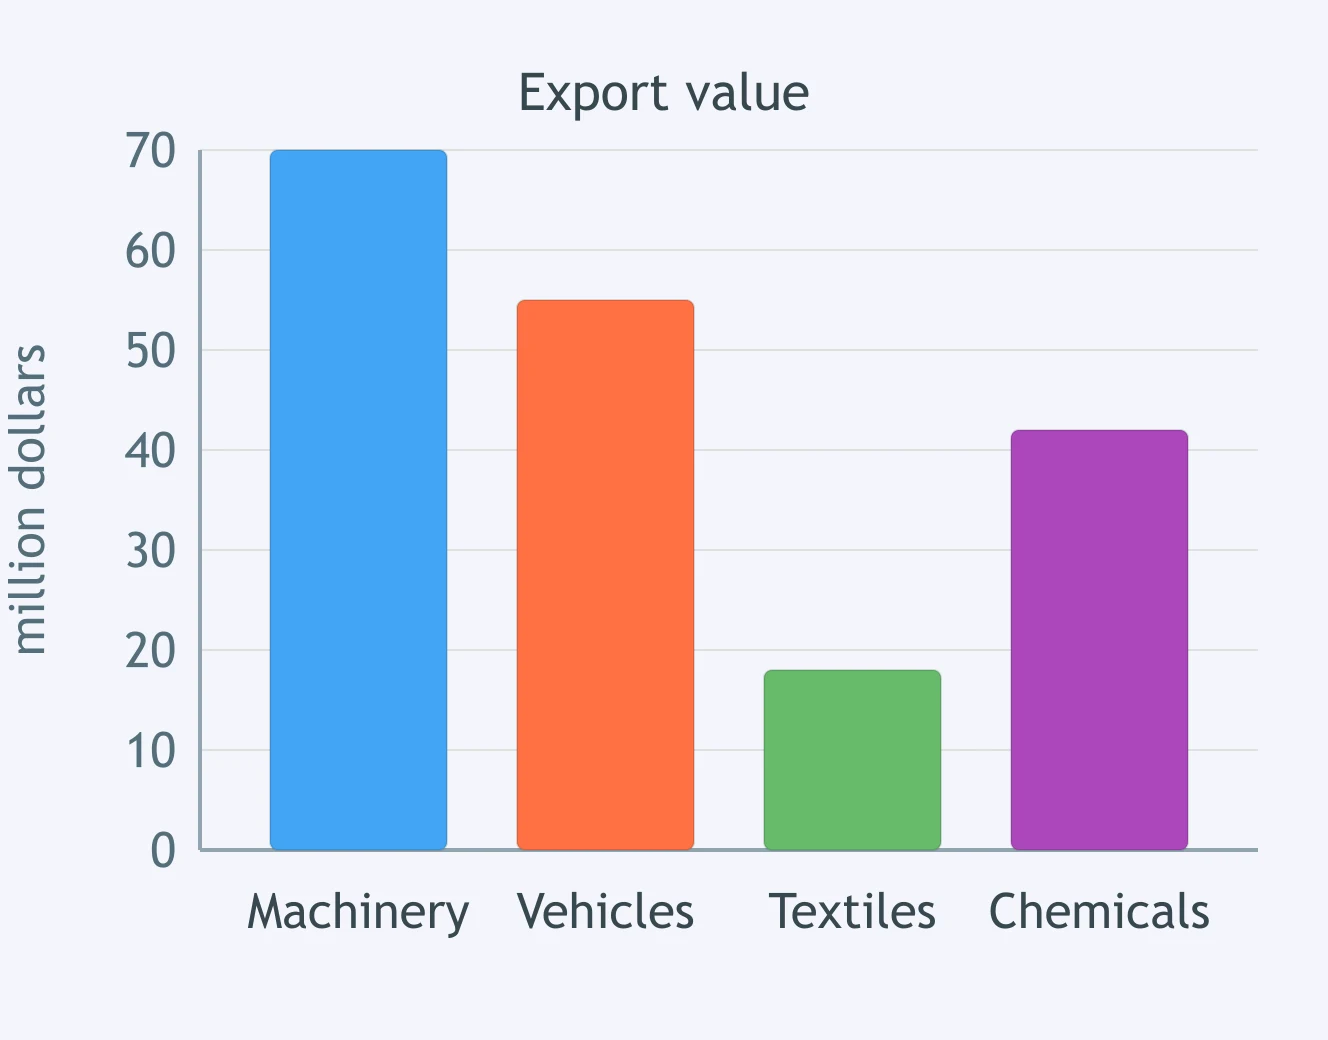
The chart shows export values for four products. Which sentence correctly names the shortest column?
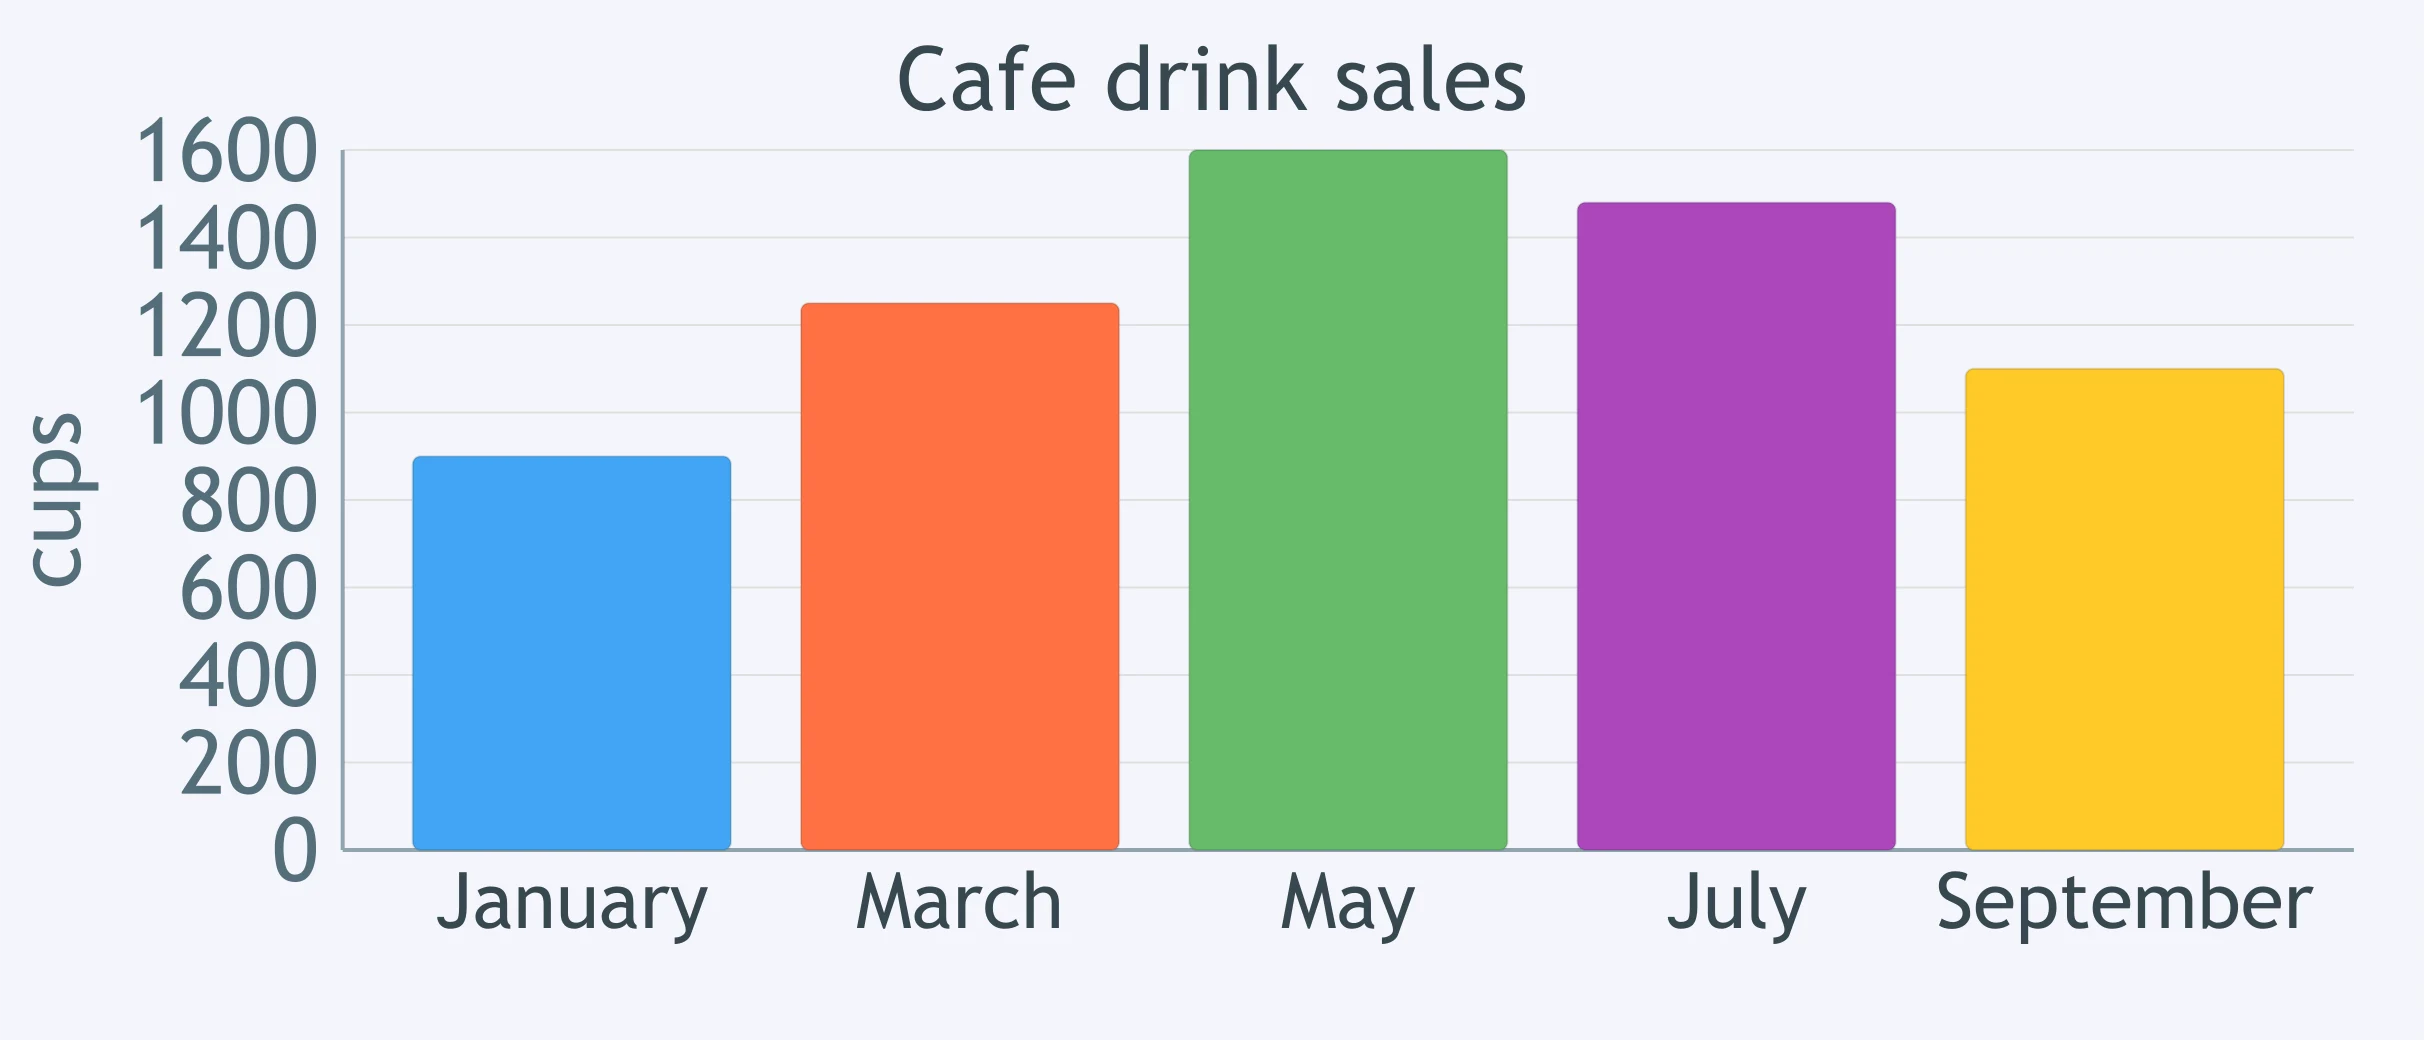
Look at the café drink sales chart. Which month has the tallest column?
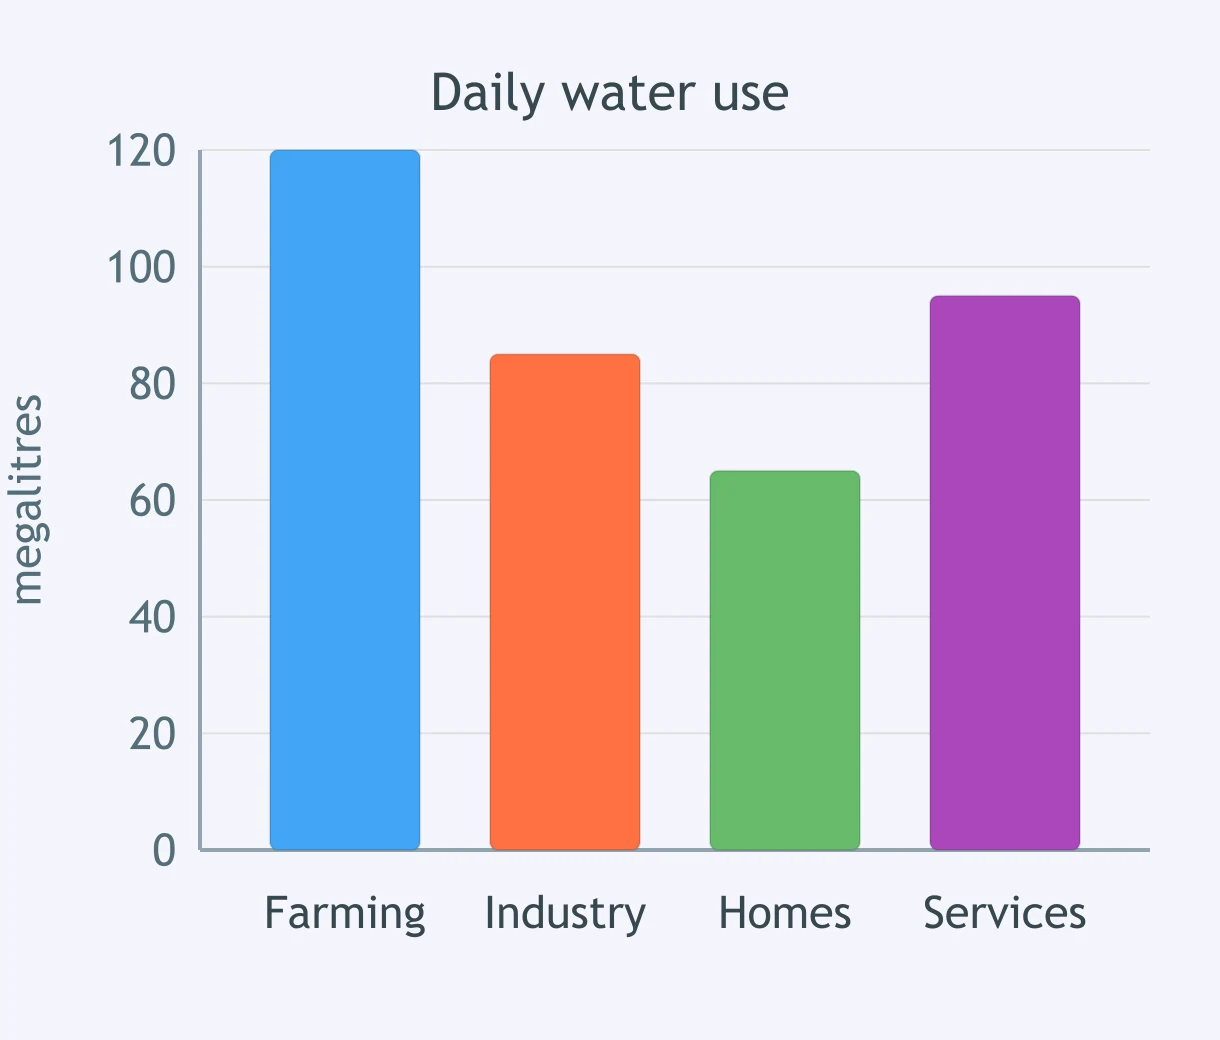
The chart compares daily water use by sector. Which sector has the shortest column?
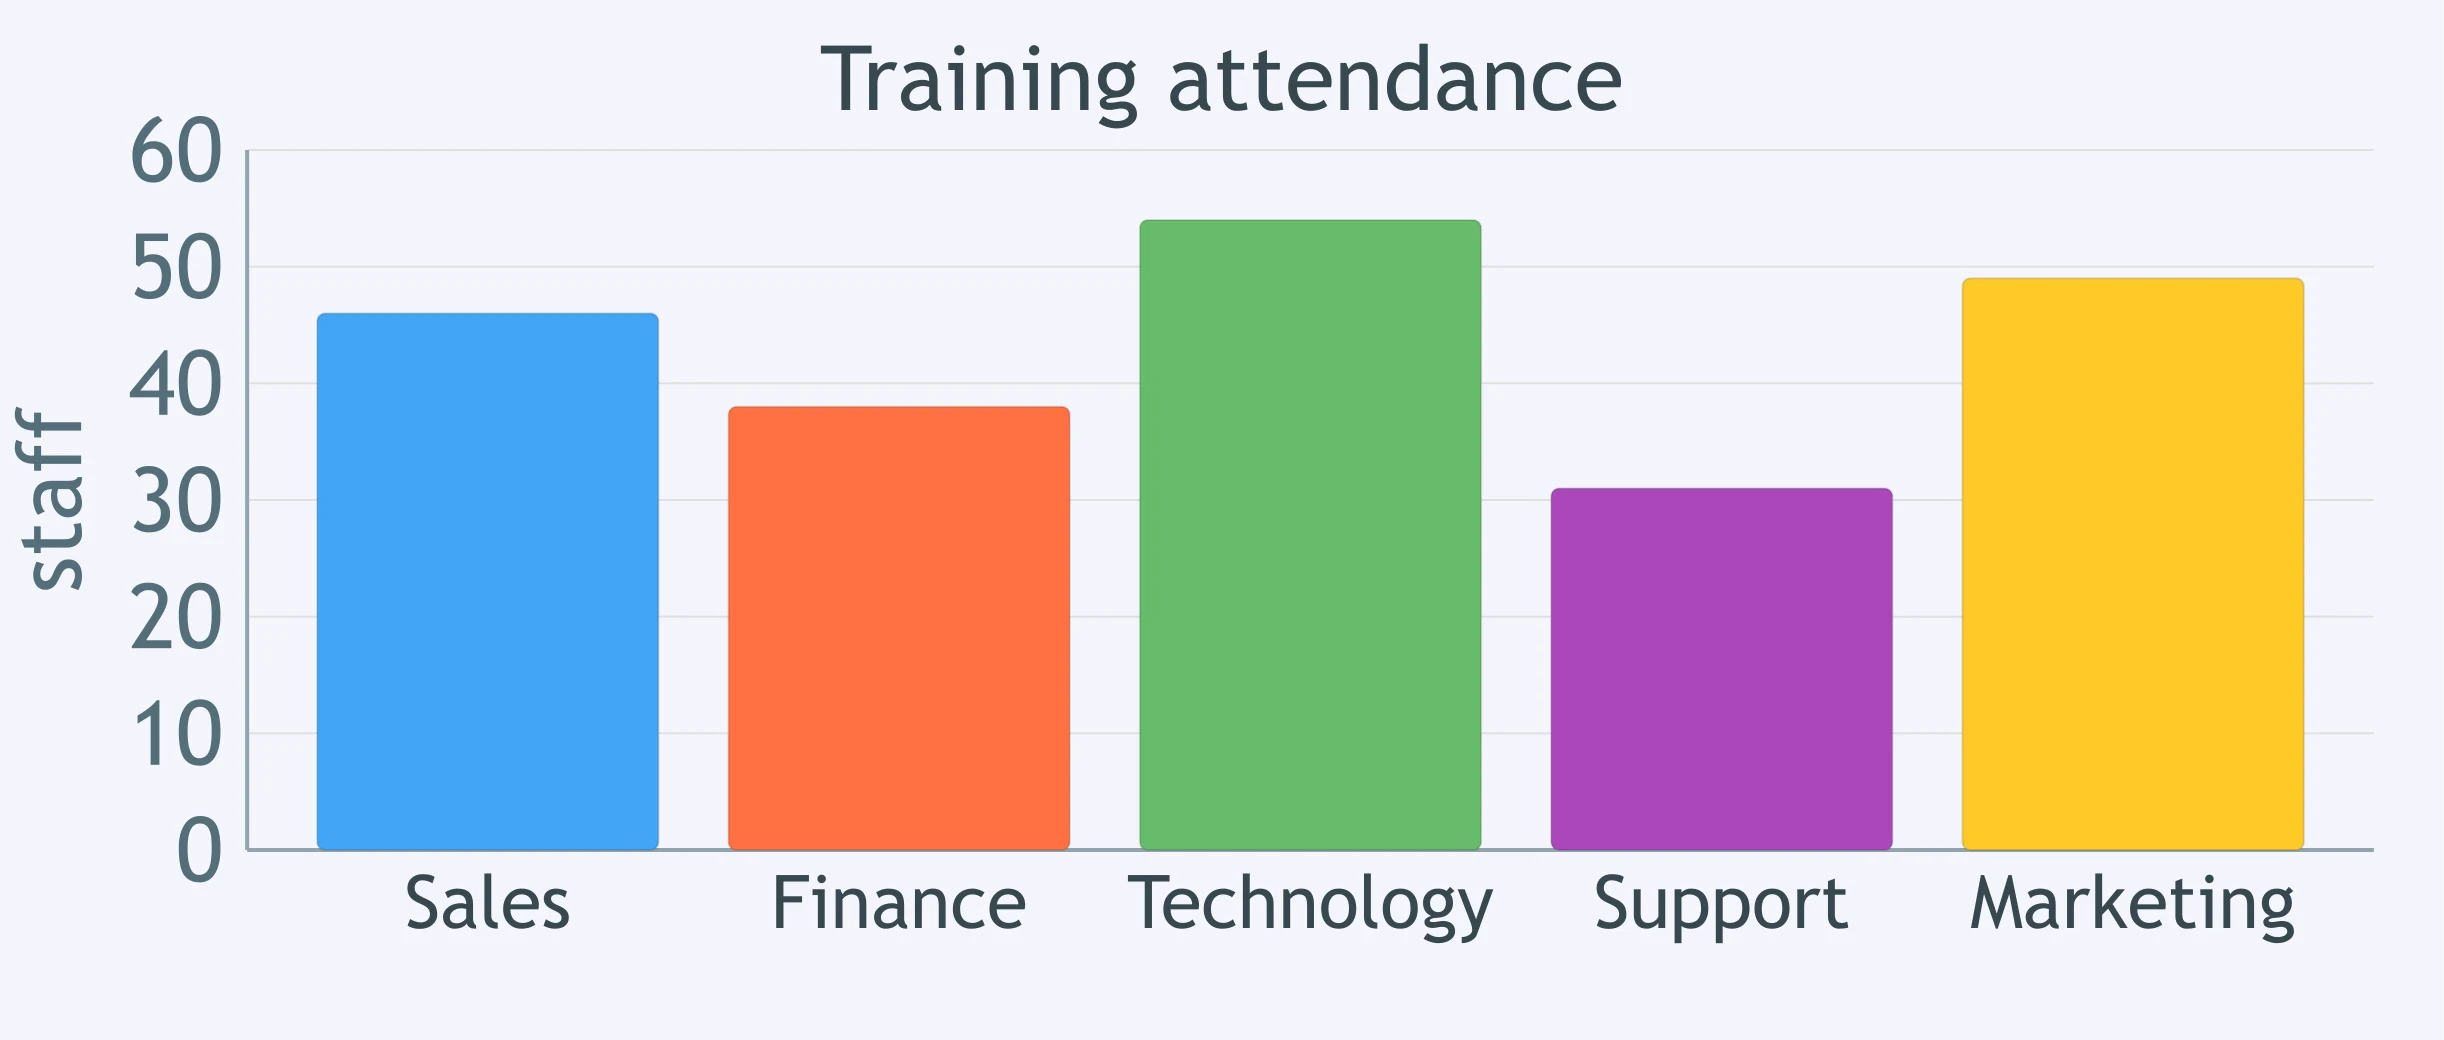
The chart reports training attendance by department. Which statement identifies the tallest column?
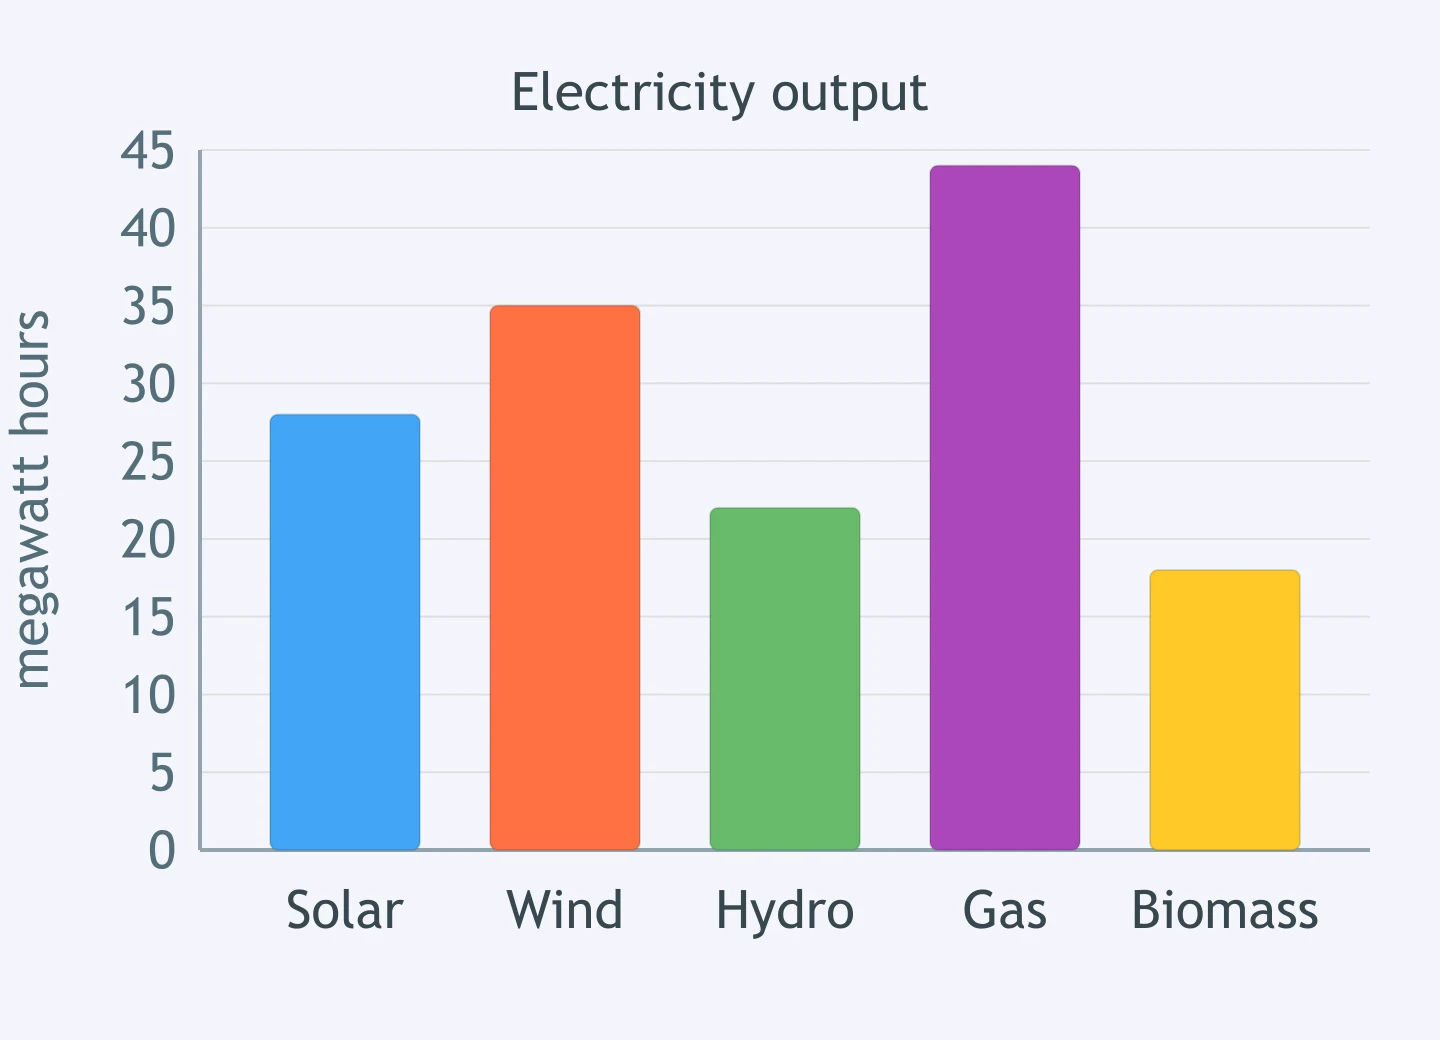
The chart compares electricity output by source. Which source has the shortest column?
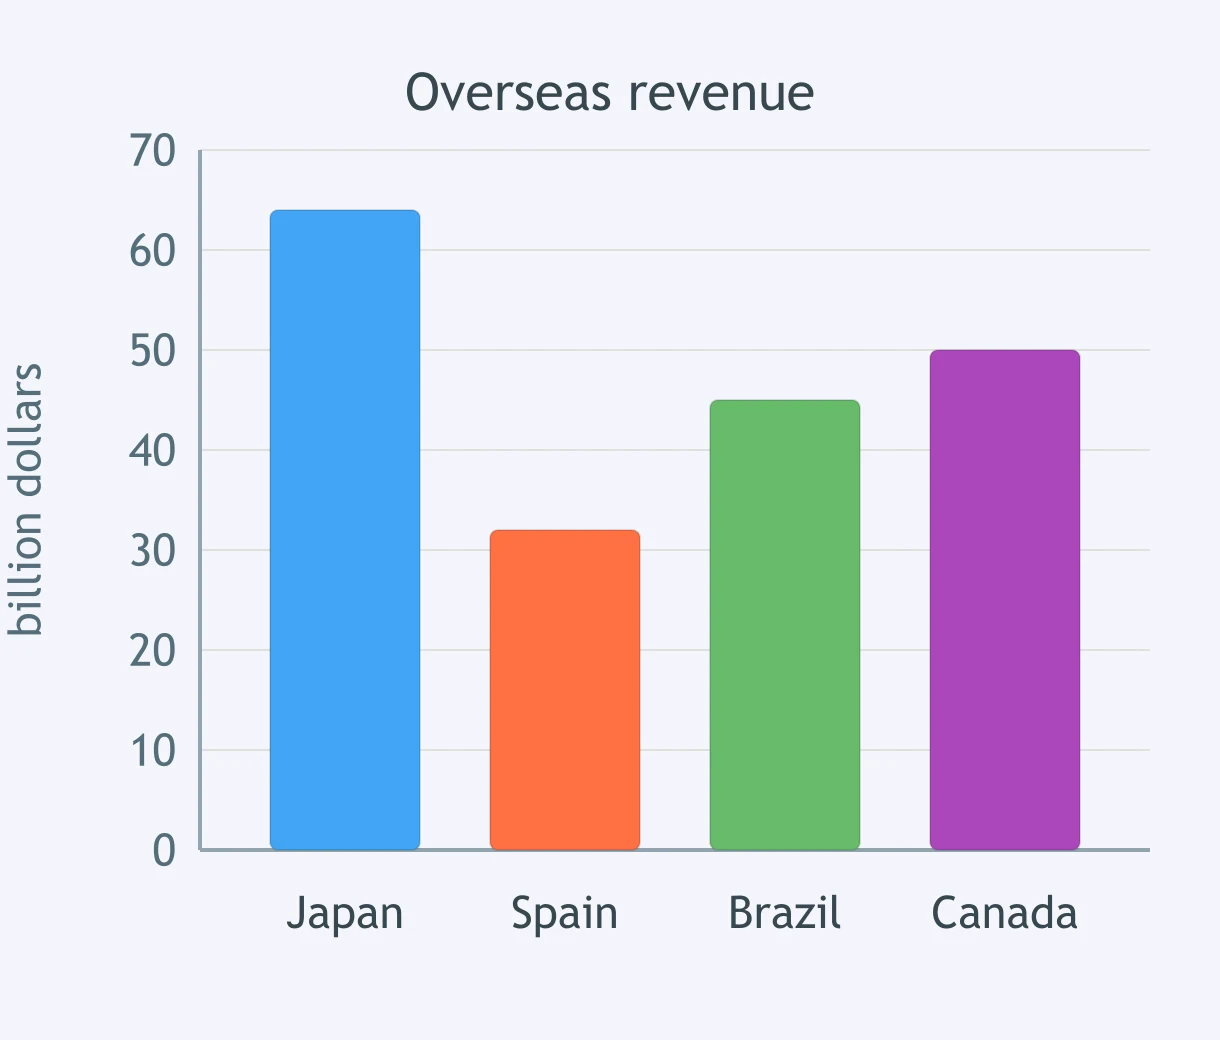
Compare the columns for Japan and Spain. Which sentence states the relationship correctly?
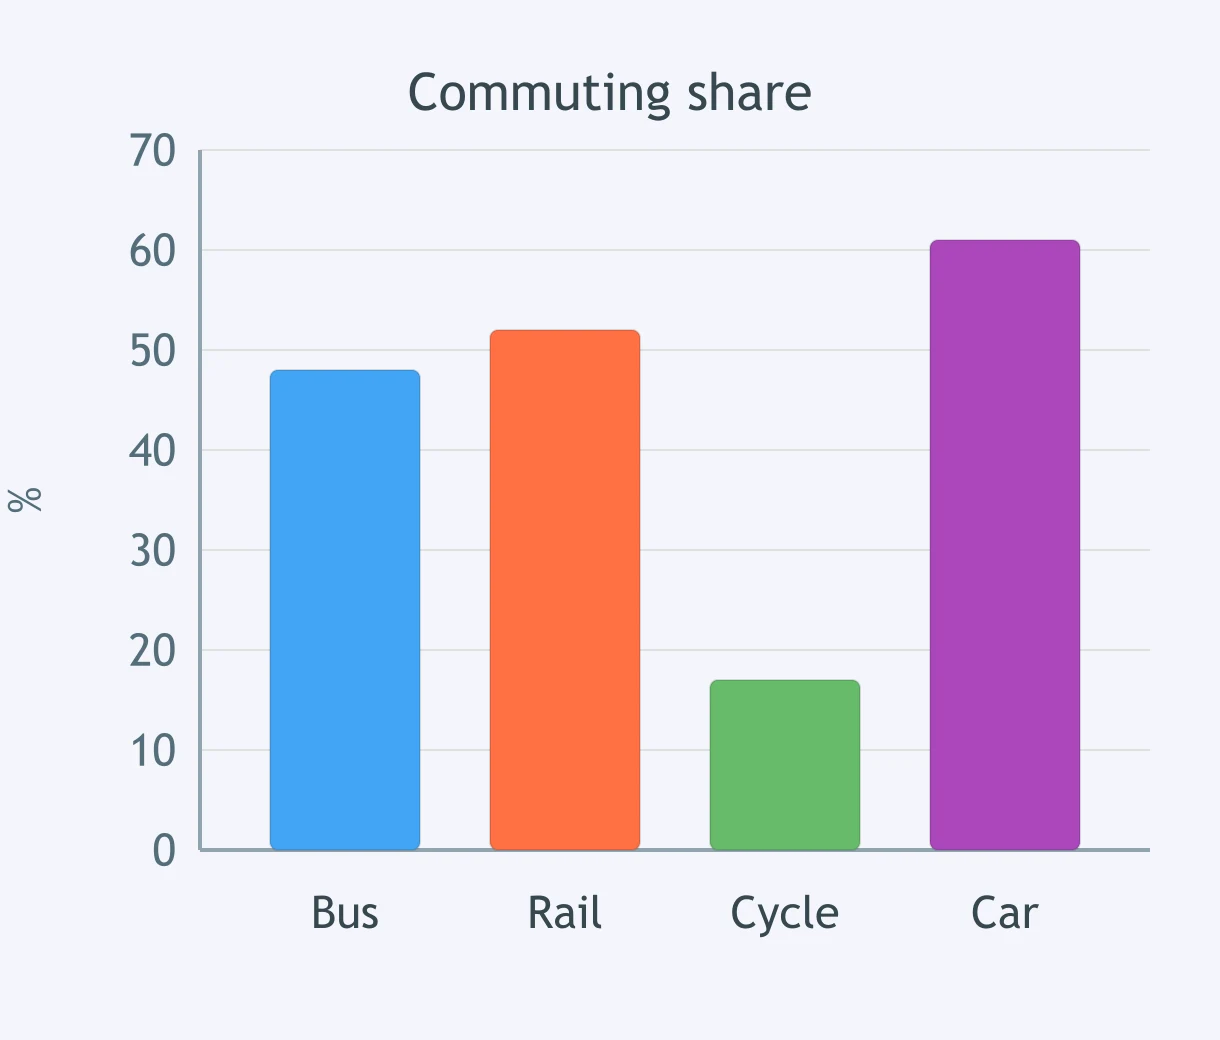
Focus on the bus and rail columns. Which comparison is accurate?
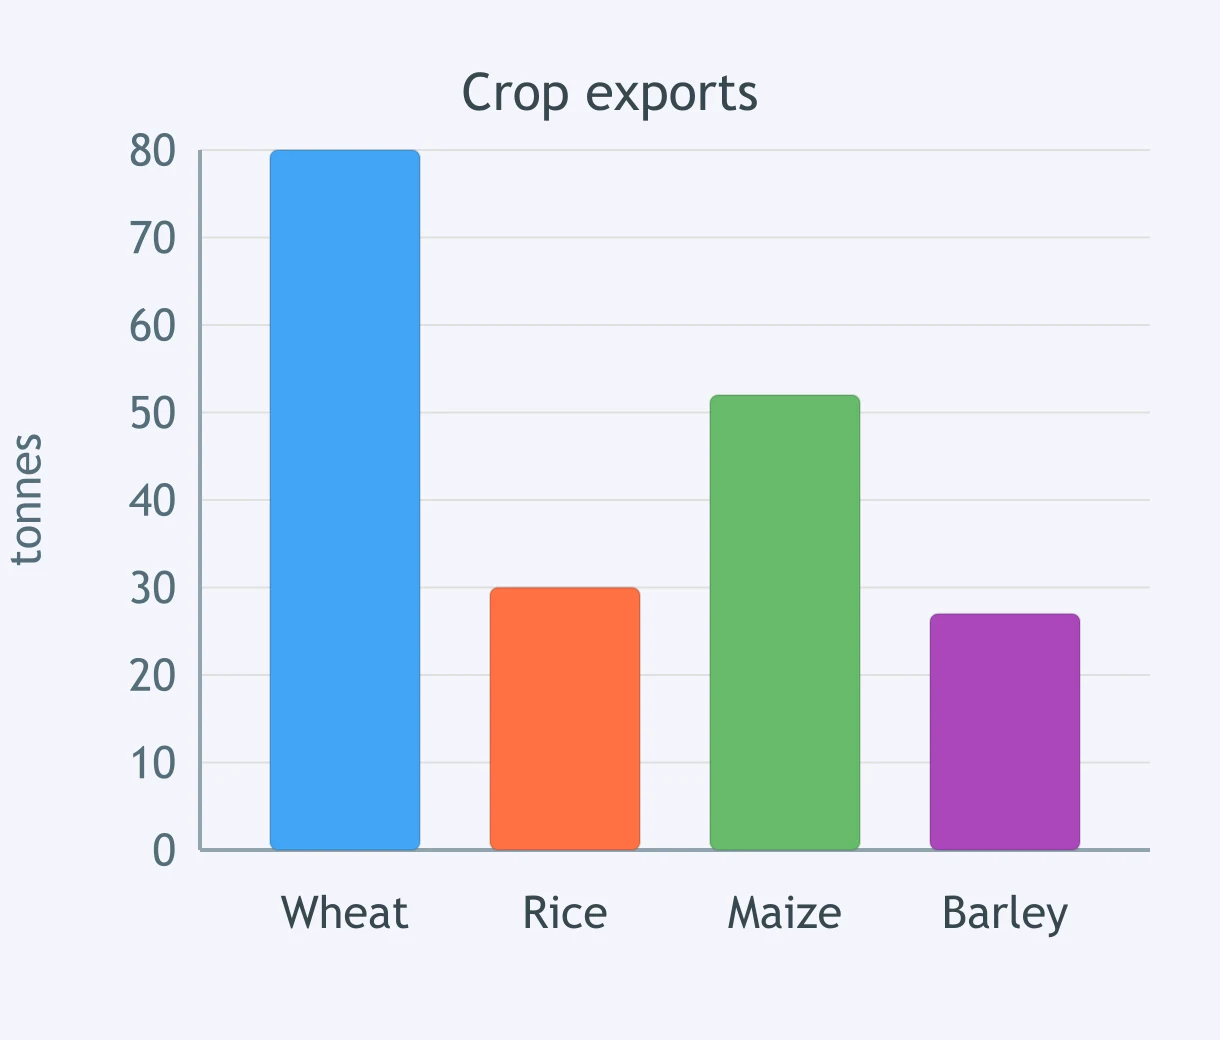
Compare wheat with rice in the crop export chart. Which sentence is correct?
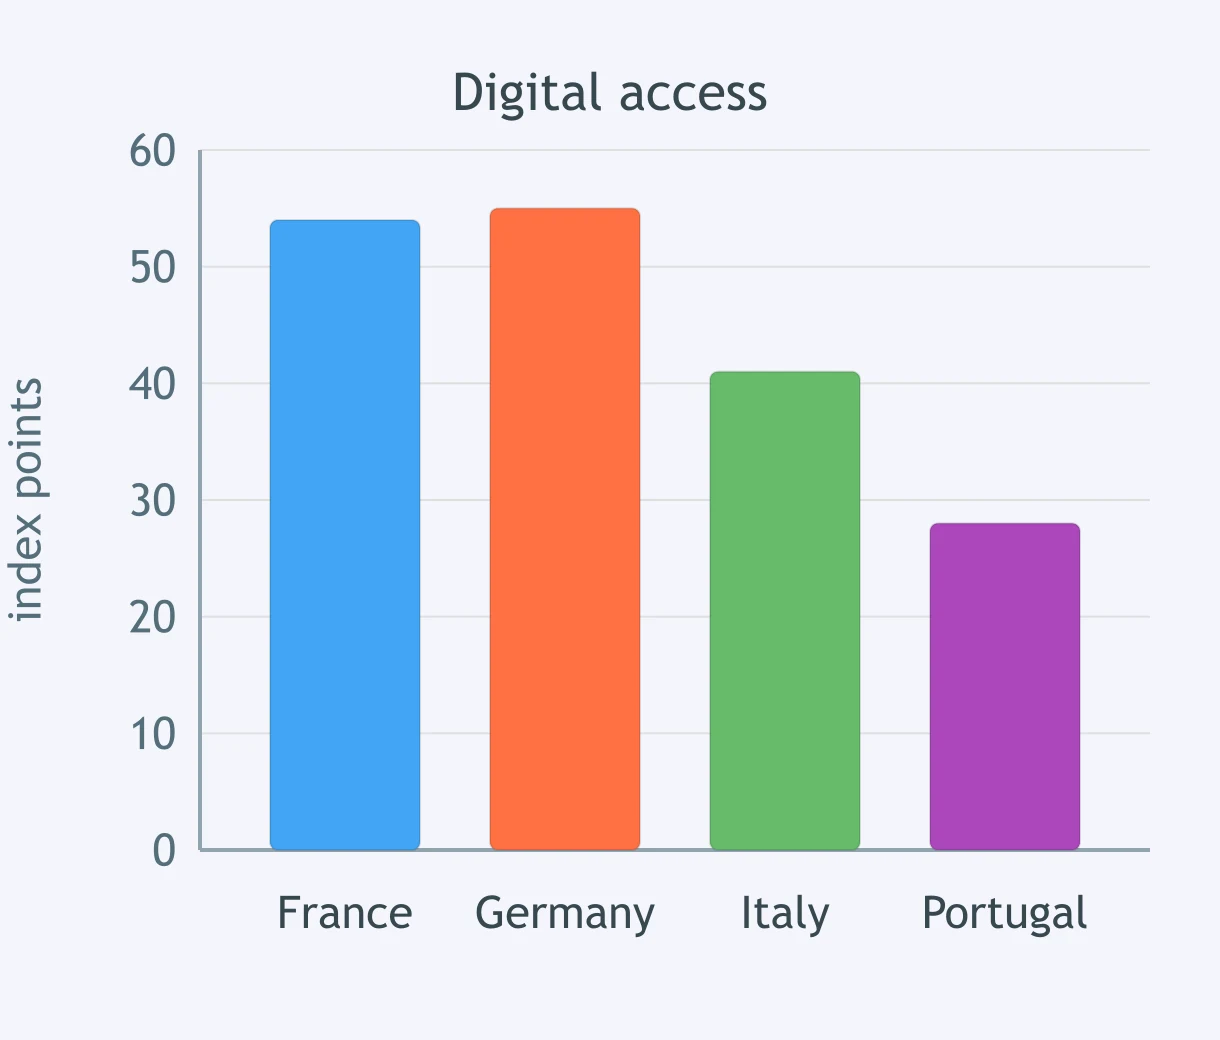
Compare France and Germany in the digital access chart. Which sentence best matches the columns?
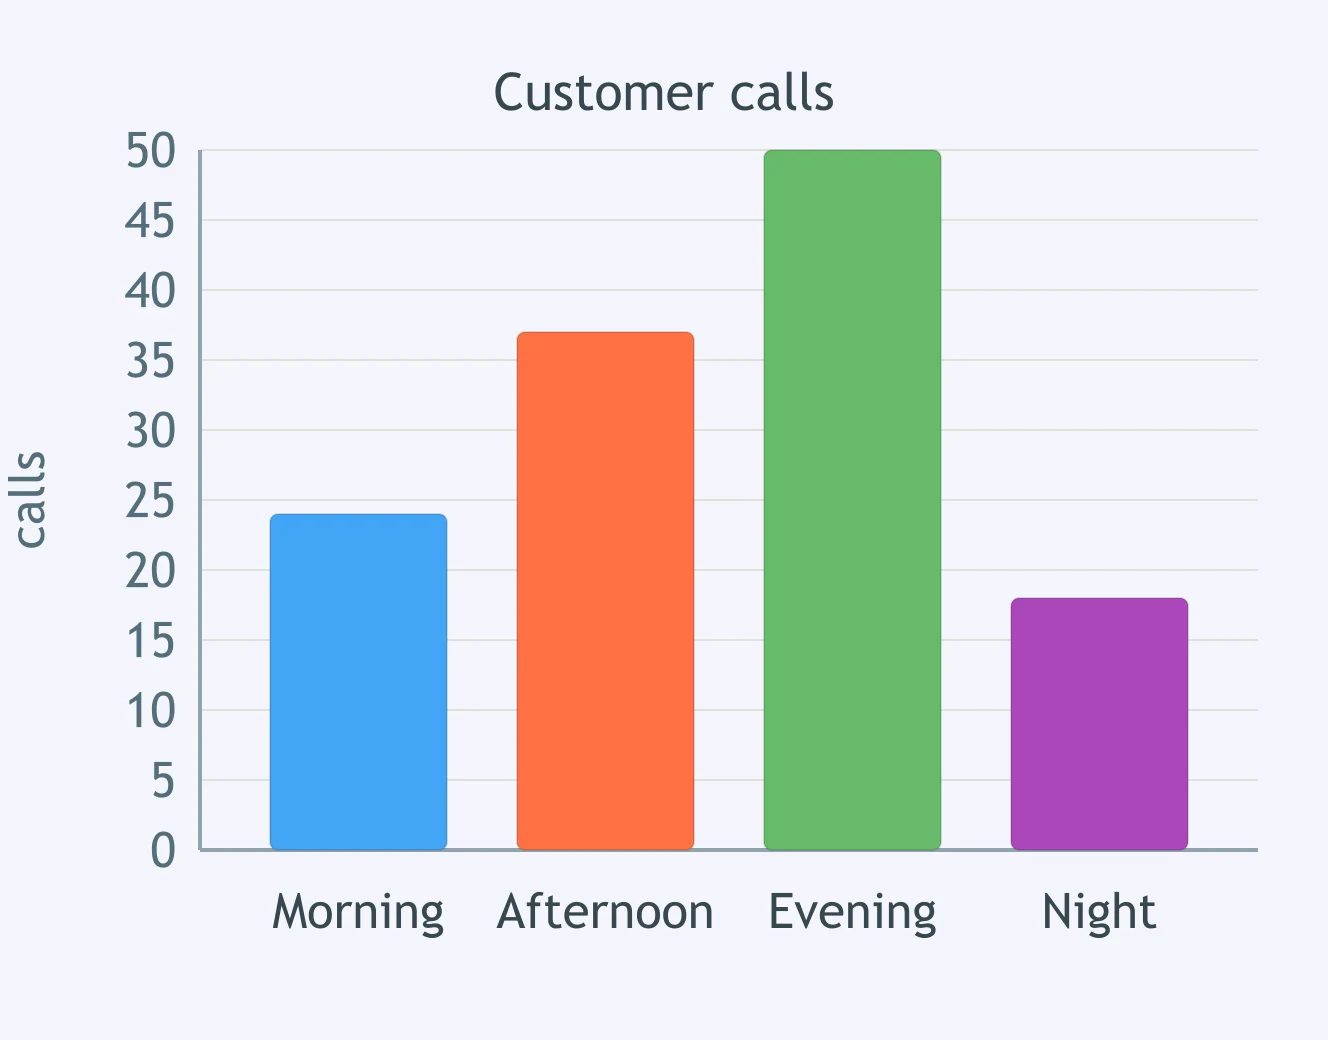
Compare the morning and evening columns for customer calls. Which sentence states the relationship accurately?
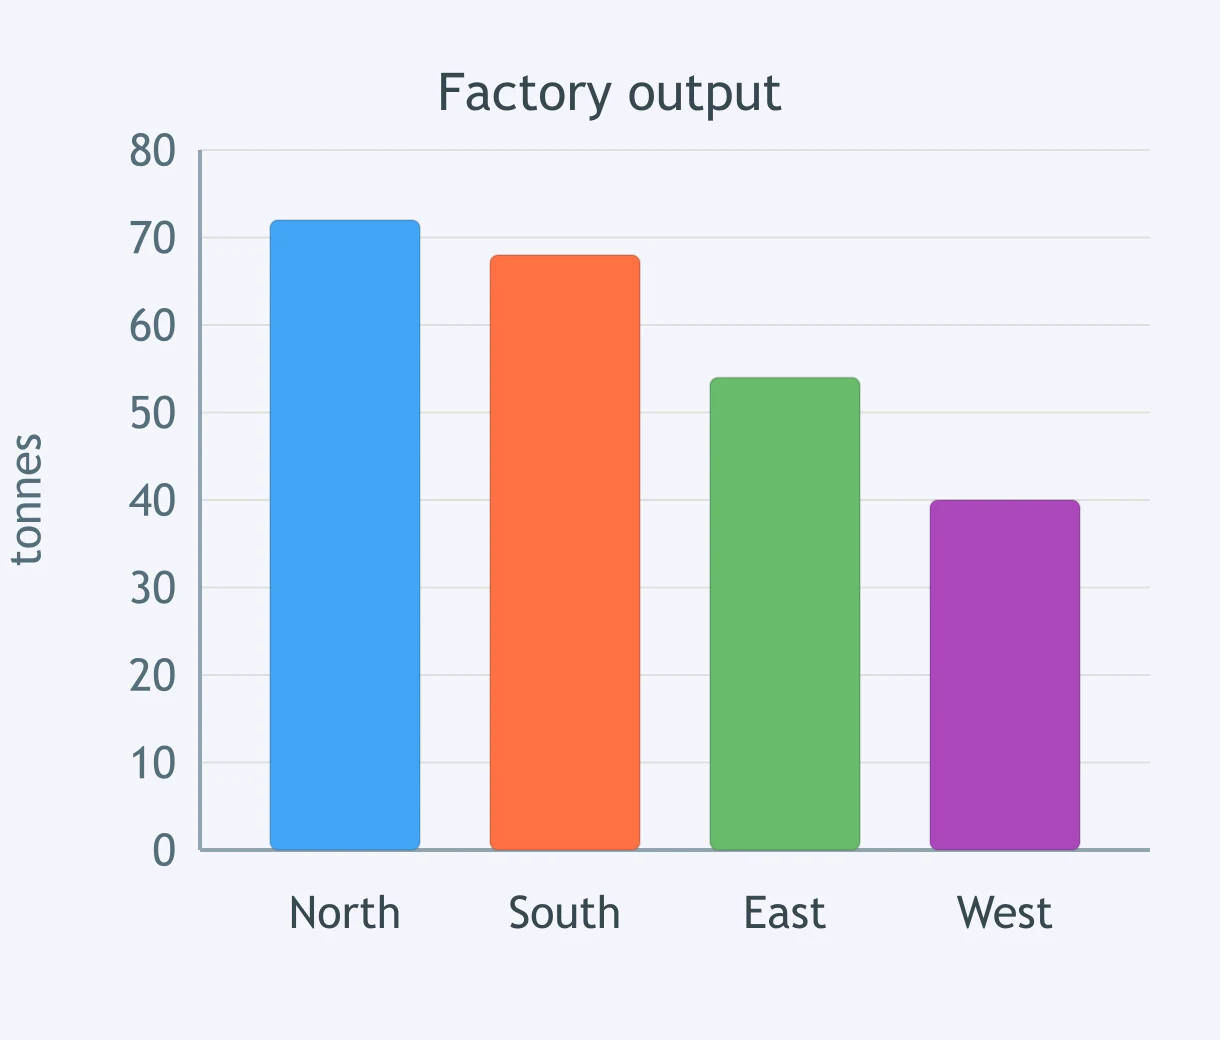
Compare the north and south columns in the output chart. Which sentence is accurate?
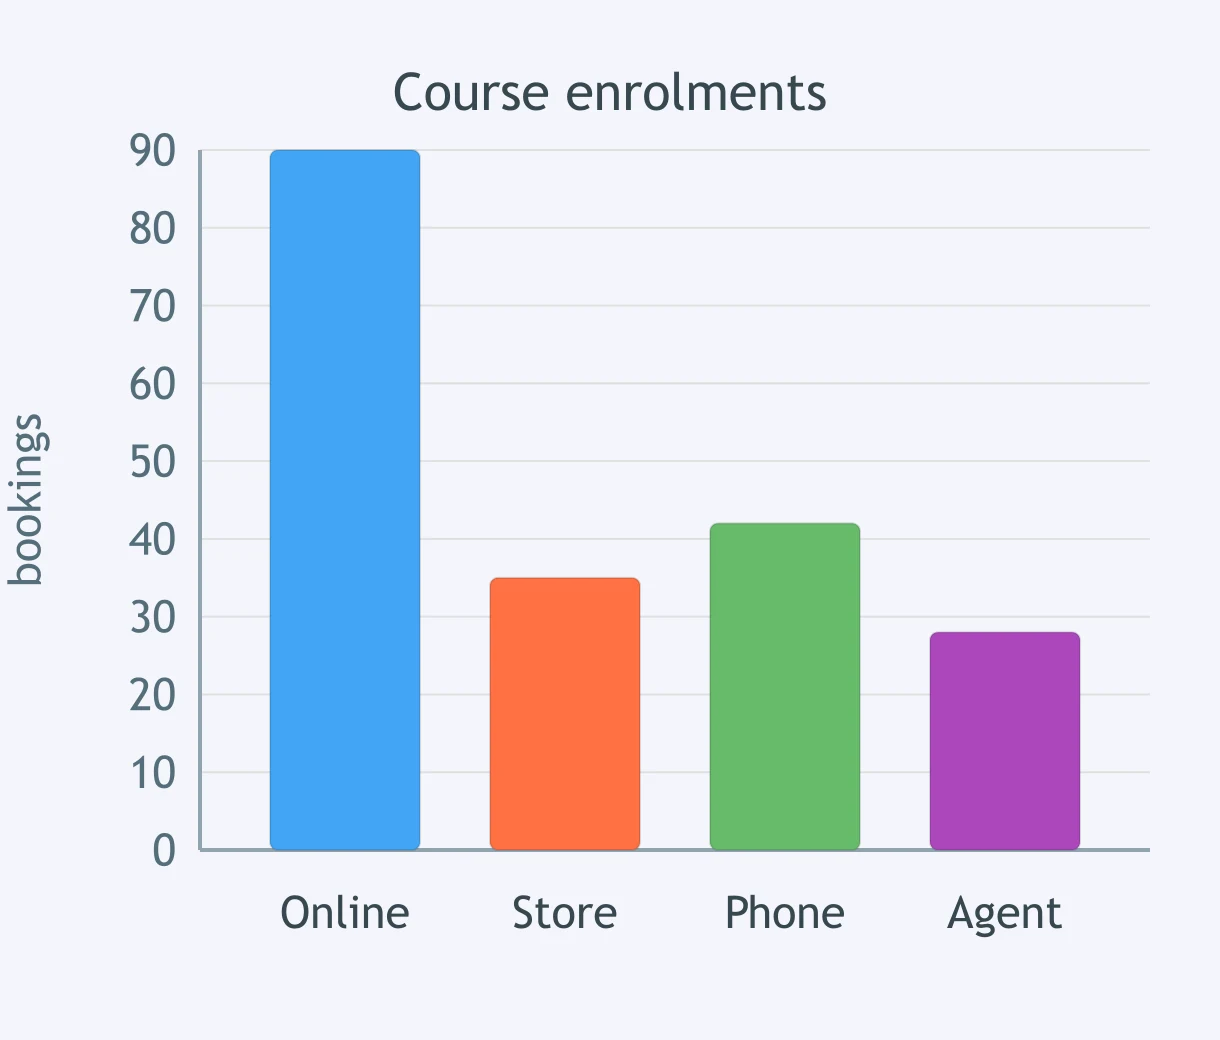
Compare online and store enrolments. Which sentence matches the chart?
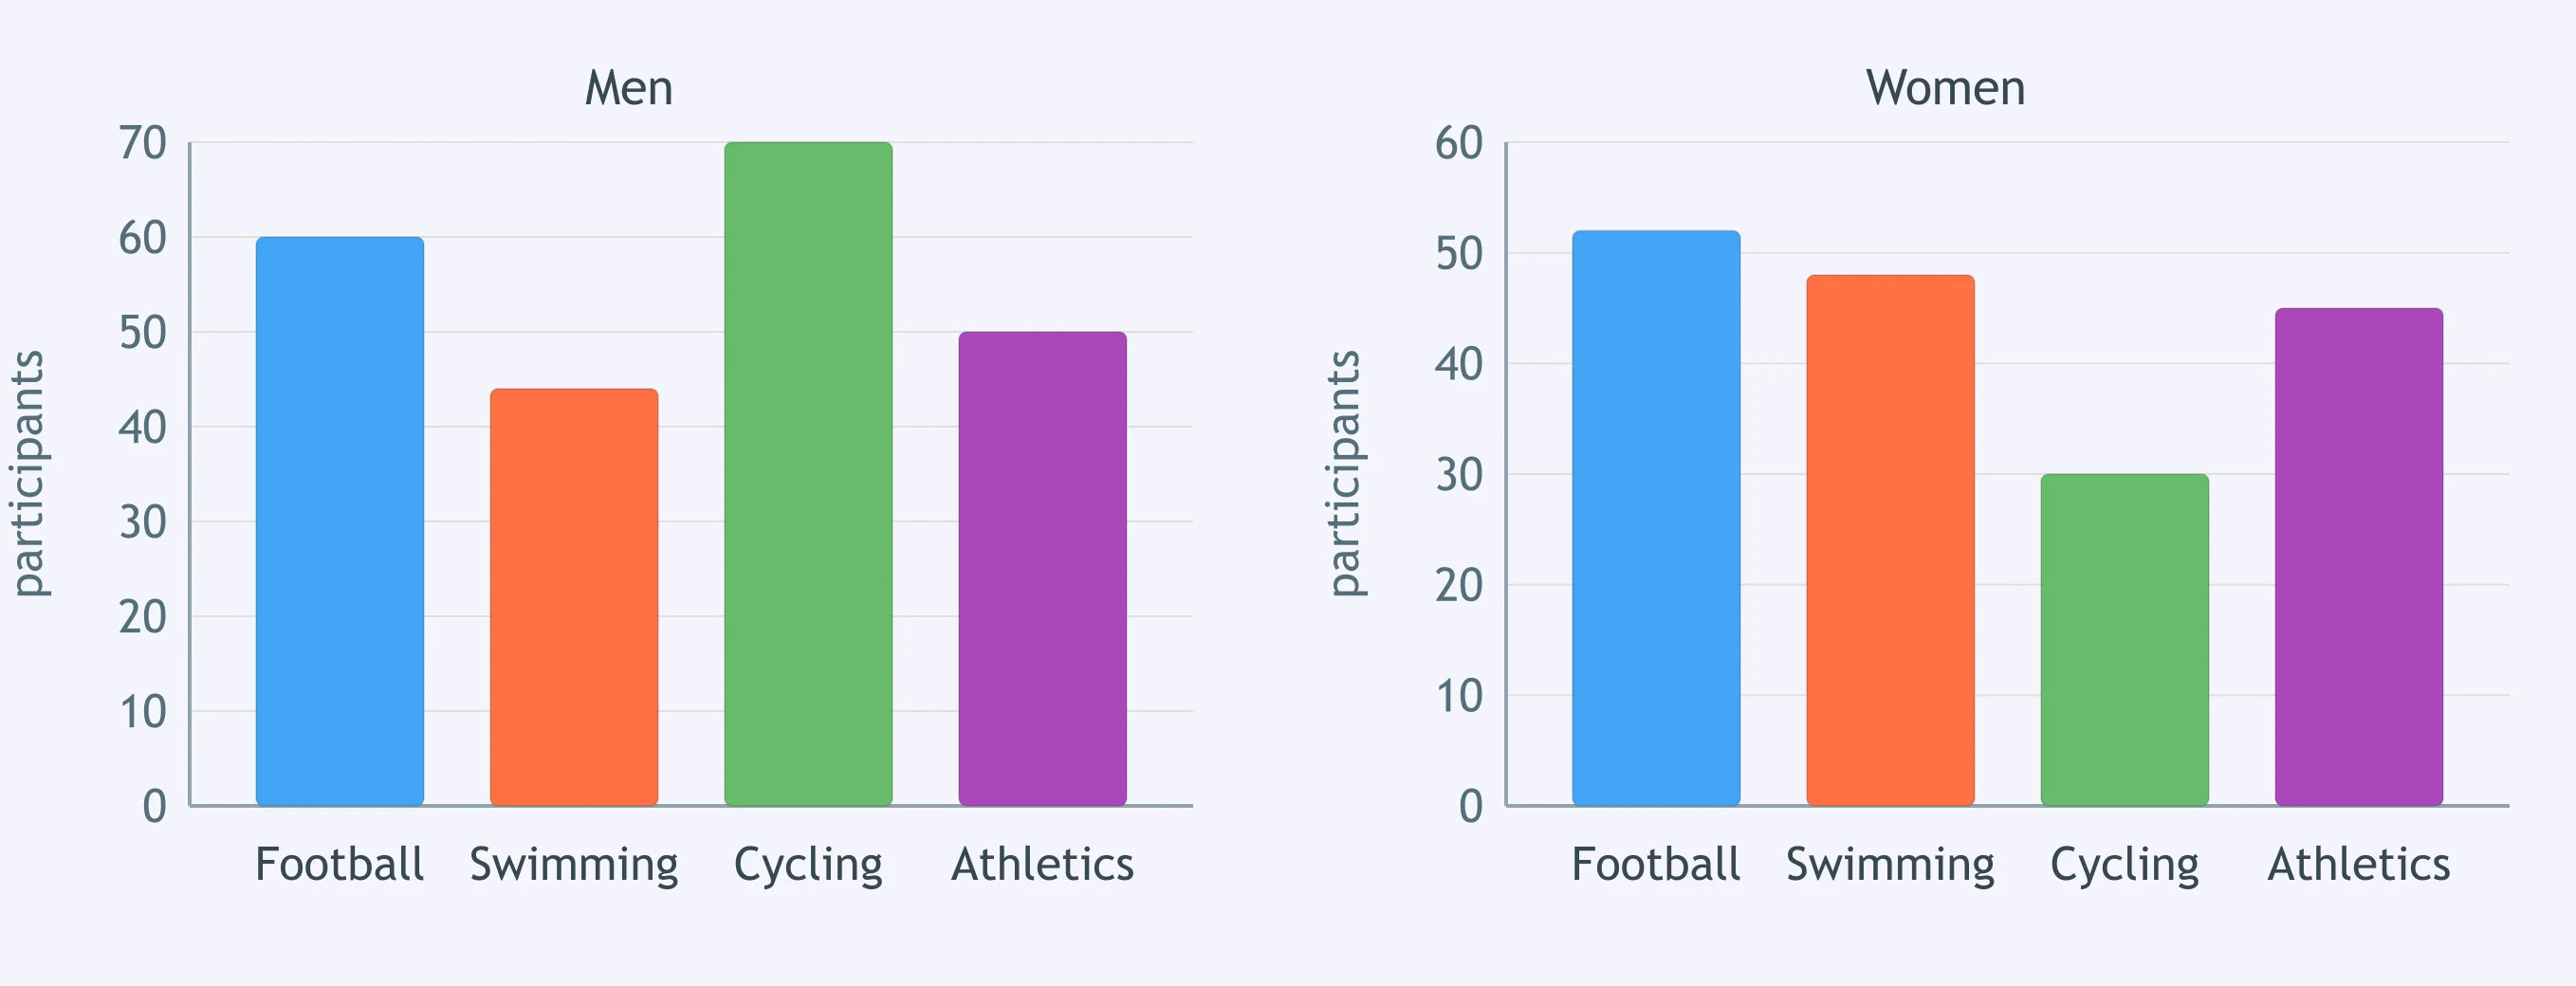
The paired charts show participation by gender. In which sport is the gap between the two bars widest?
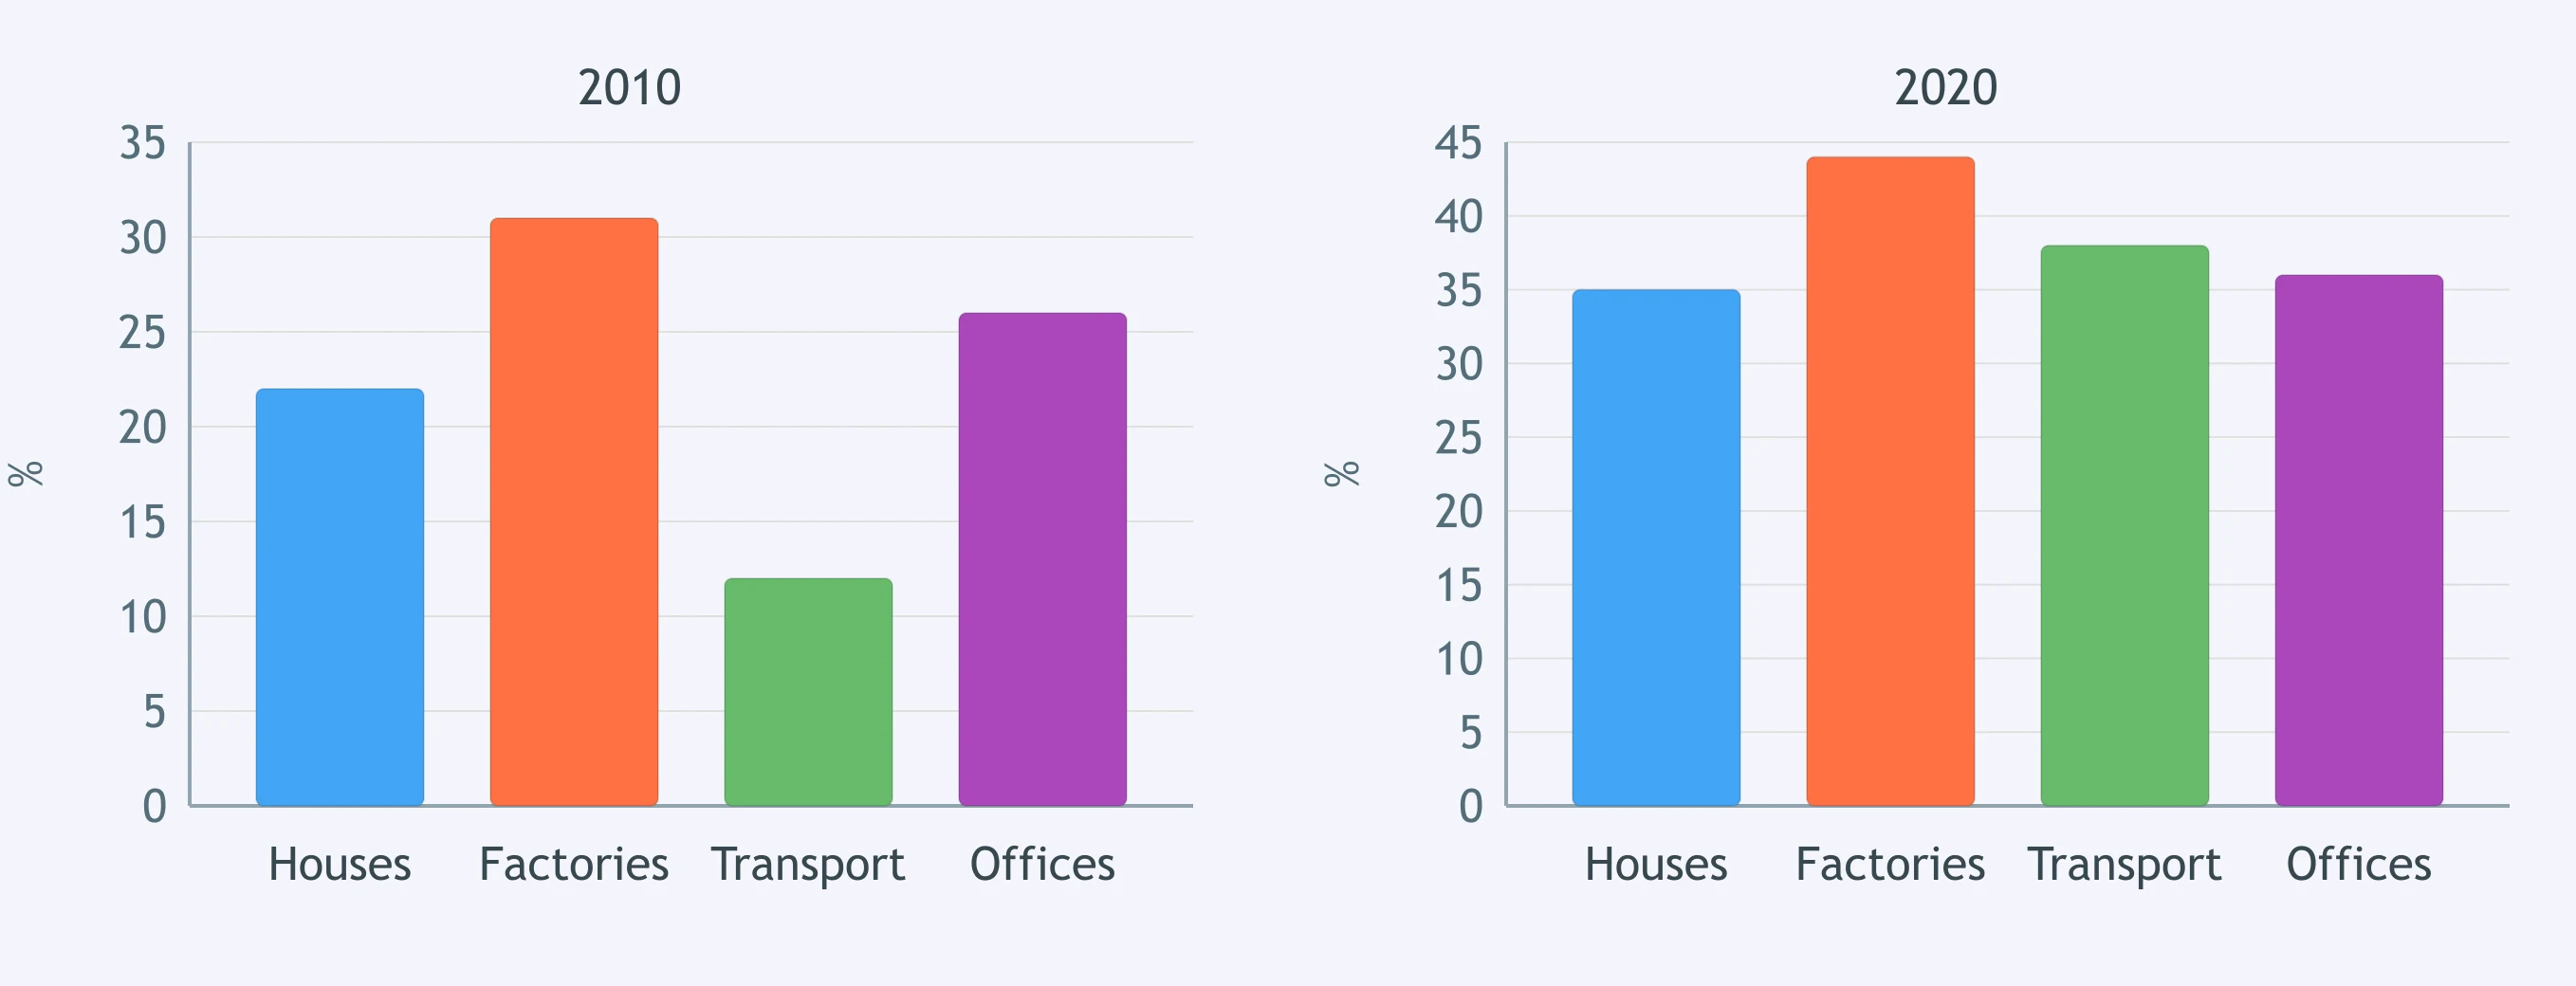
Compare the 2010 and 2020 charts for renewable energy use. Which sector shows the largest increase?
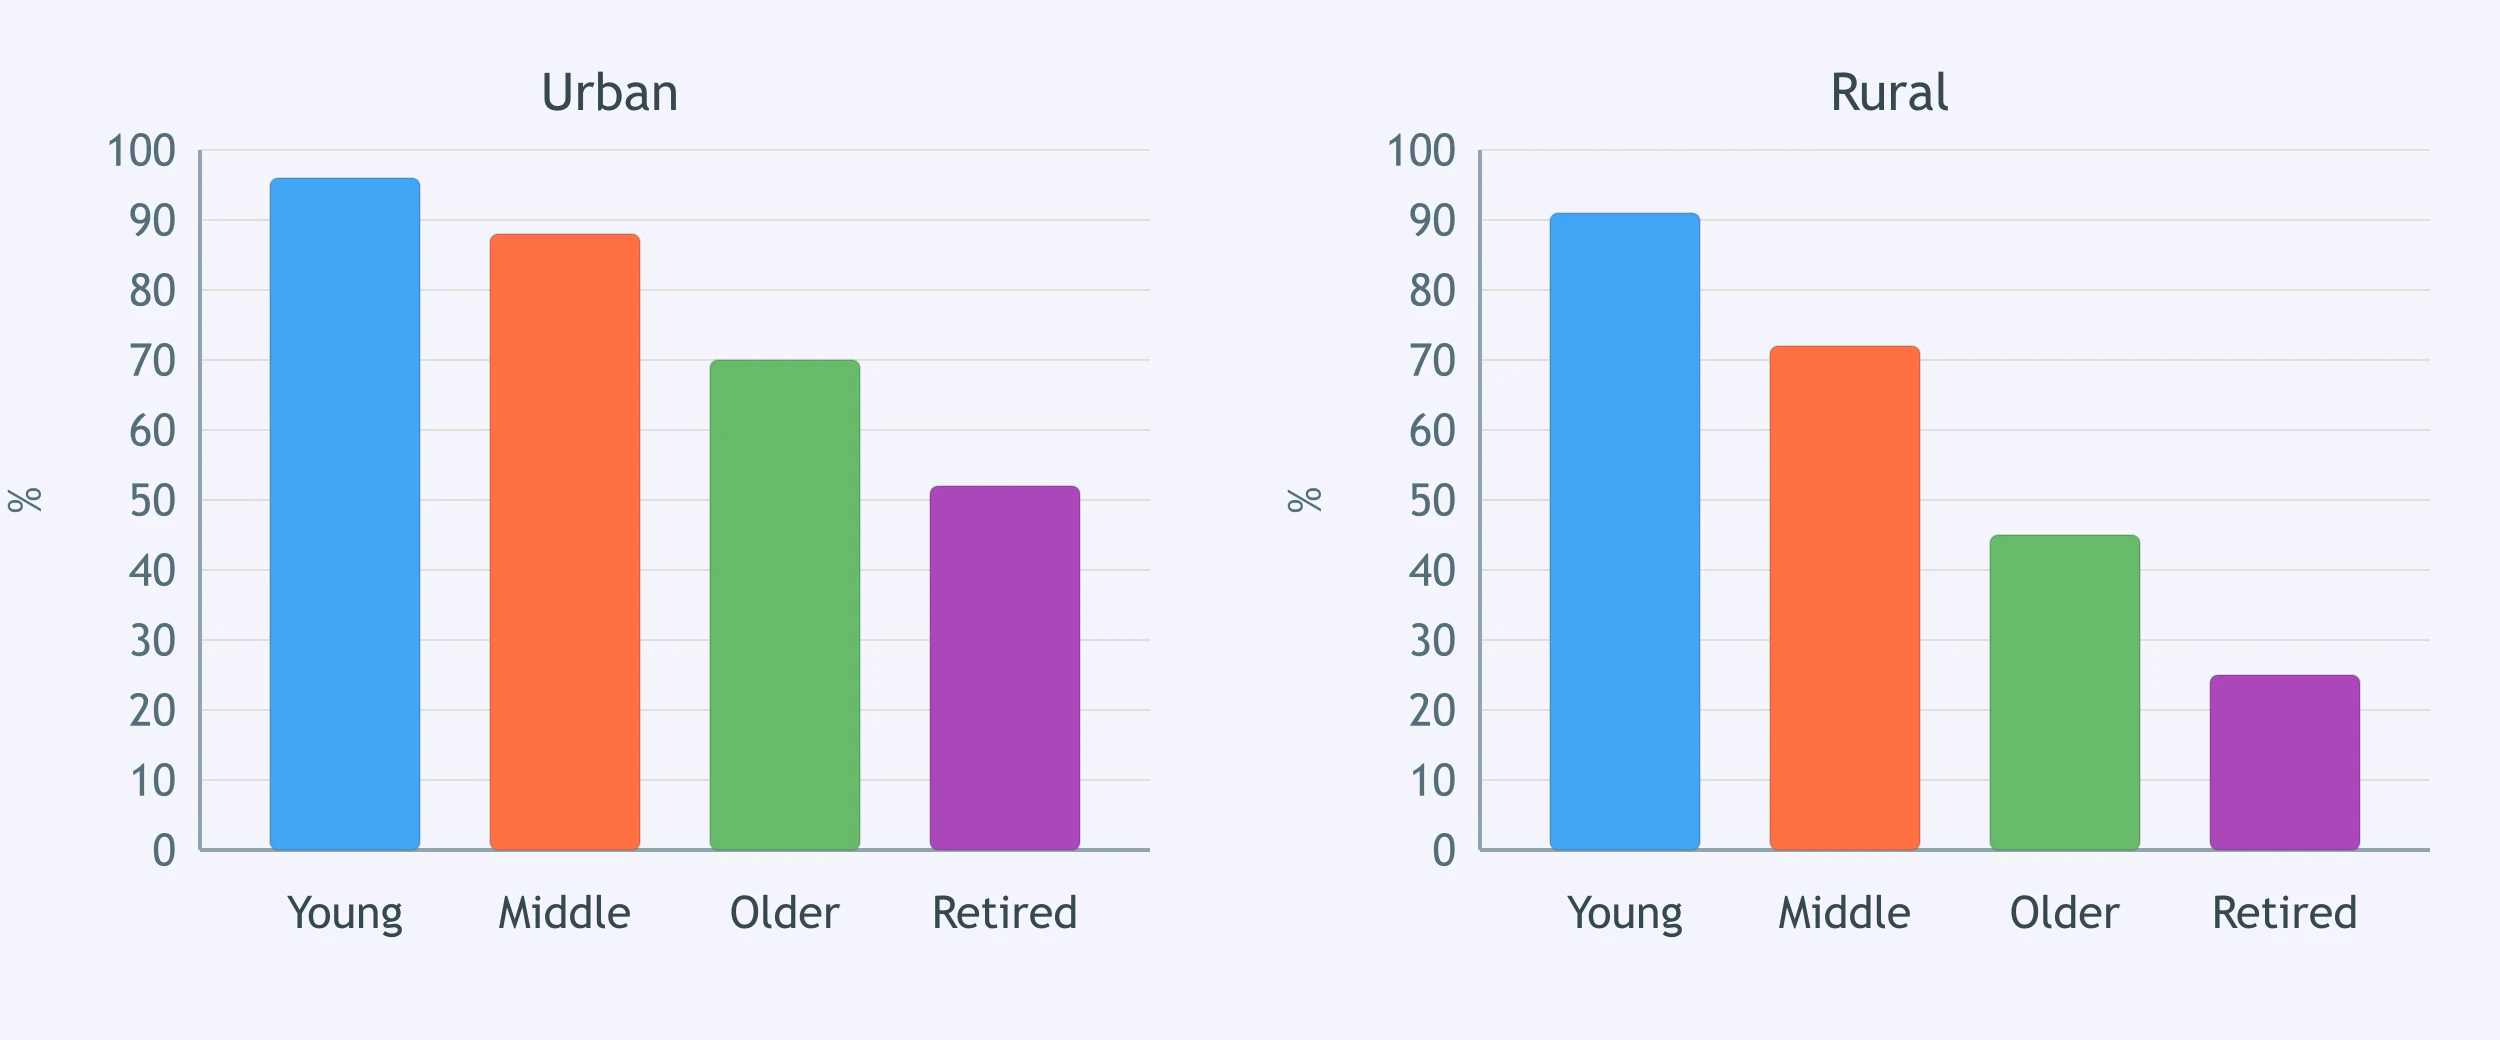
The charts compare internet access in urban and rural areas. Which age group has the smallest urban-rural gap?
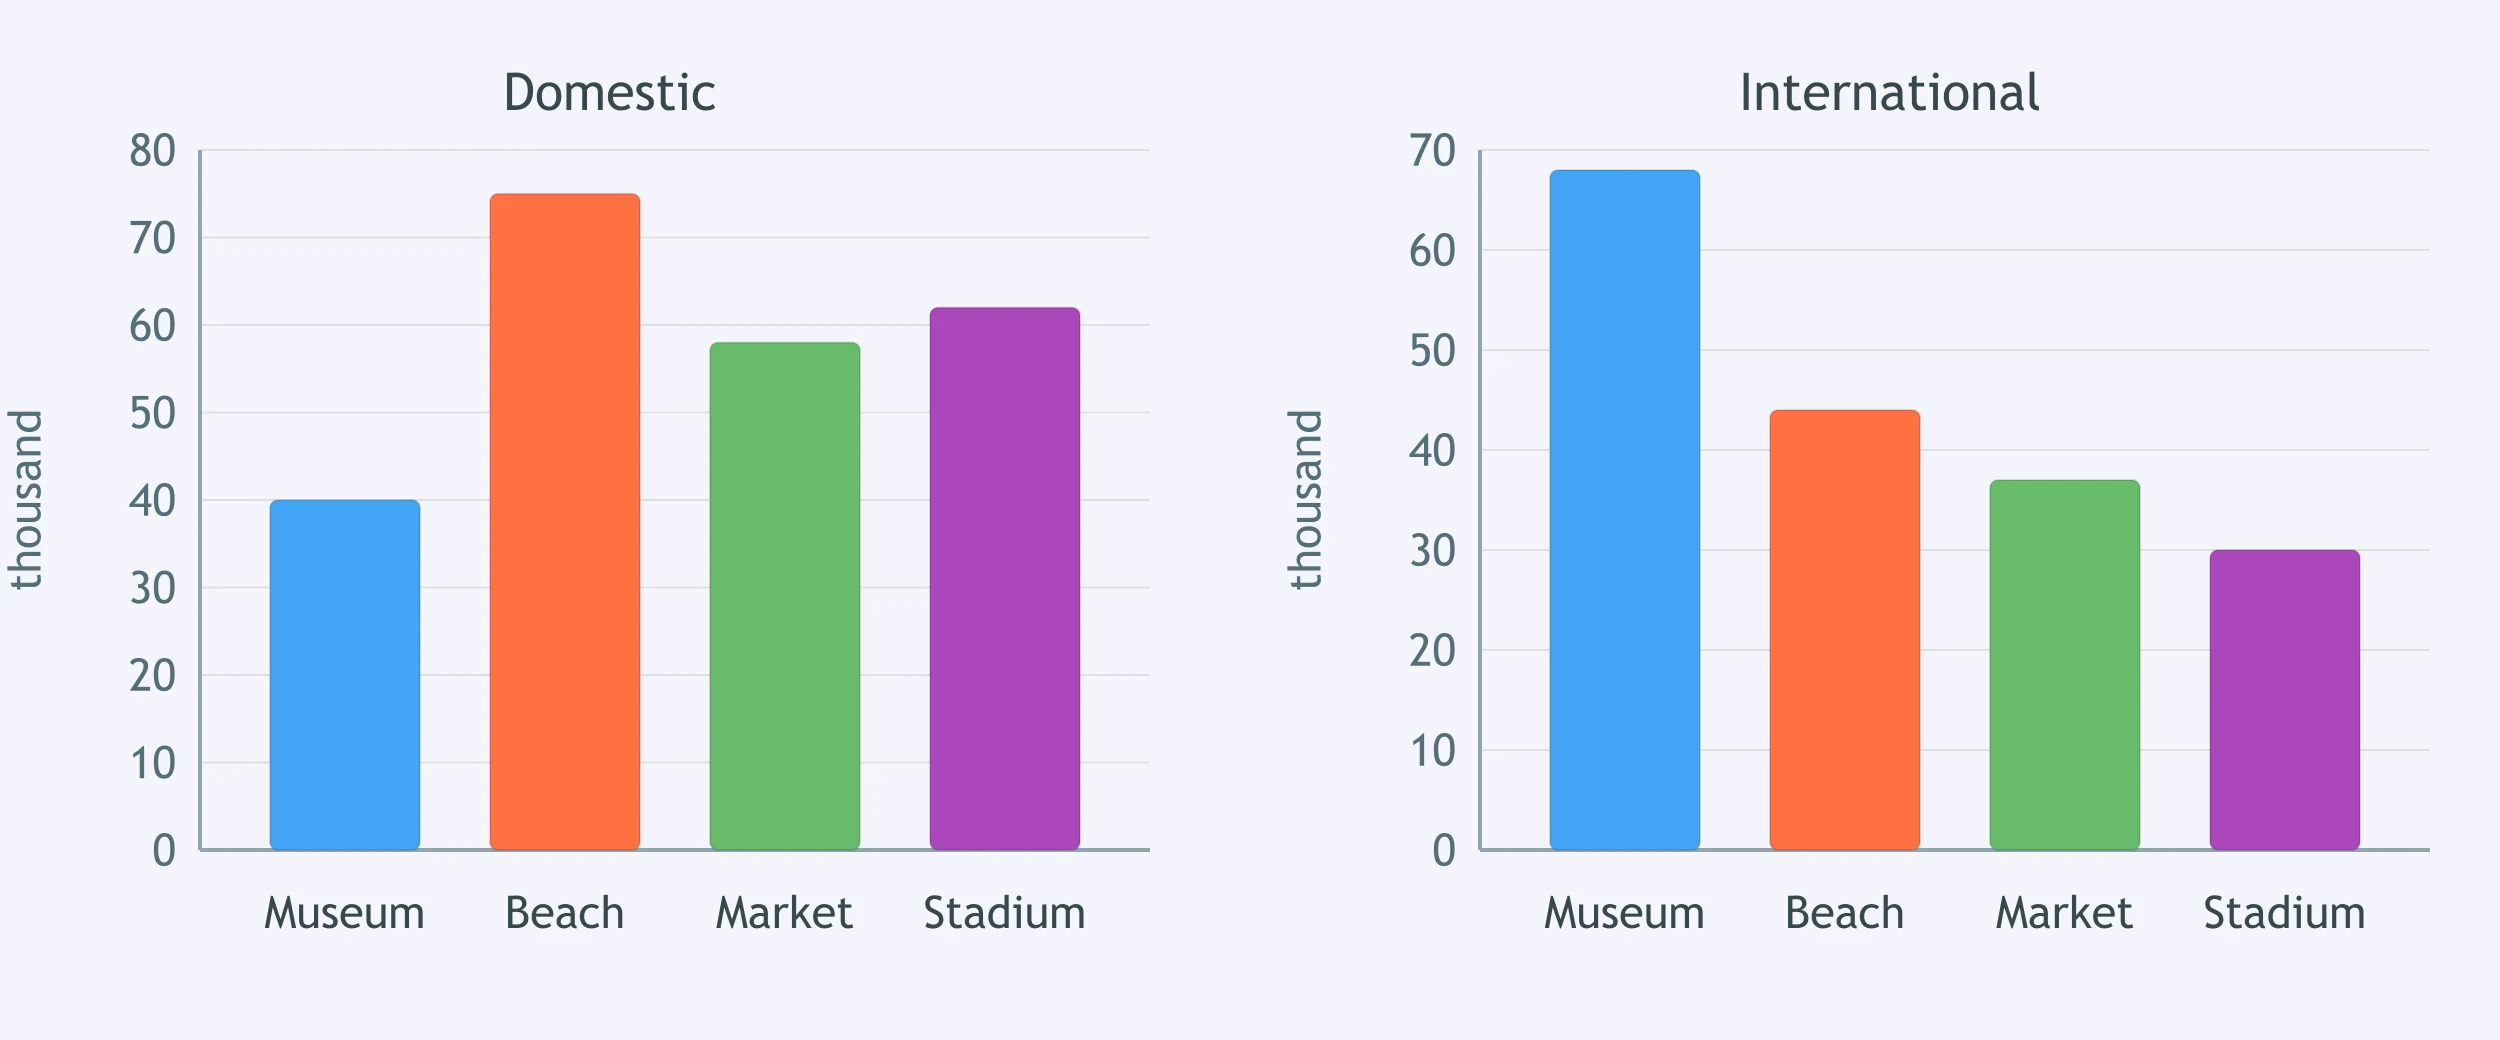
Compare domestic and international visitors across the sites. Where do international visitors outnumber domestic visitors?
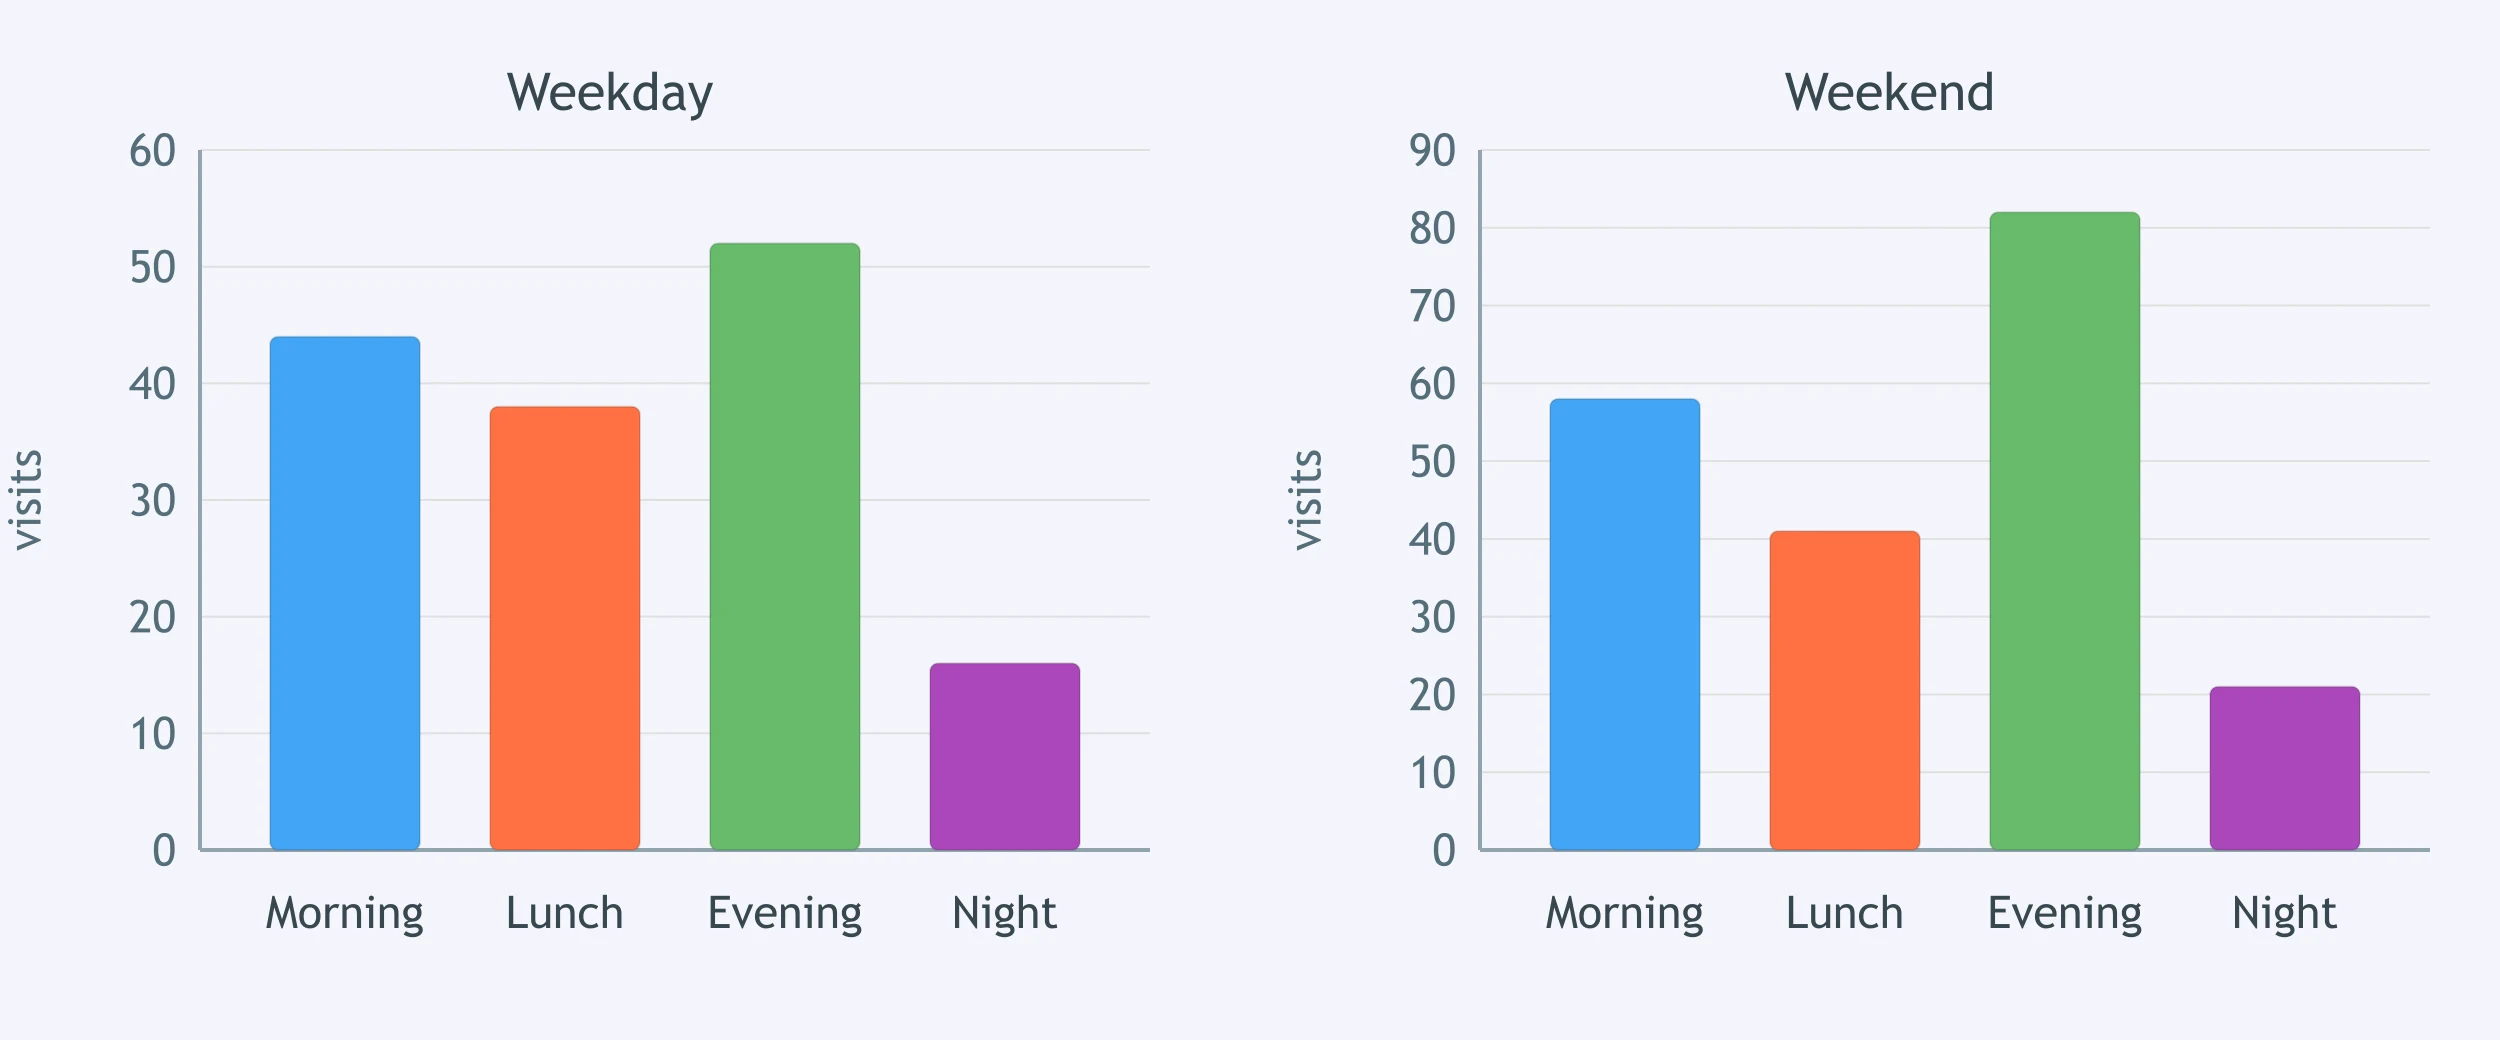
The charts show gym attendance on weekdays and weekends. Which time slot had the largest weekend advantage?
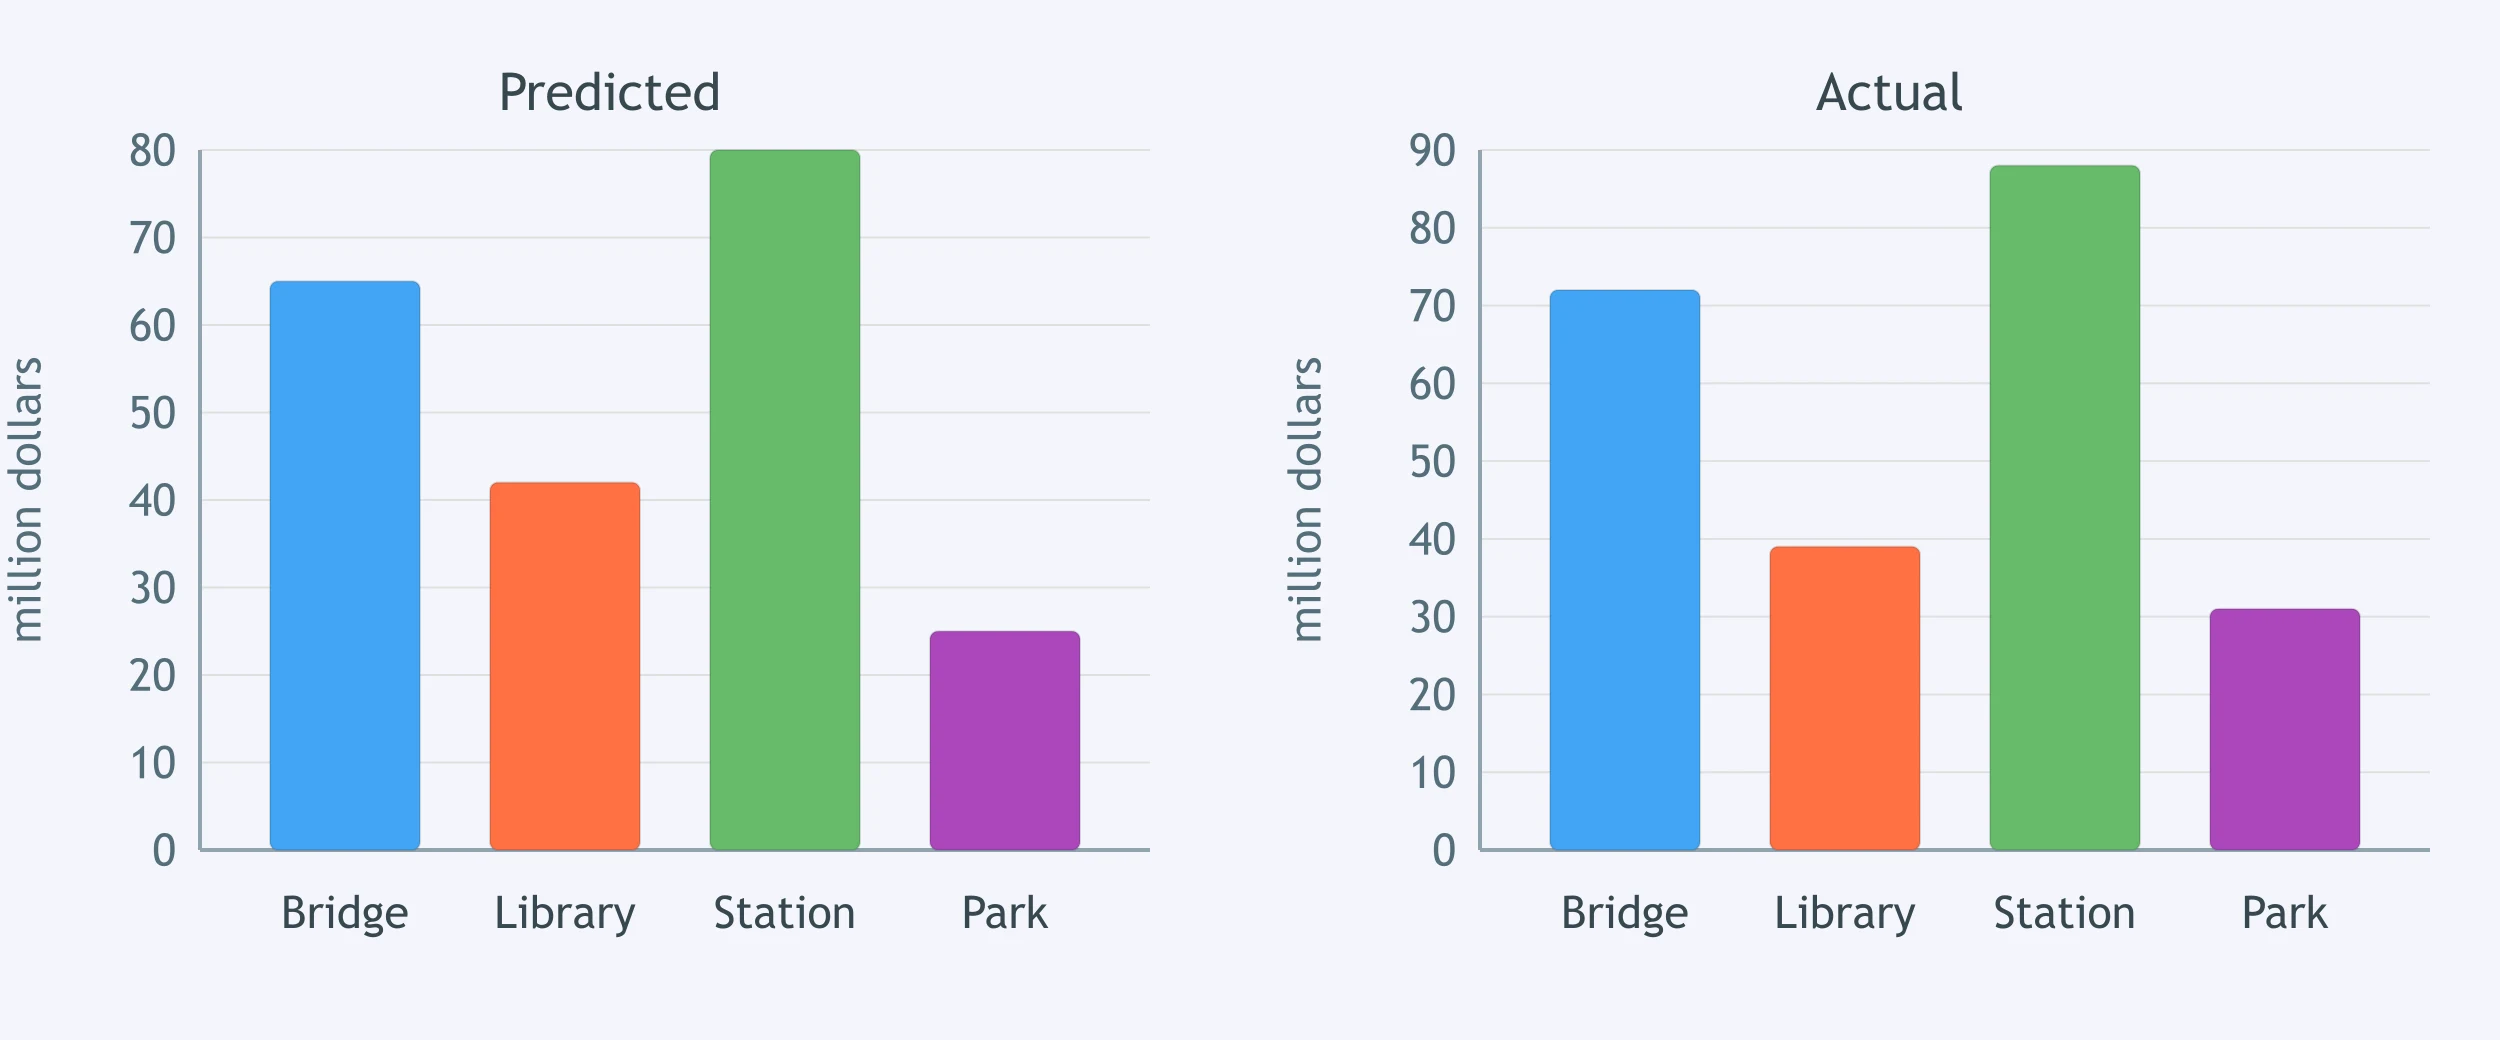
The charts compare predicted and actual project costs. For which project was actual spending lower than predicted?
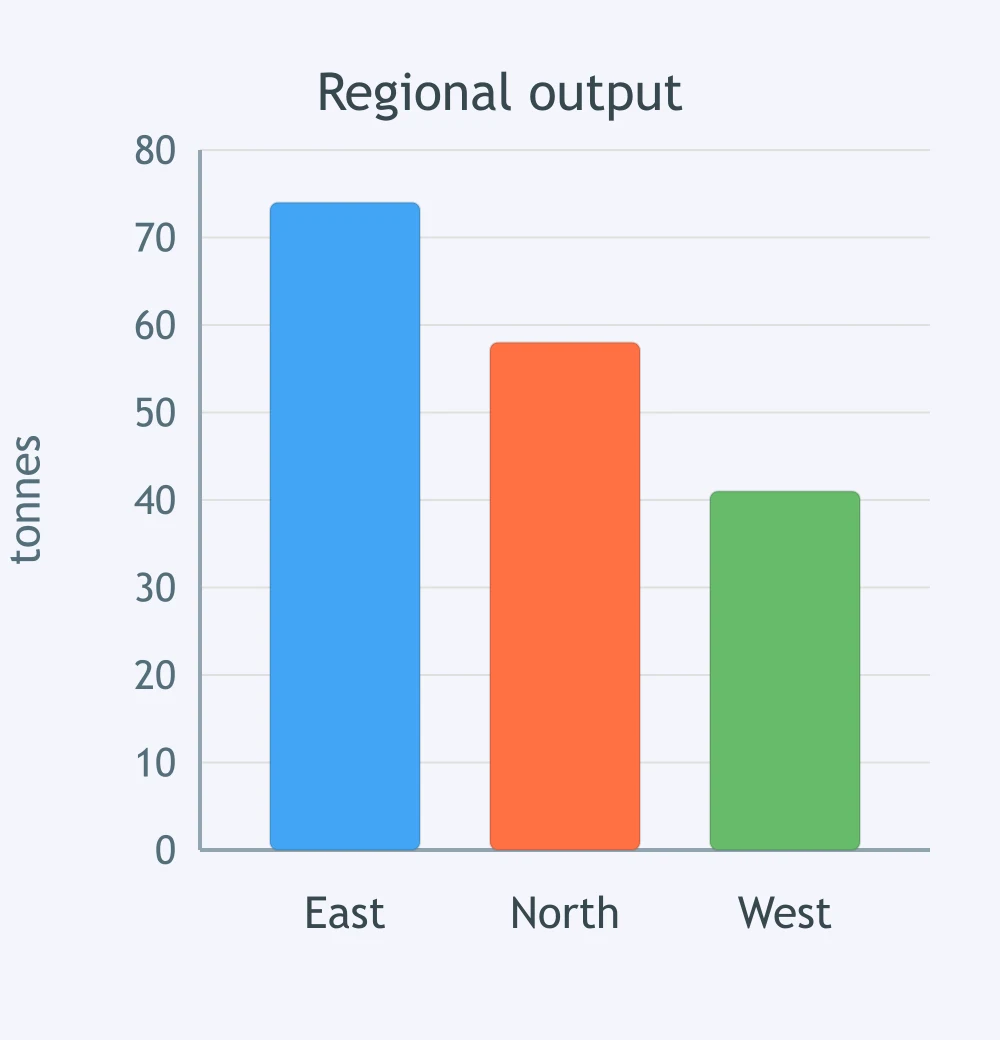
Rank the three regions by output. Which sentence matches the columns?
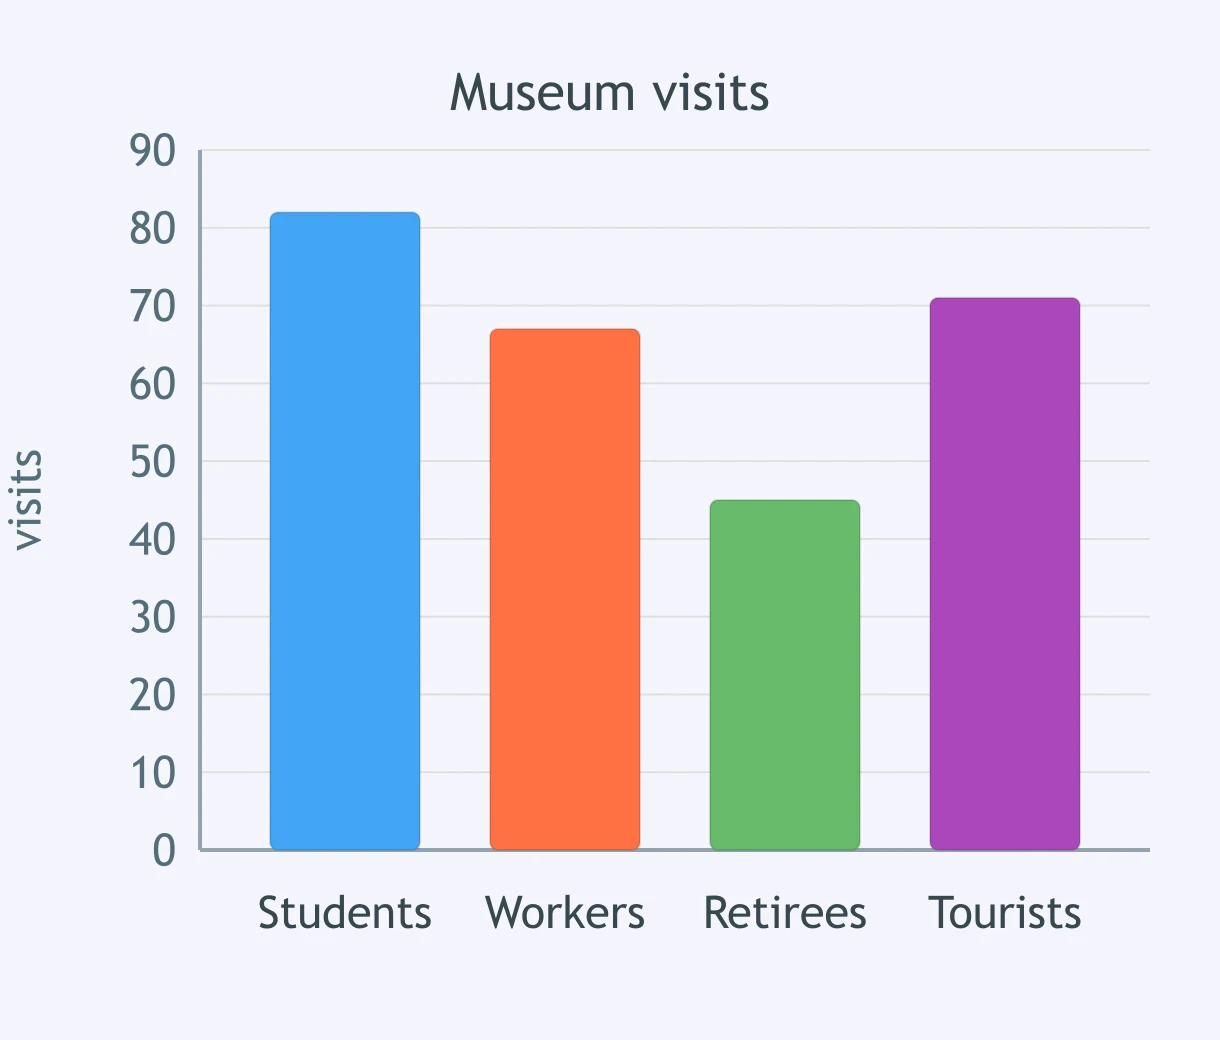
Choose the ranking that fits the museum visits chart from highest to lowest.
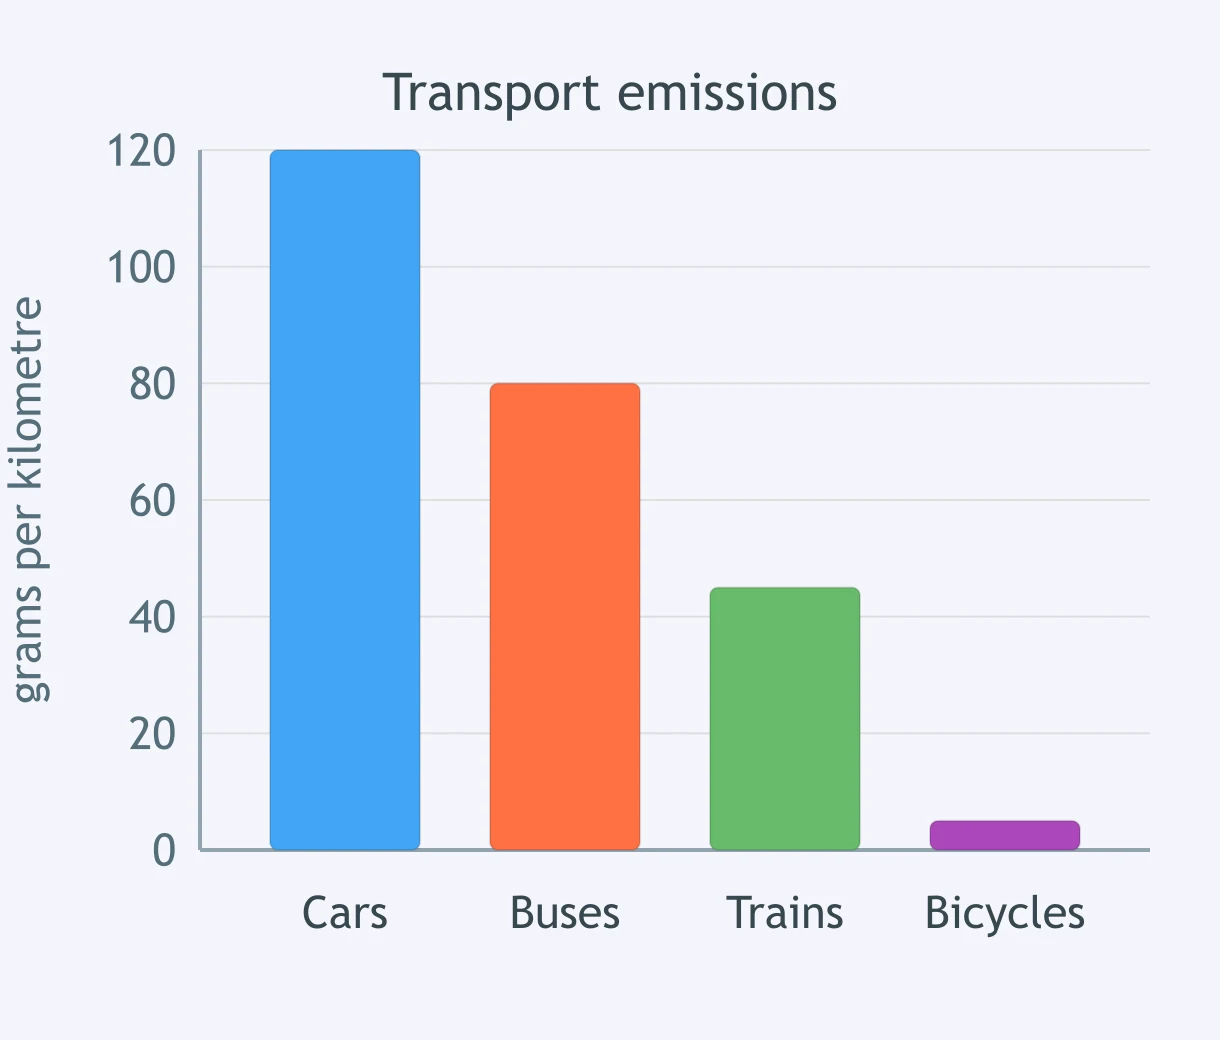
Which ranking correctly summarises transport emissions from highest to lowest?
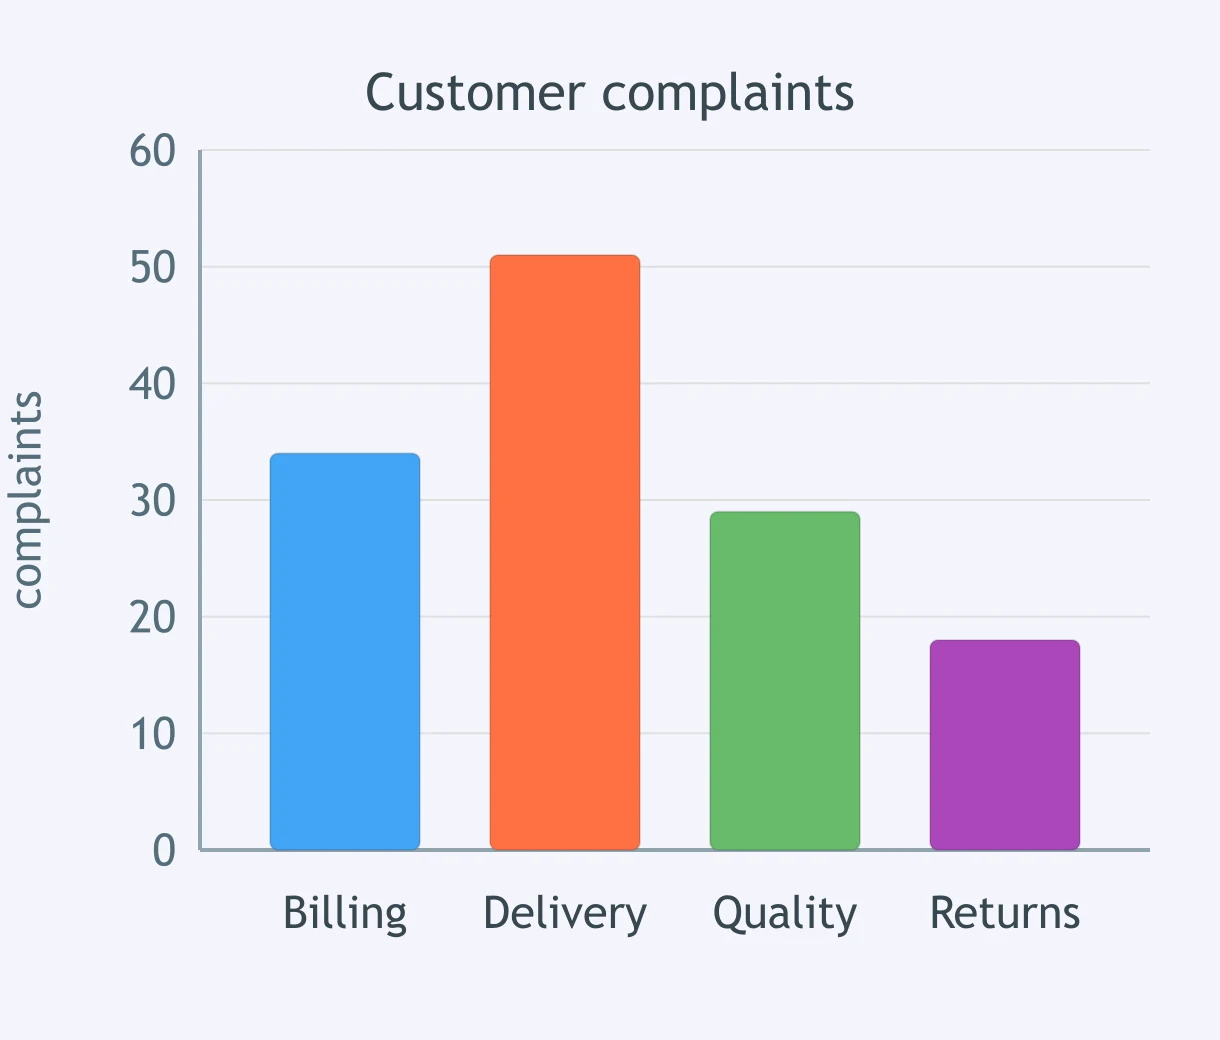
Use one sentence to rank the complaint categories. Which option matches the chart?
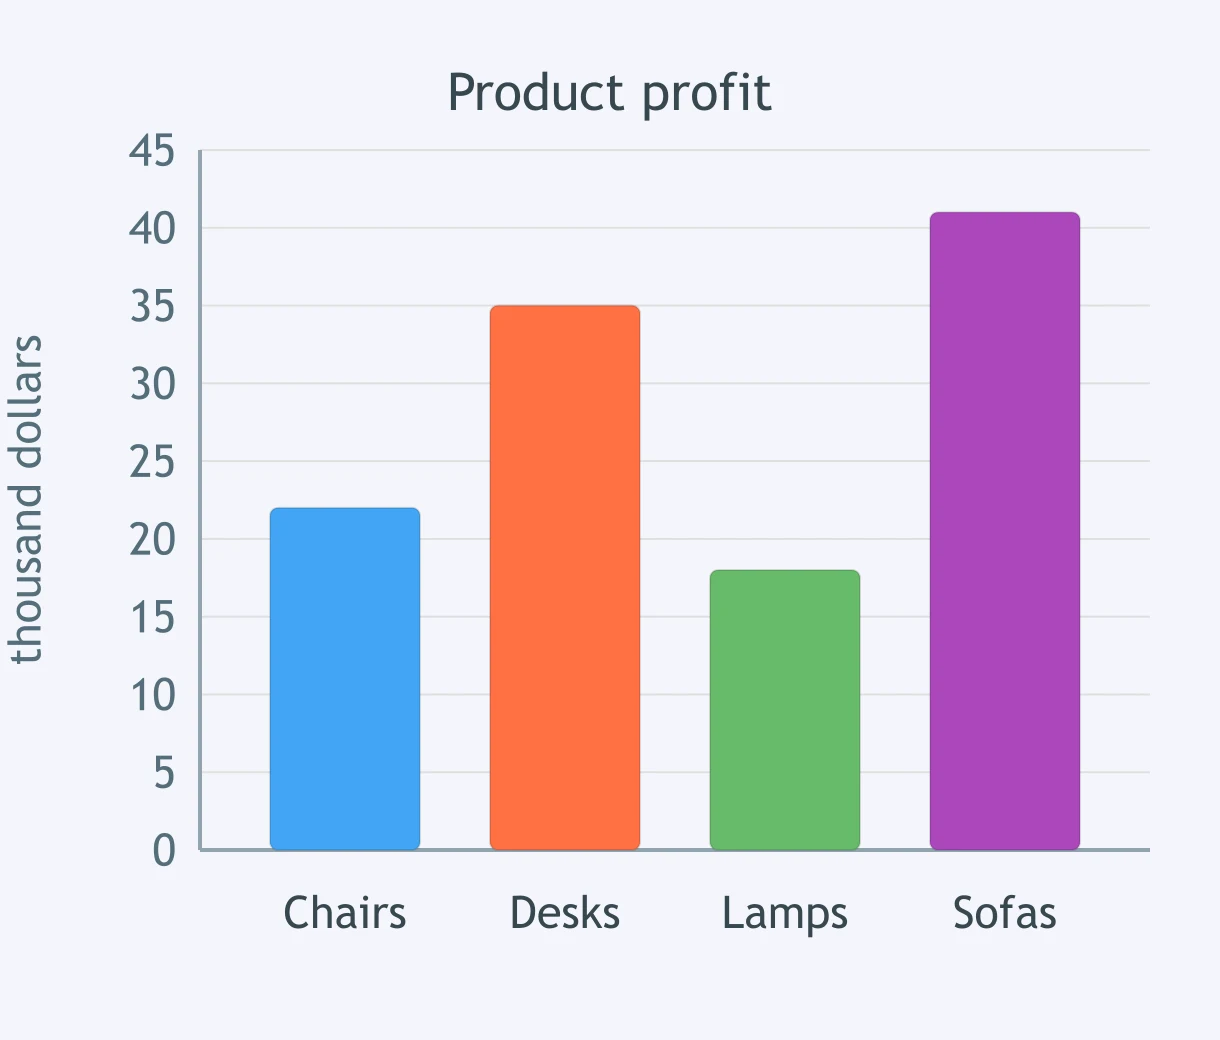
Which sentence ranks product profit from highest to lowest?
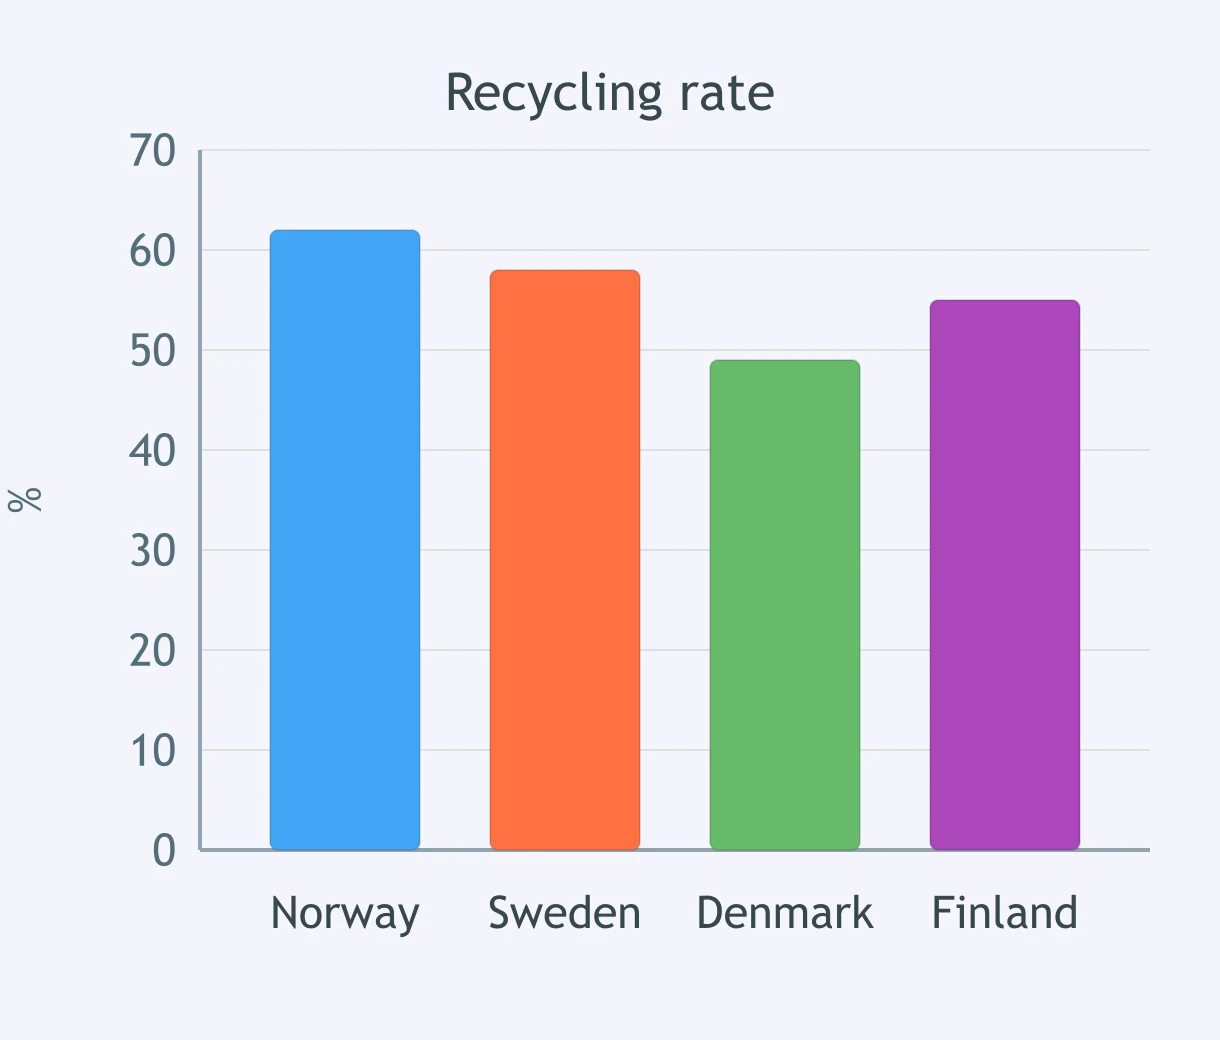
Which ranking of recycling rates matches the columns?
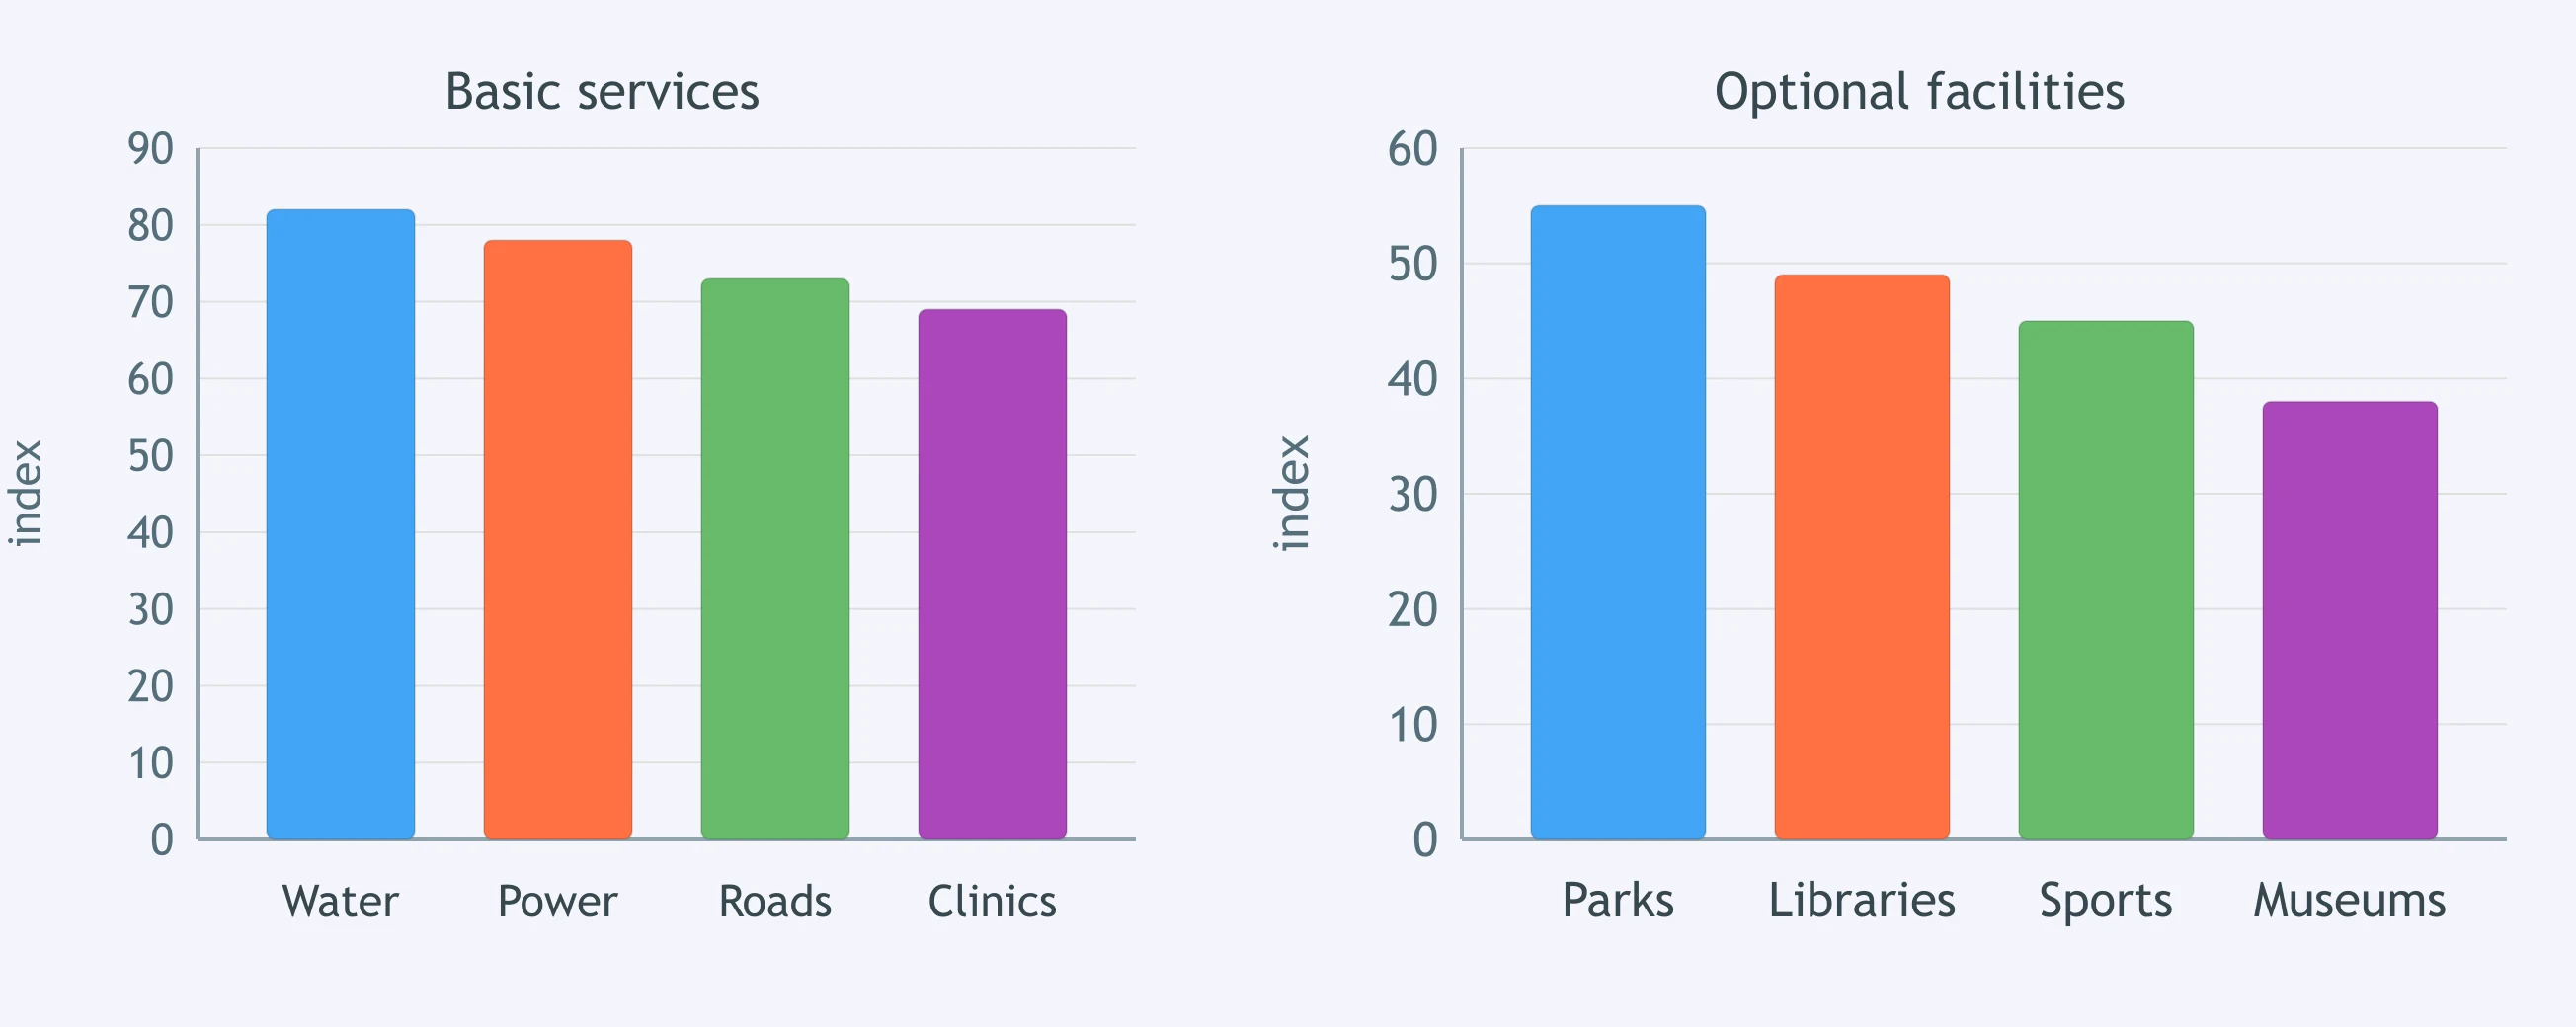
You need one overview sentence for the two charts. Which option groups the columns accurately?
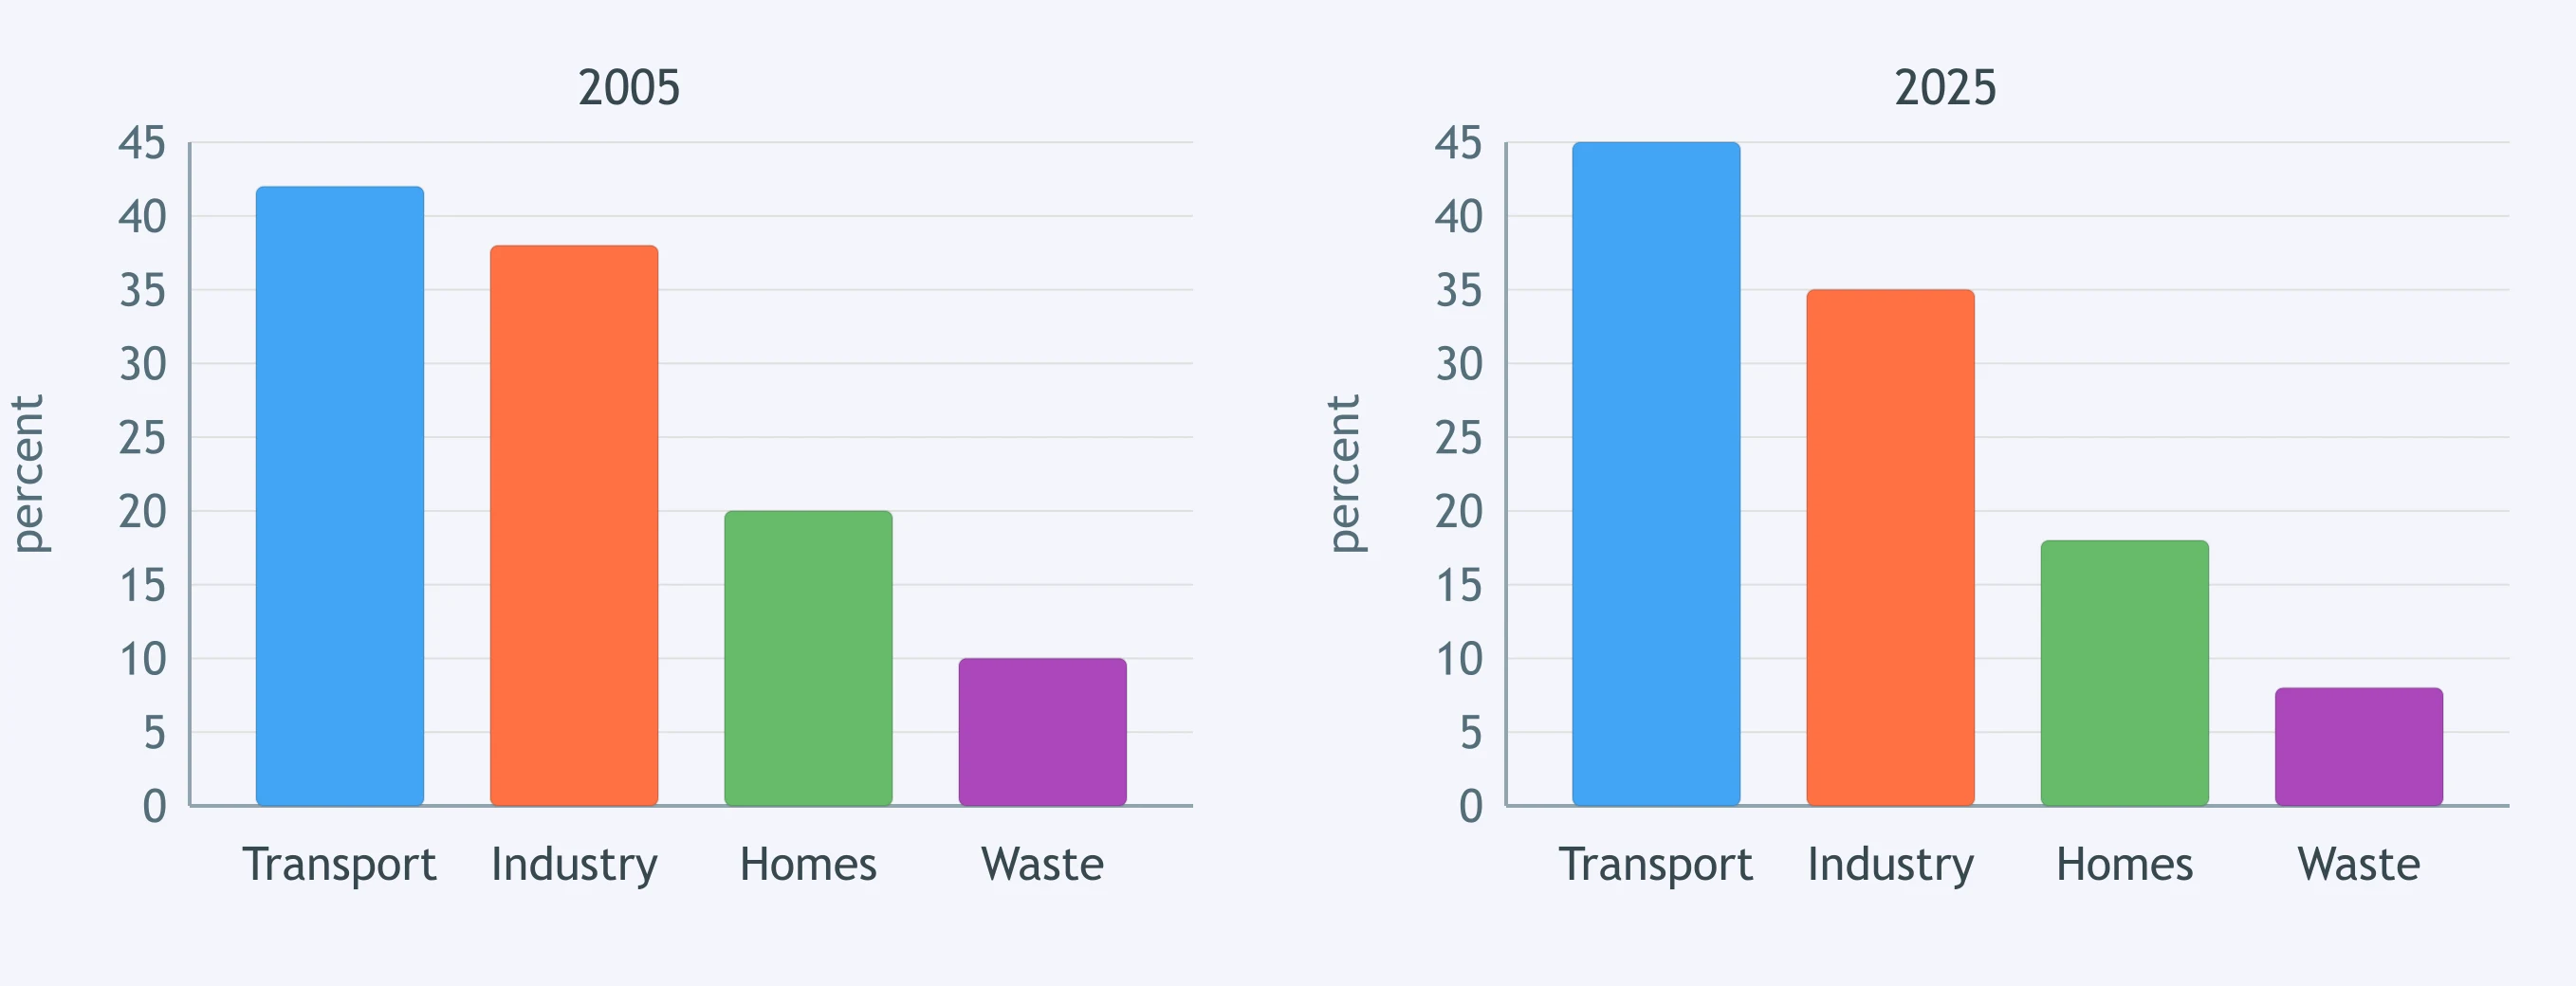
Choose the best overview of the emissions charts without listing every source.
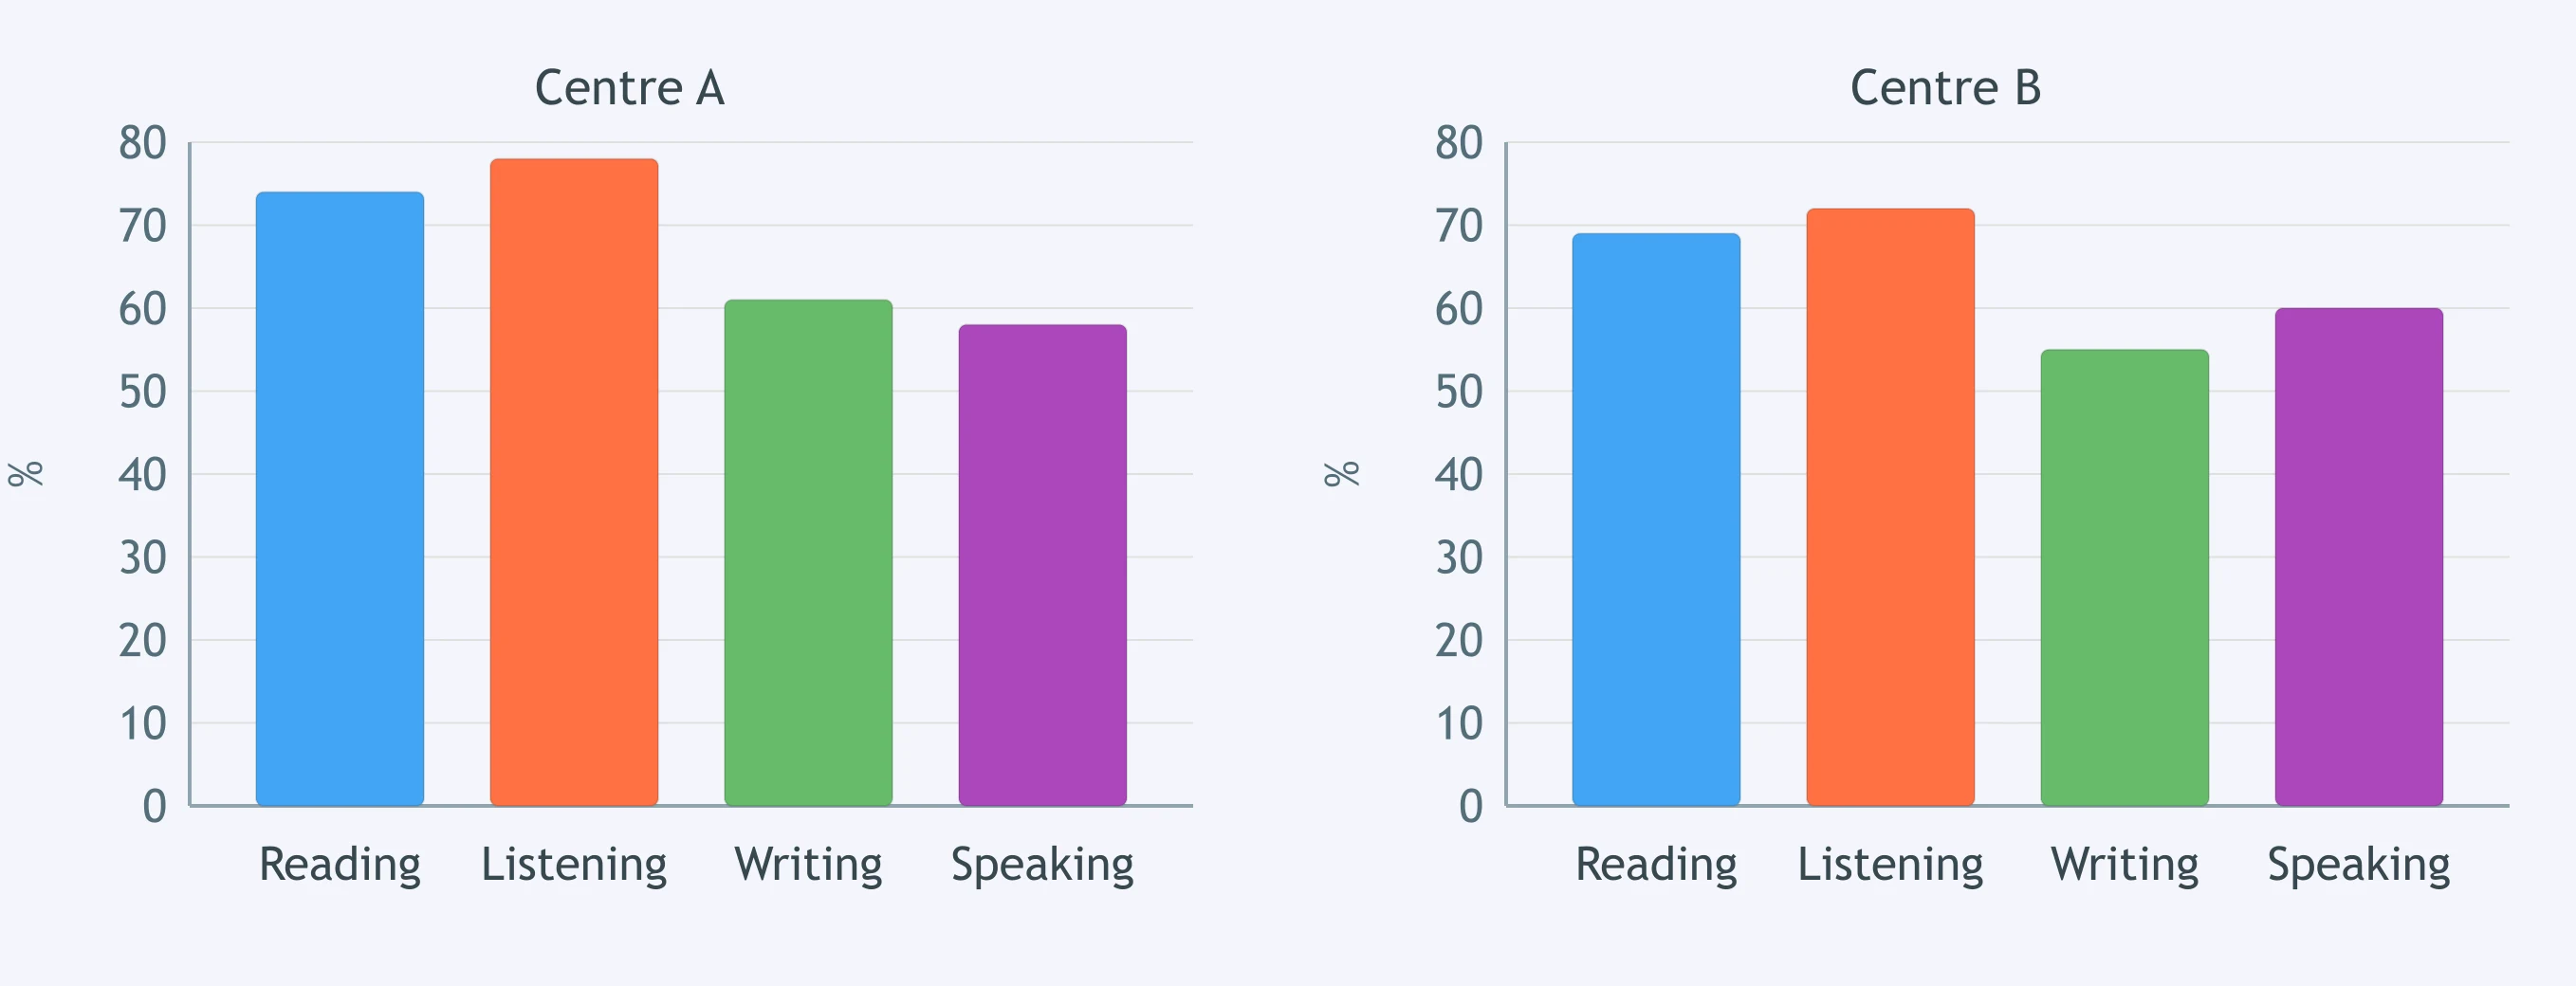
The charts compare skill scores in two centres. Which overview groups the results accurately?
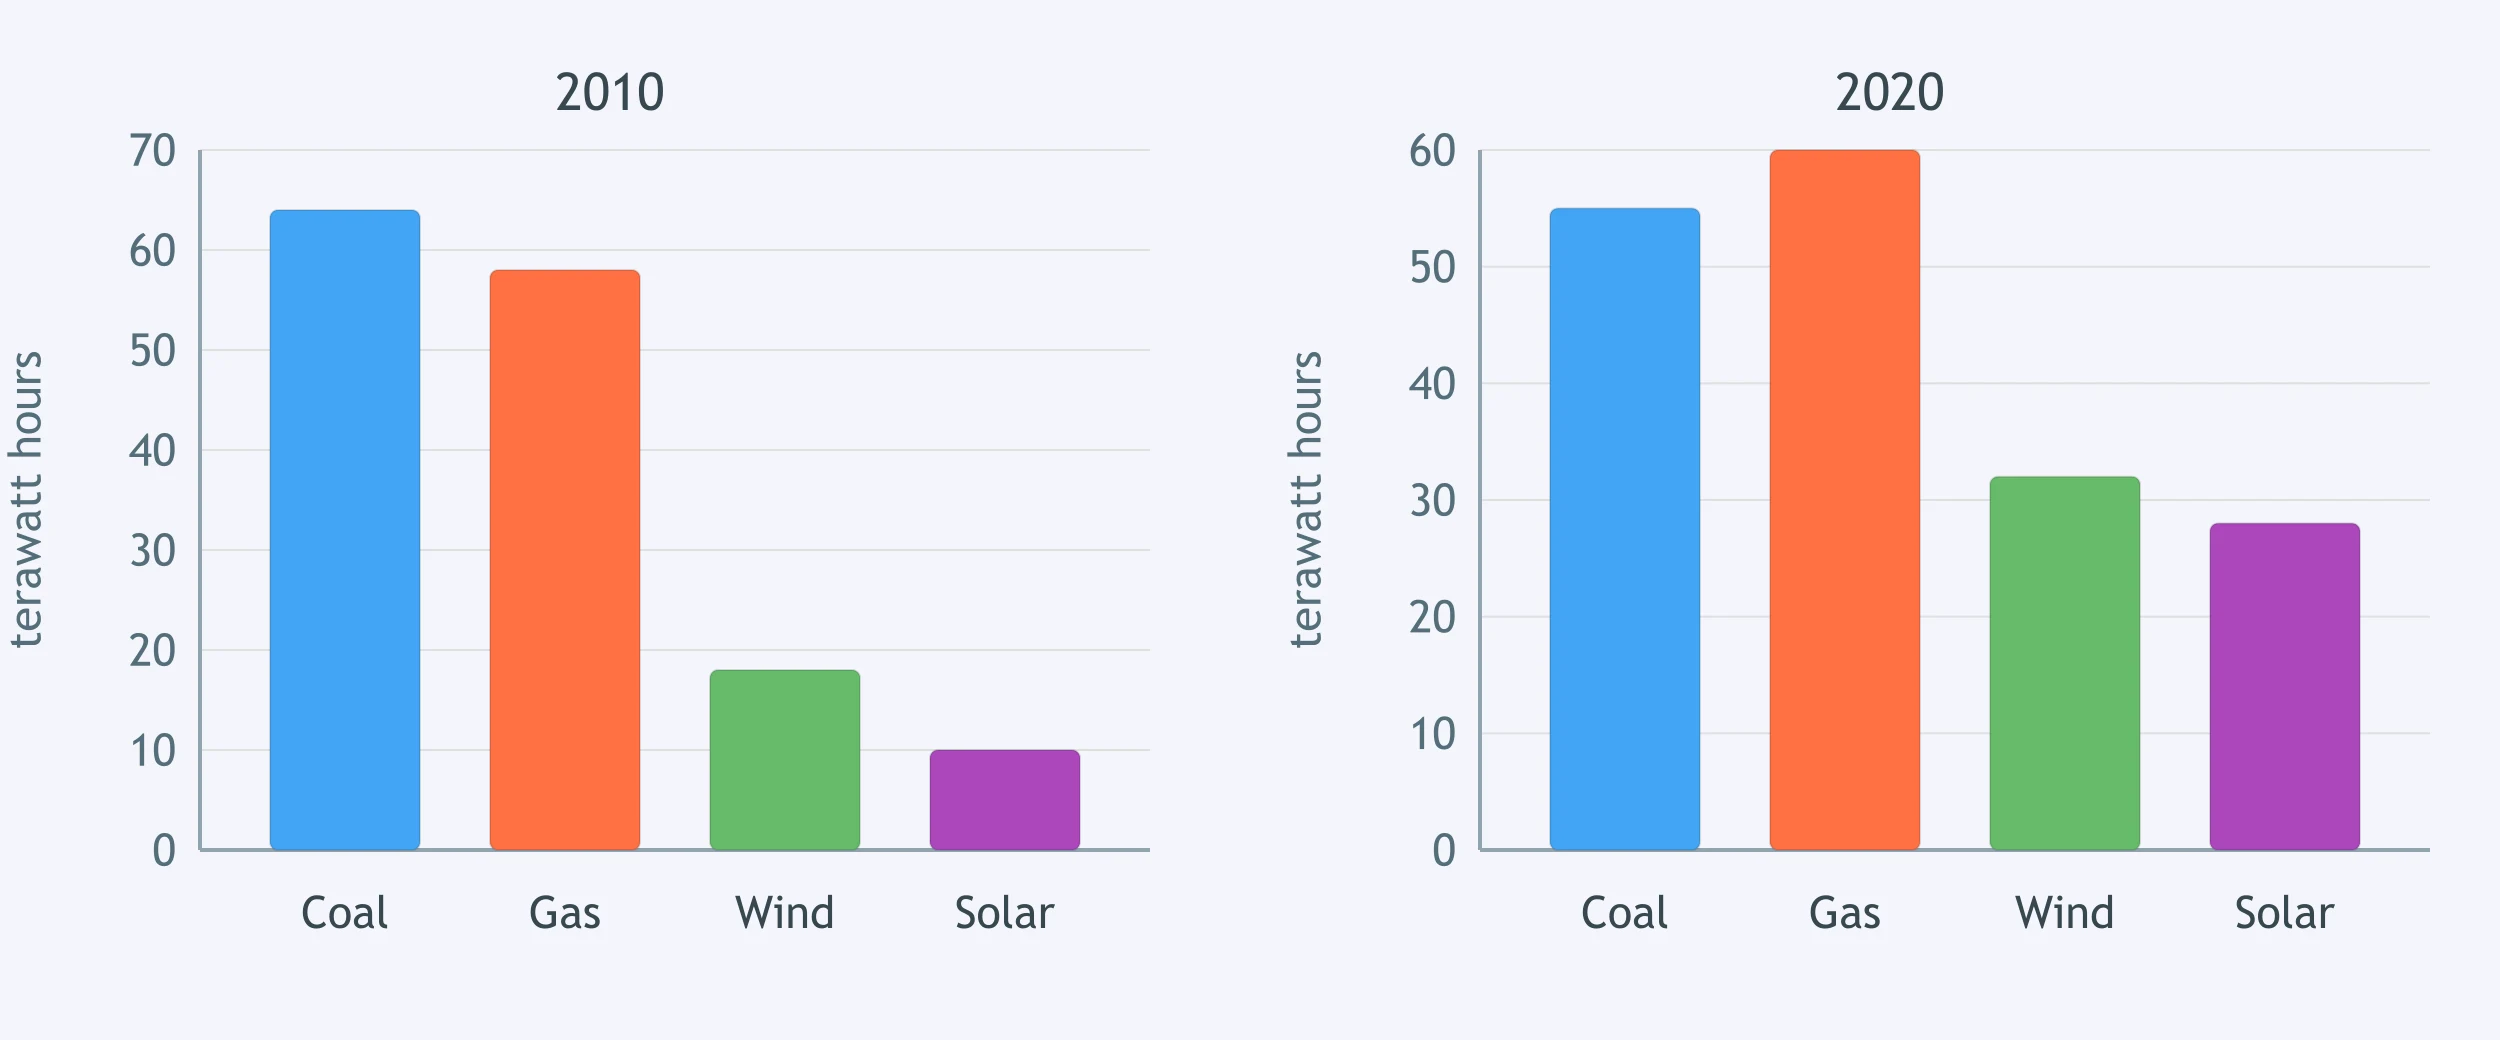
Which overview best groups the energy sources shown in the two charts?
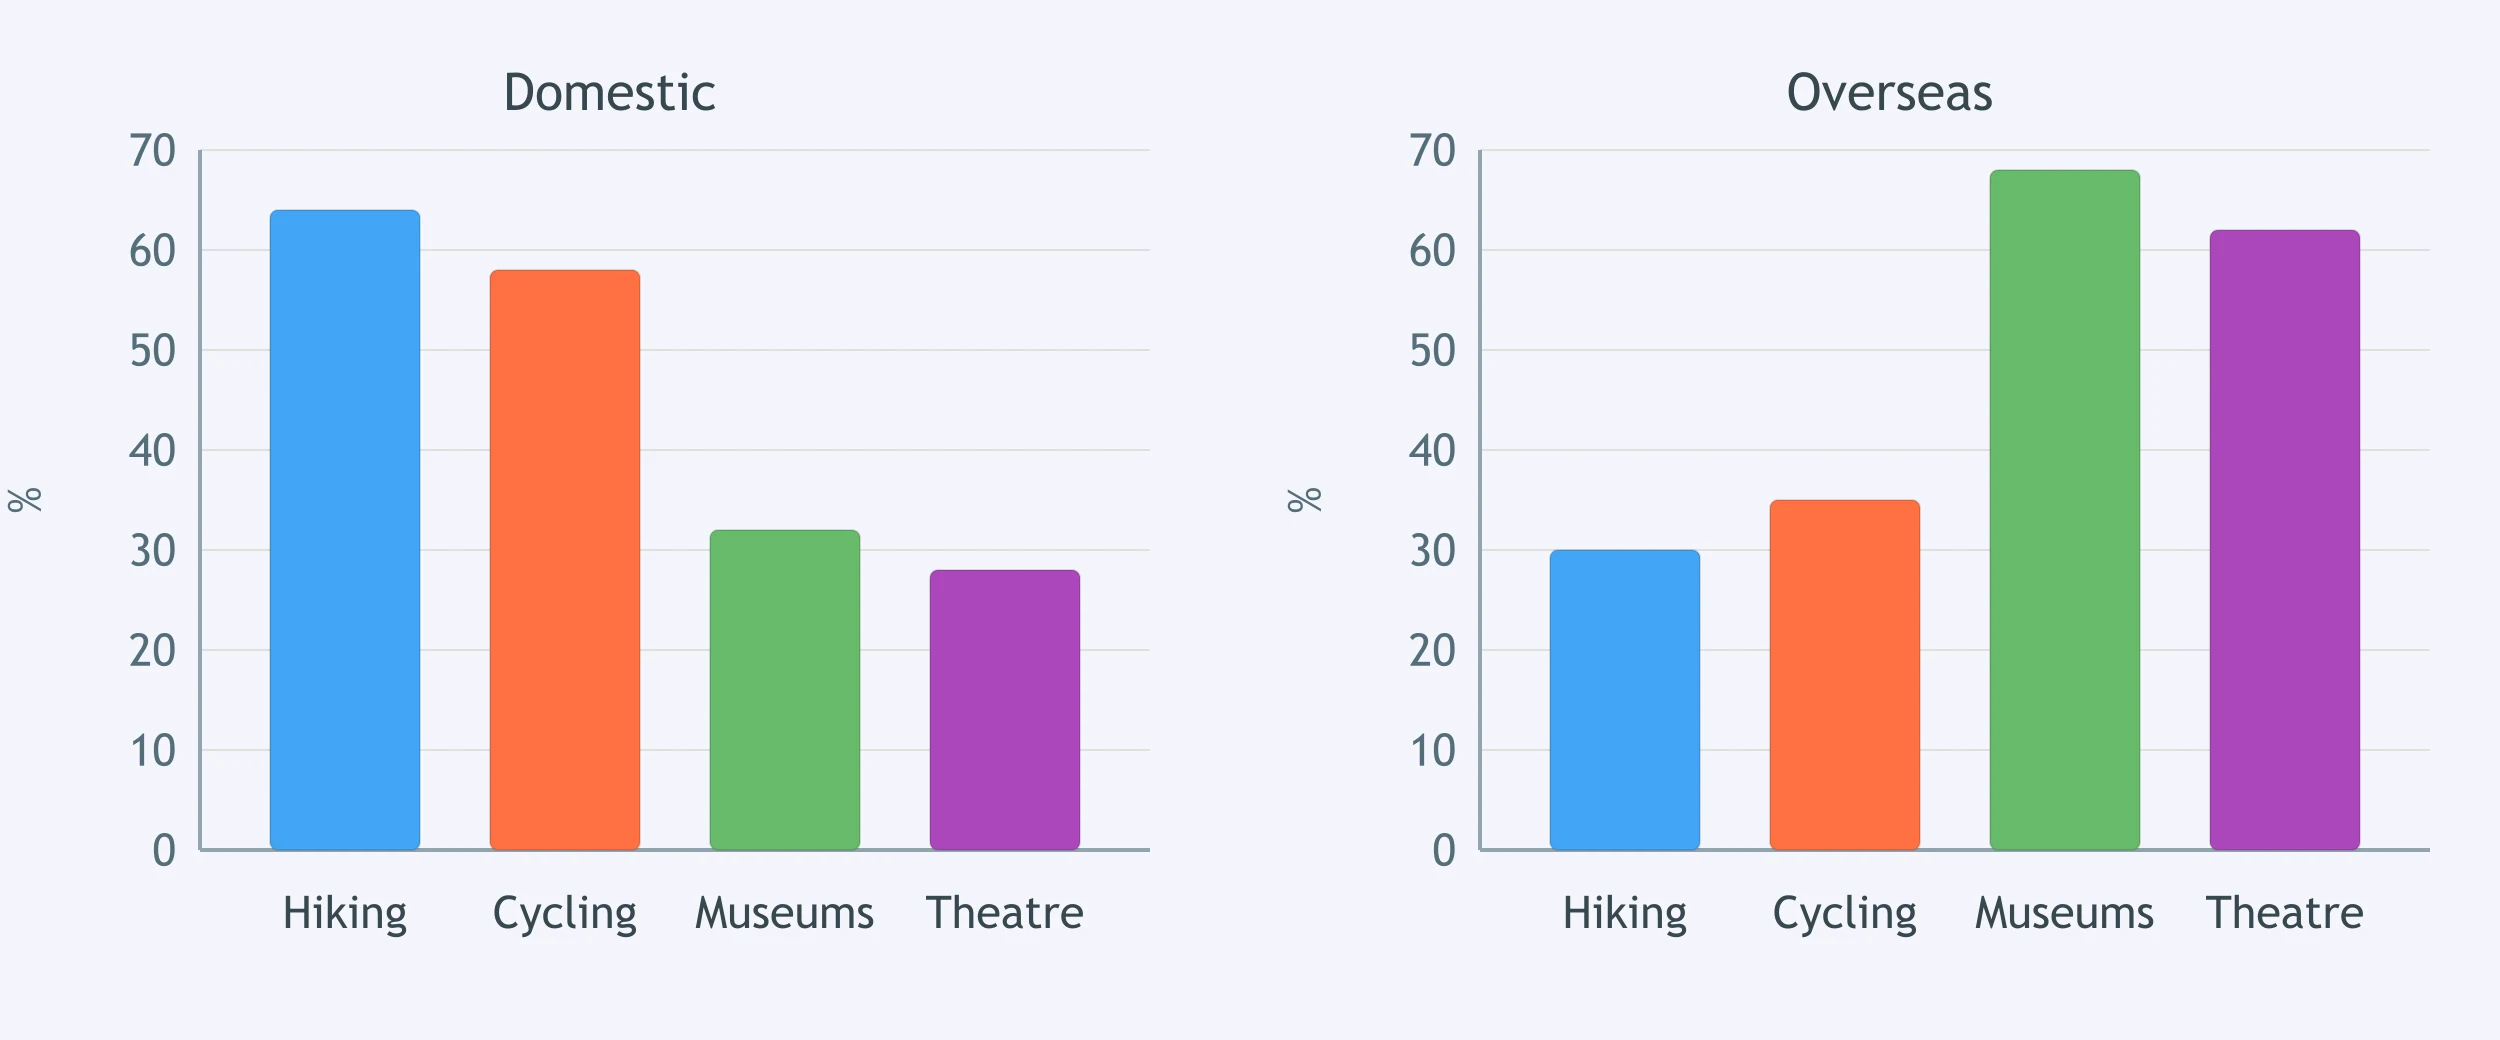
Summarise the visitor activity charts in one grouped sentence. Which option is accurate?
Crack the passcode before the zombies get in.
Answer, then swat bugs for bonus points.
Race through questions at your own speed.
Same question on every screen. Fastest wins.

Pick a tile, answer, hit bonuses and steals.

Tables and Mixed Chart Tasks - IELTS 6.0 W T1
30 questions