Loading
by BlastRoom
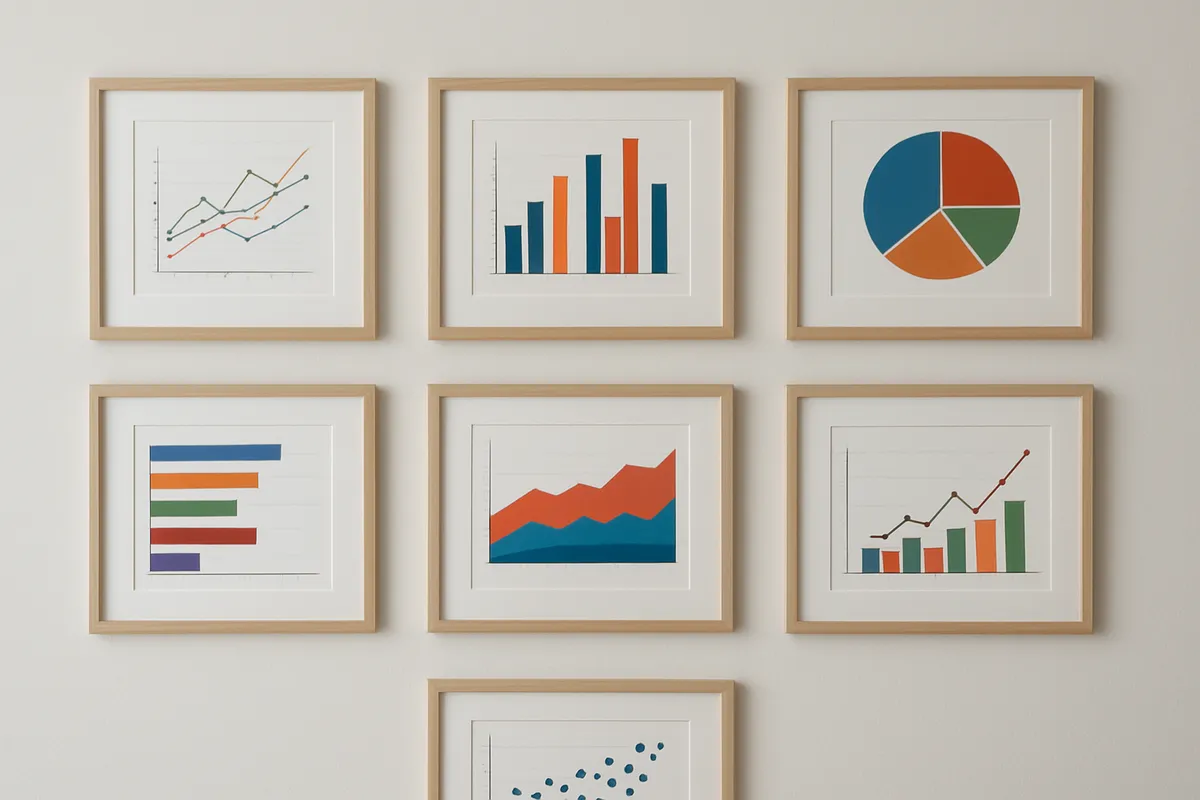
Mixed practice across the displays unit: frequency tables, categorical graphs, dot plots, stem-and-leaf plots, histograms, shape and misleading graphs.
#probability_and_statistics
40 questions
One question set, multiple game modes. Tap any game to see it in action. Not sure which to pick?
Answer to place stones and capture territory.
Outrun the snow together.
Earn blasts, then hunt the other team.
Answer to earn energy, then climb.

The class blasts through walls together.
Bid on mystery lots. Most money wins.
Sell tours. Nice, standard, or a total scam.

Answer, restock, and serve the rush.
More correct answers pulls the rope your way.
Answer, then shoot down the alien wave.
Answer, then tap to leap the frozen ridge.
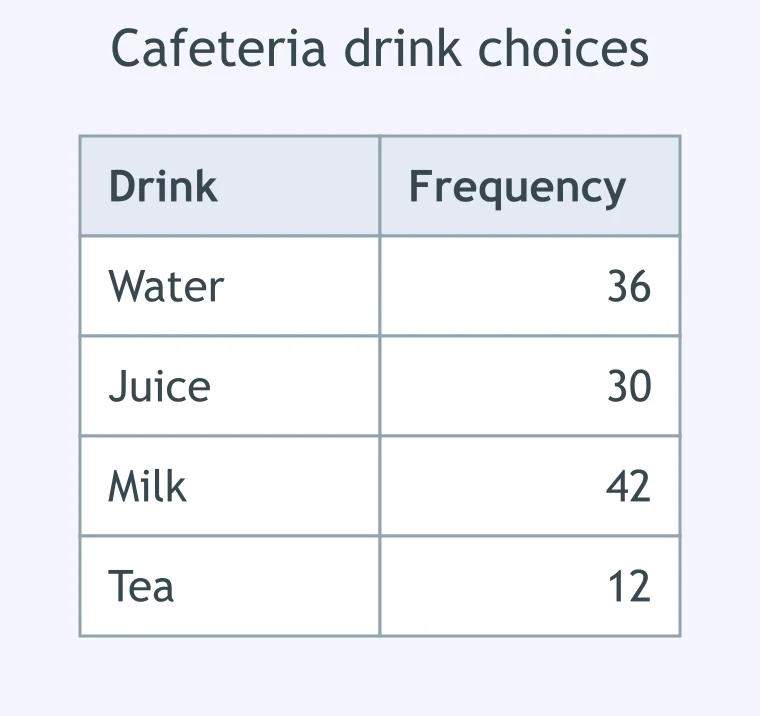
A table shows 120 cafeteria drink choices by drink. What is the relative frequency of milk choices, as a percentage?
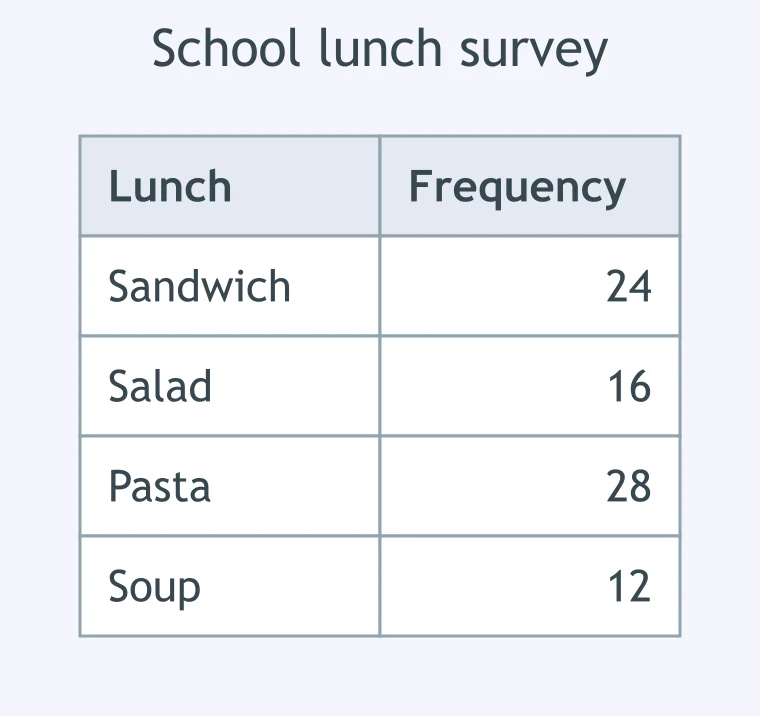
A school survey records 80 lunches by type. What fraction of lunches were salads, in lowest terms?
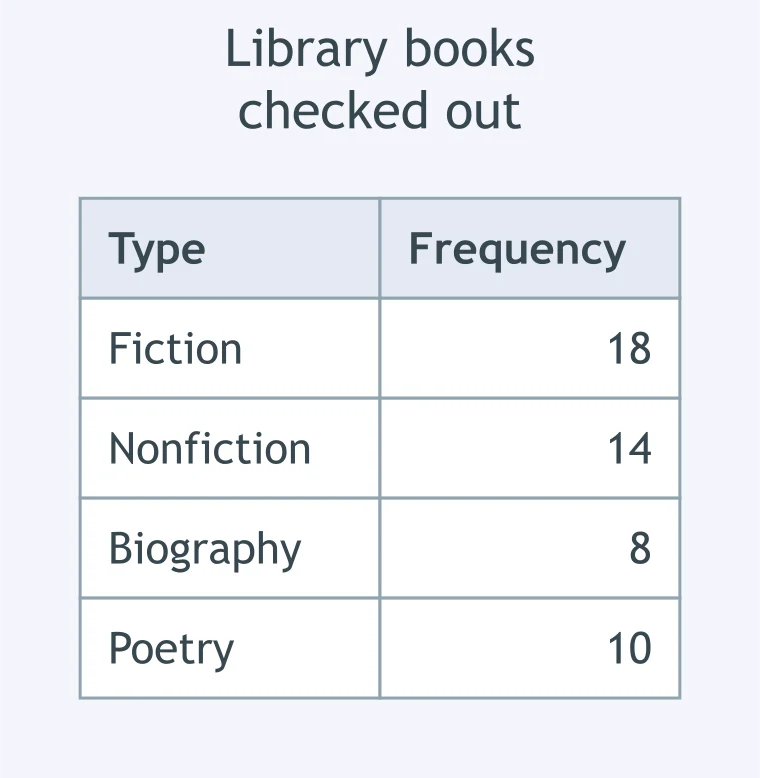
A frequency table shows 50 library books checked out by type. How many books are not fiction?
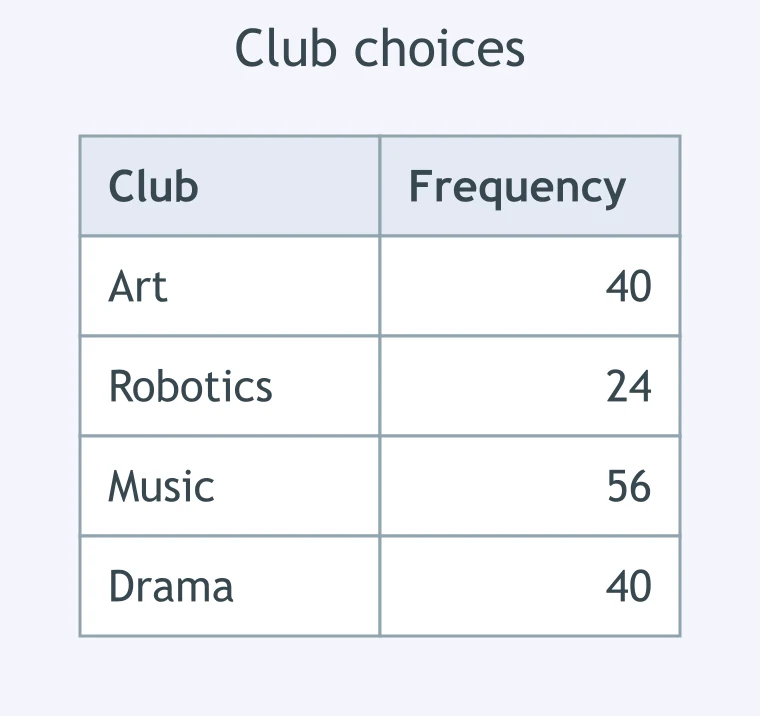
In a survey of 160 students, a table shows club choices. Which club had a relative frequency of 25 percent?
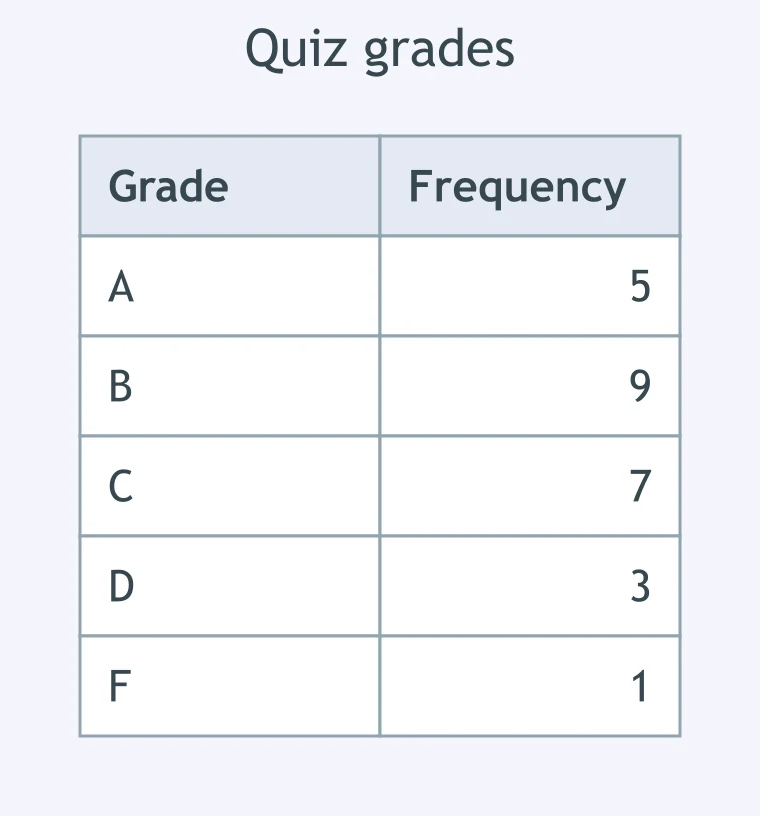
A class recorded 25 quiz grades in a frequency table. What is the relative frequency of grades below C, as a percentage?
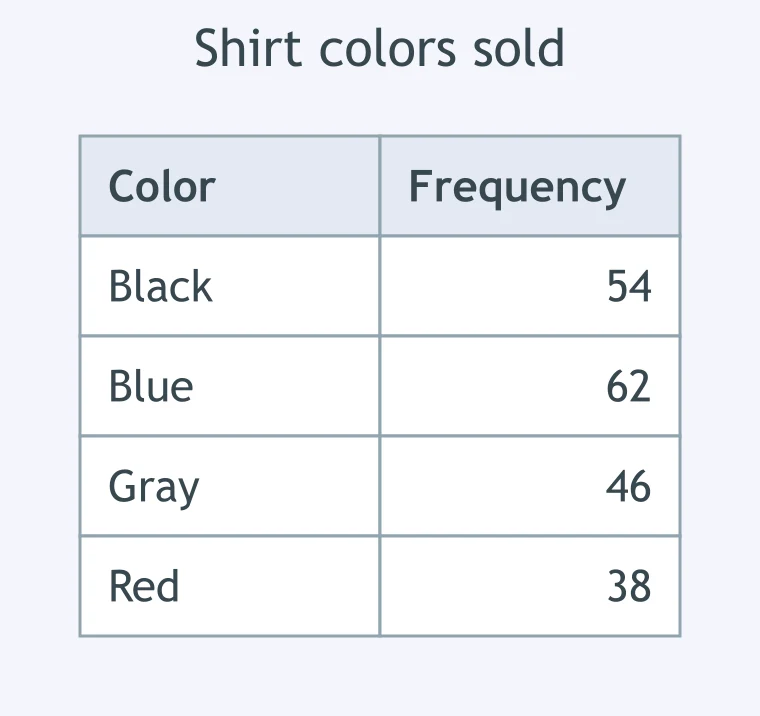
A store counted 200 shirts sold by color. What is the frequency of shirts that were blue?
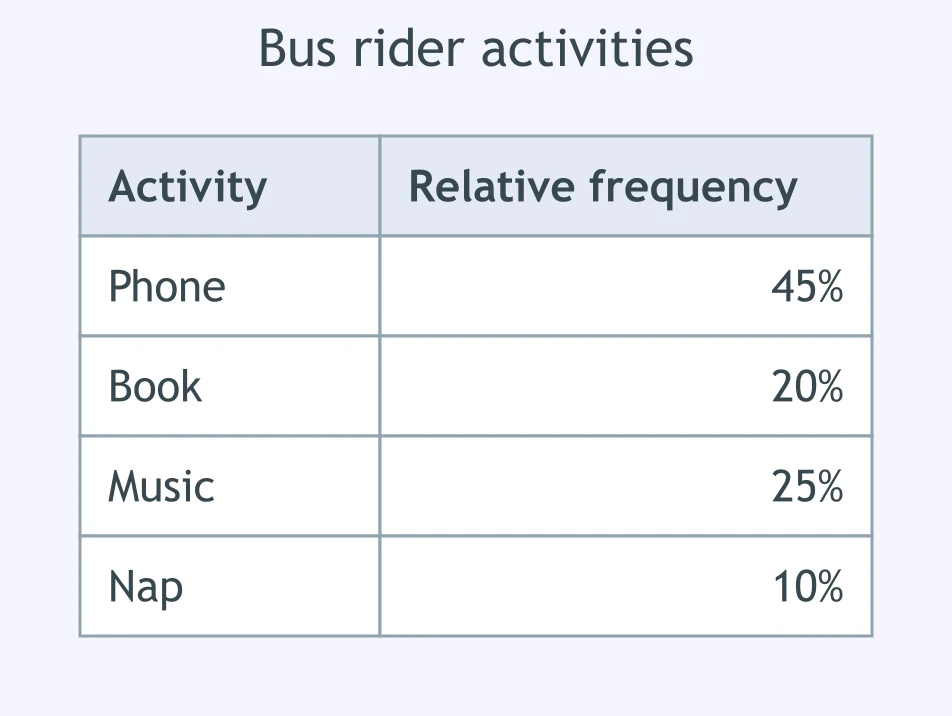
A relative frequency table shows activities for 40 bus riders. How many riders listened to music?
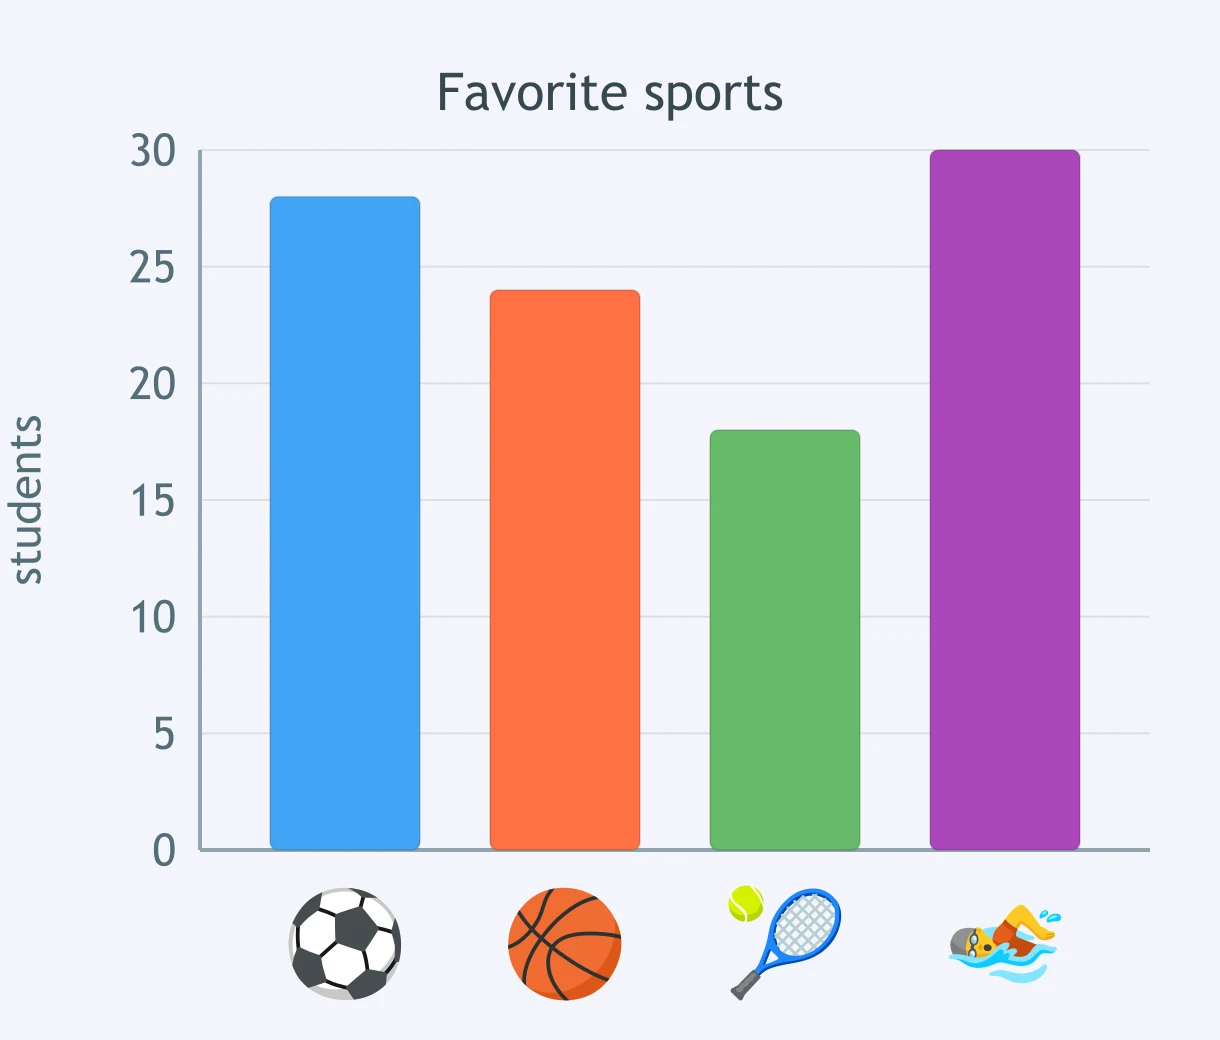
A bar graph shows favorite sports for 100 students. Which sport has the greatest frequency?
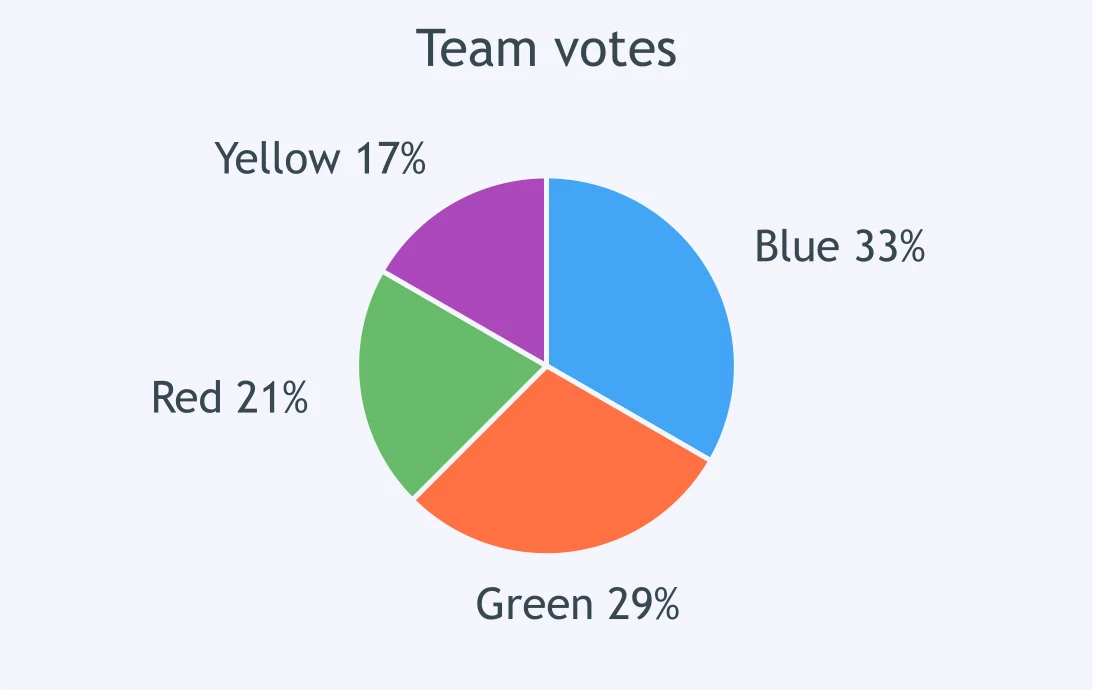
A pie chart shows 240 team votes. About how many votes did the blue team get?
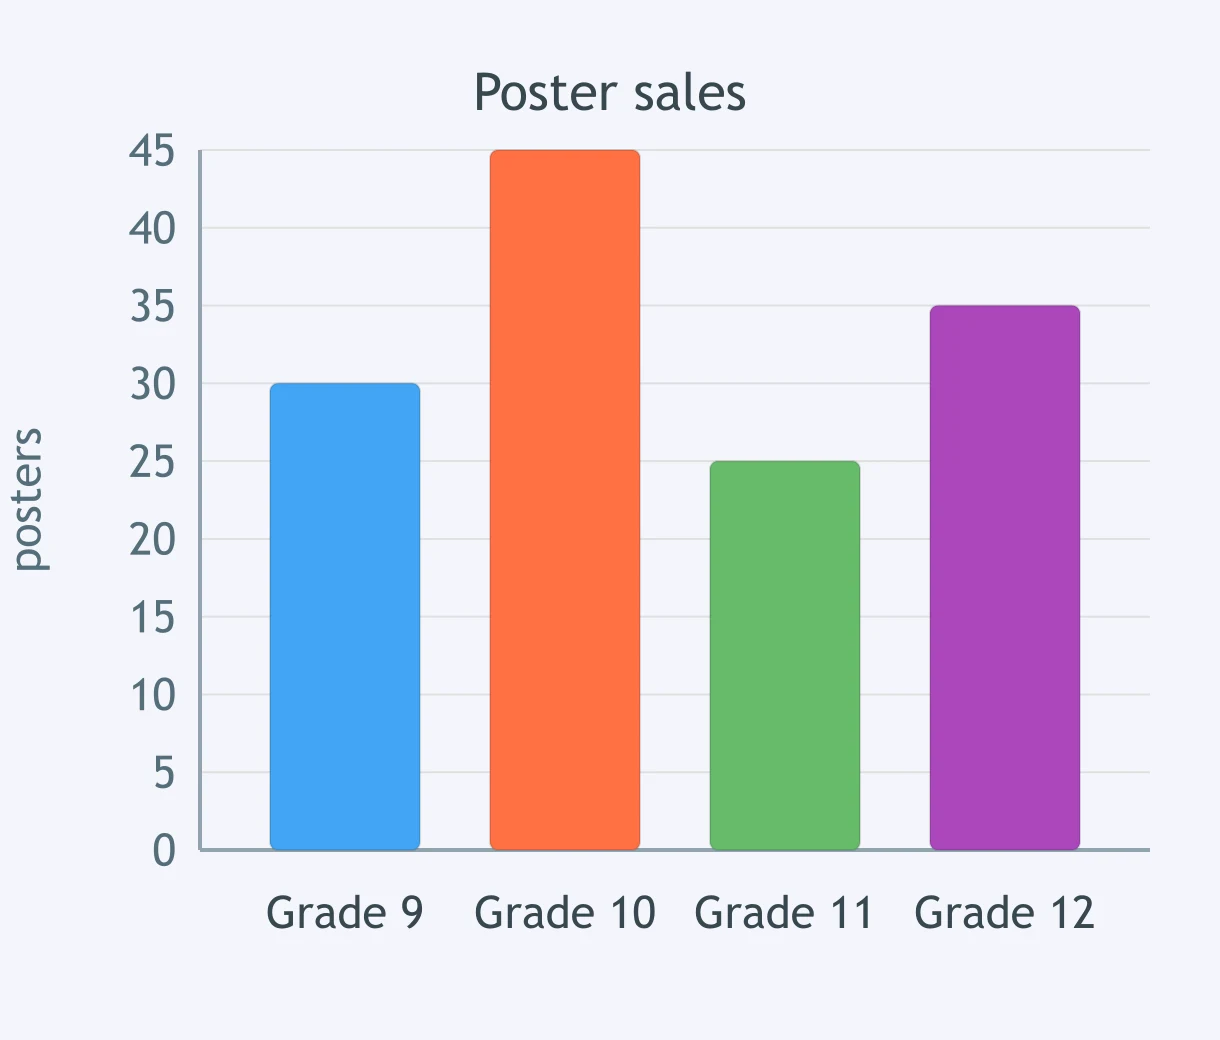
A bar graph shows poster sales by grade. How many more posters did grade 10 sell than grade 11?
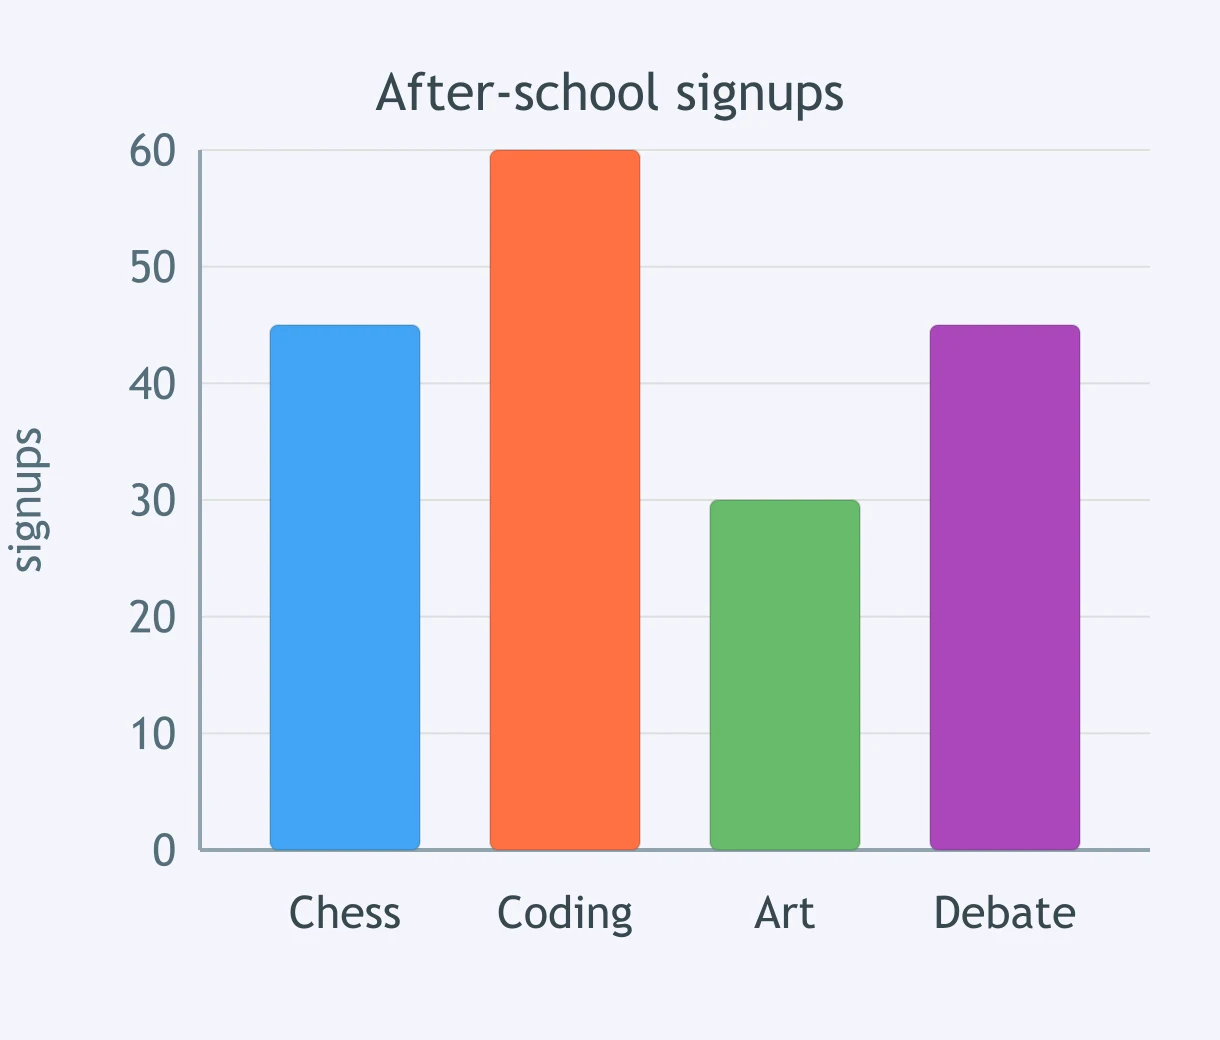
A bar graph shows 180 after-school signups by activity. What percent of signups were for coding?
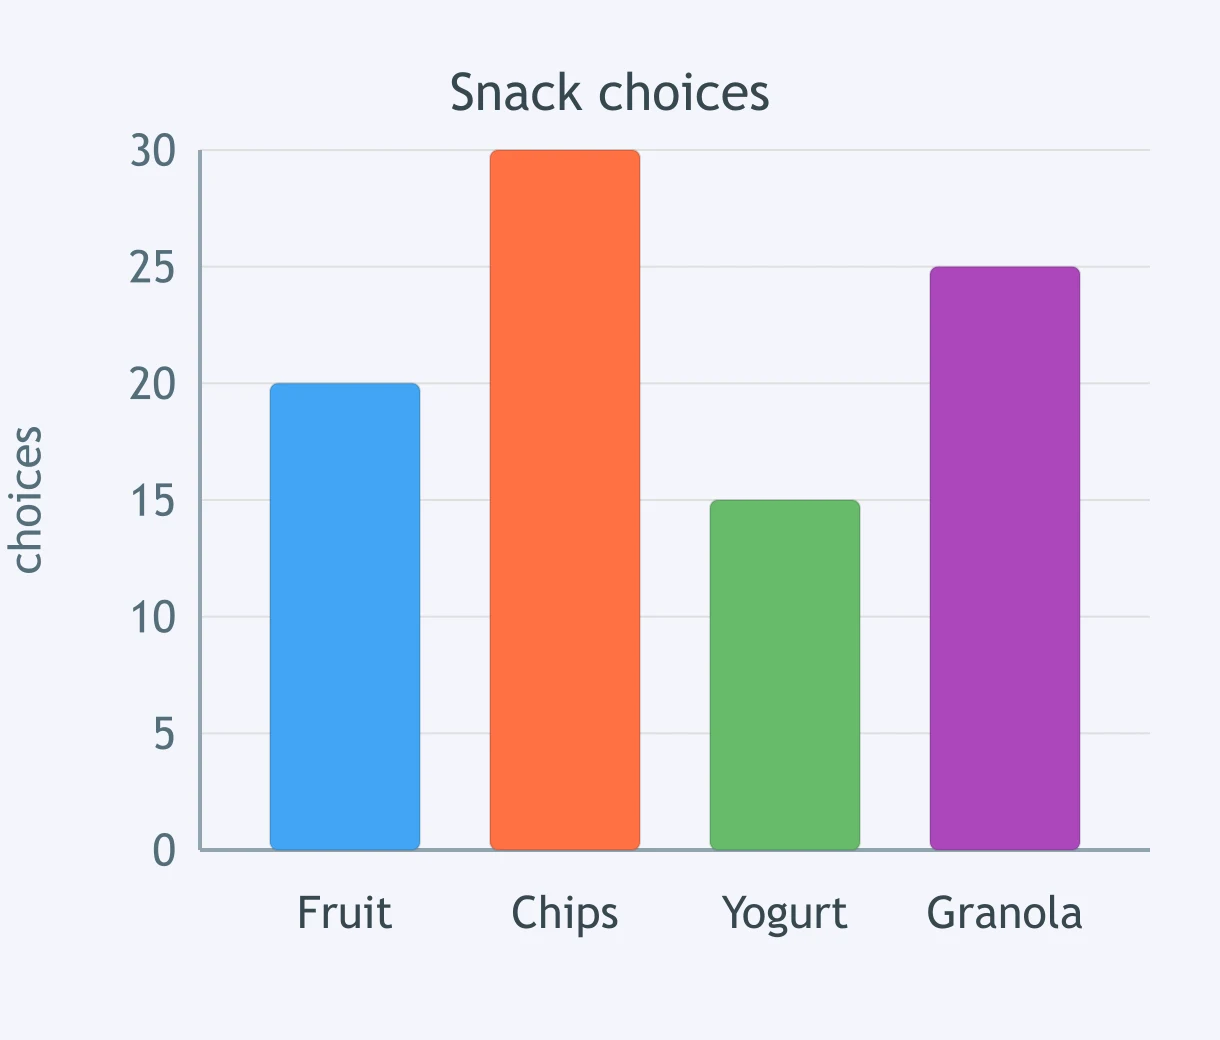
A bar graph displays 90 snack choices by category. Which two categories together make 55 choices?
A dot plot shows books read by 20 students. What feature occurs at 4 books?
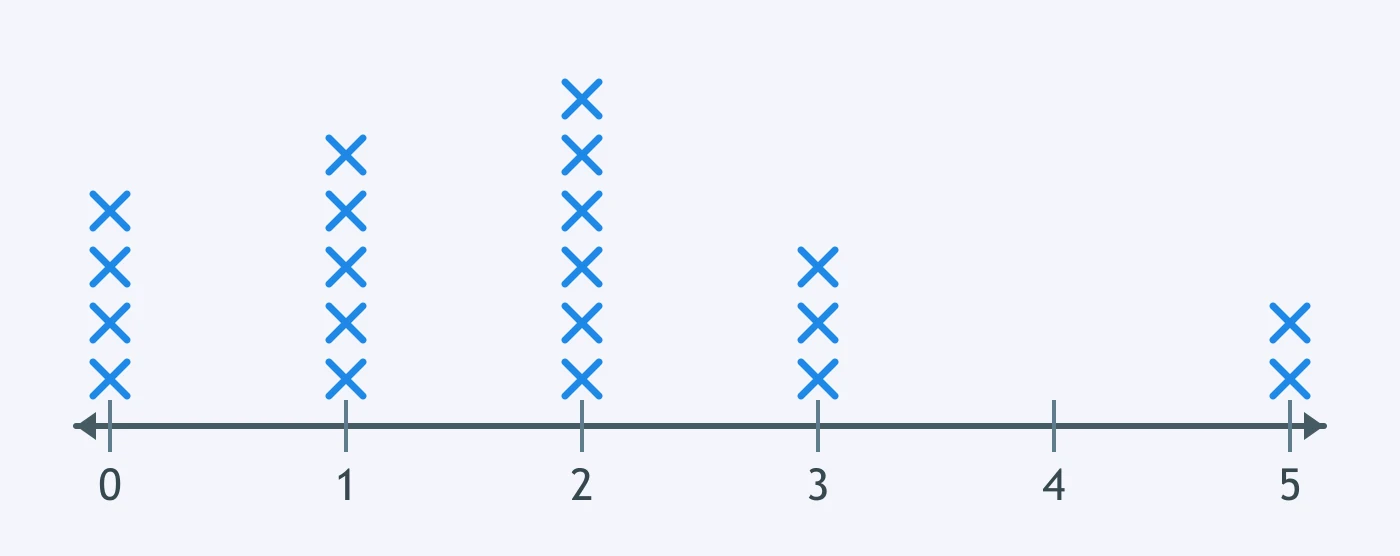
A dot plot shows daily text messages. What value is the mode?
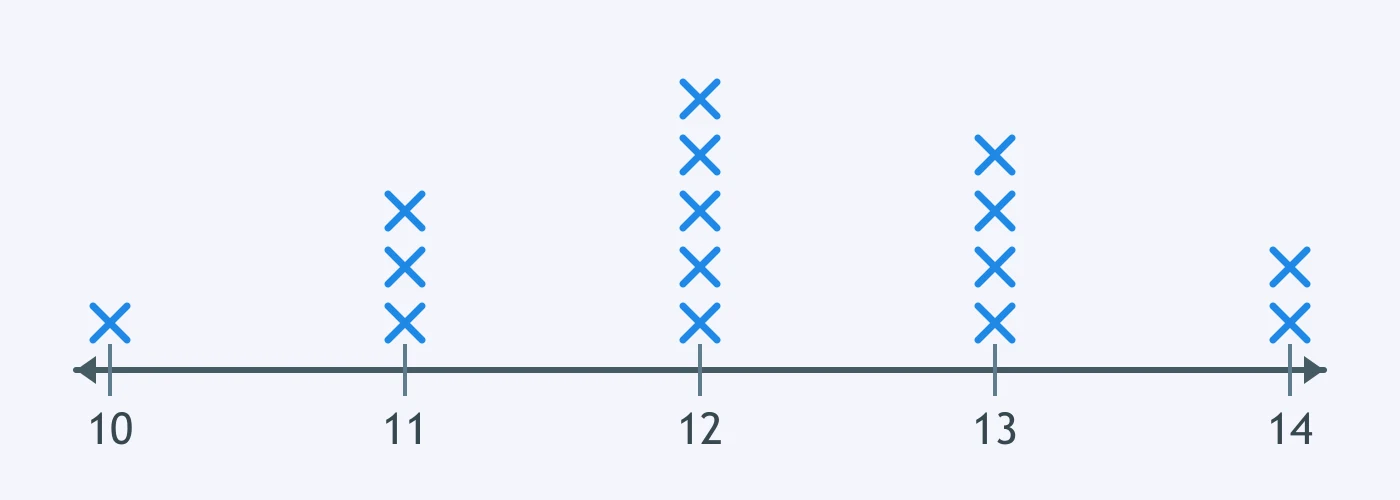
A dot plot shows 18 plant heights in centimeters. Which value is a likely outlier?
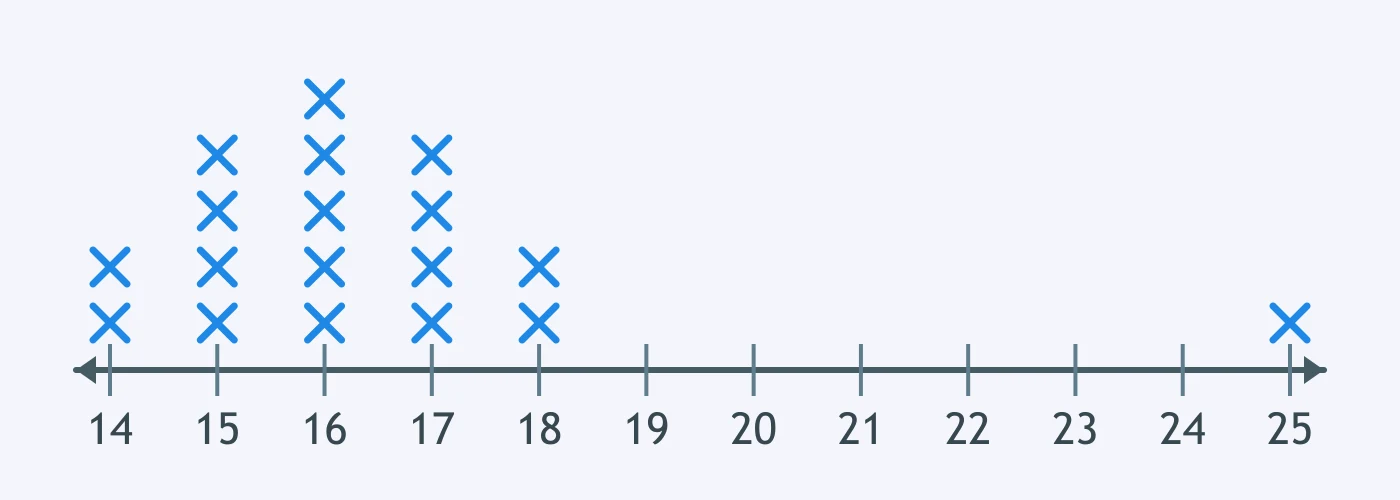
A dot plot shows practice hours. How many students practiced at least 3 hours?
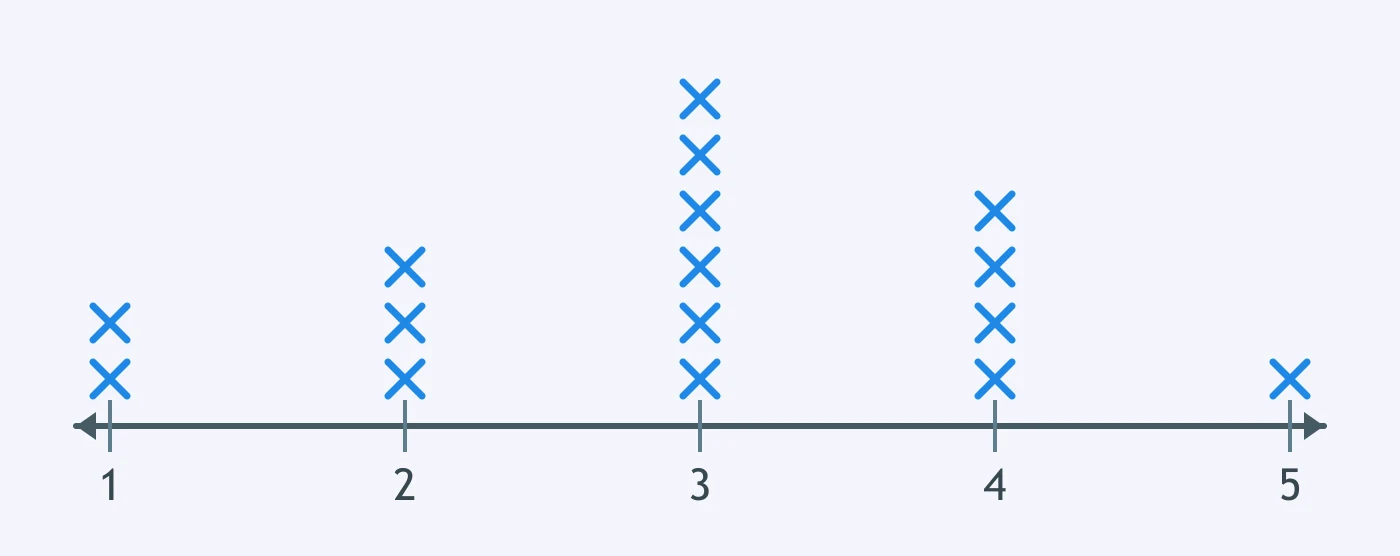
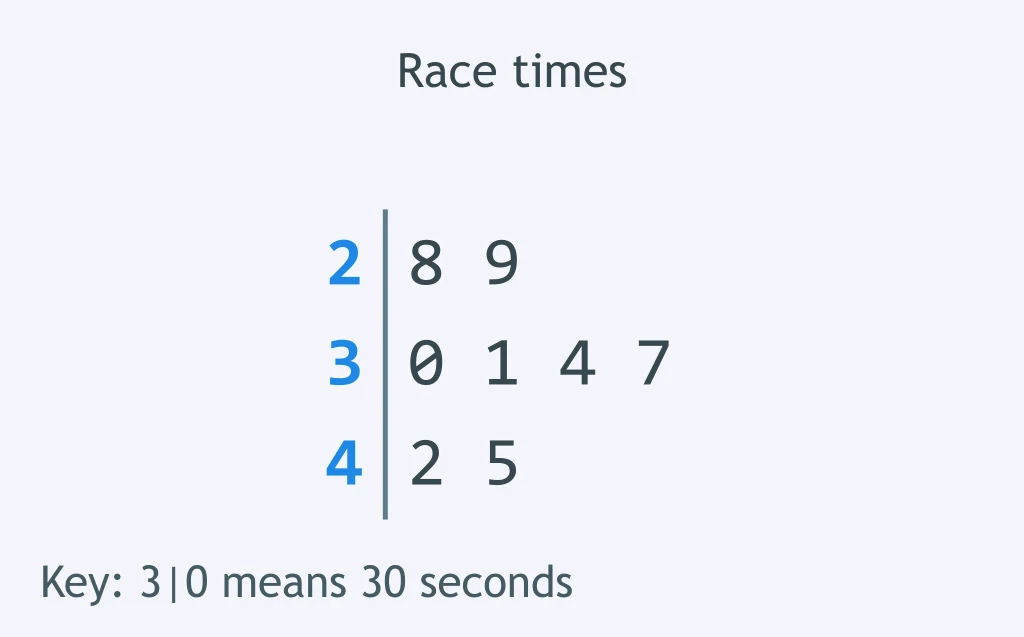
A stem-and-leaf plot shows race times in seconds, using tens as stems, so a stem of 3 with a leaf of 0 means 30 seconds. What is the maximum time?
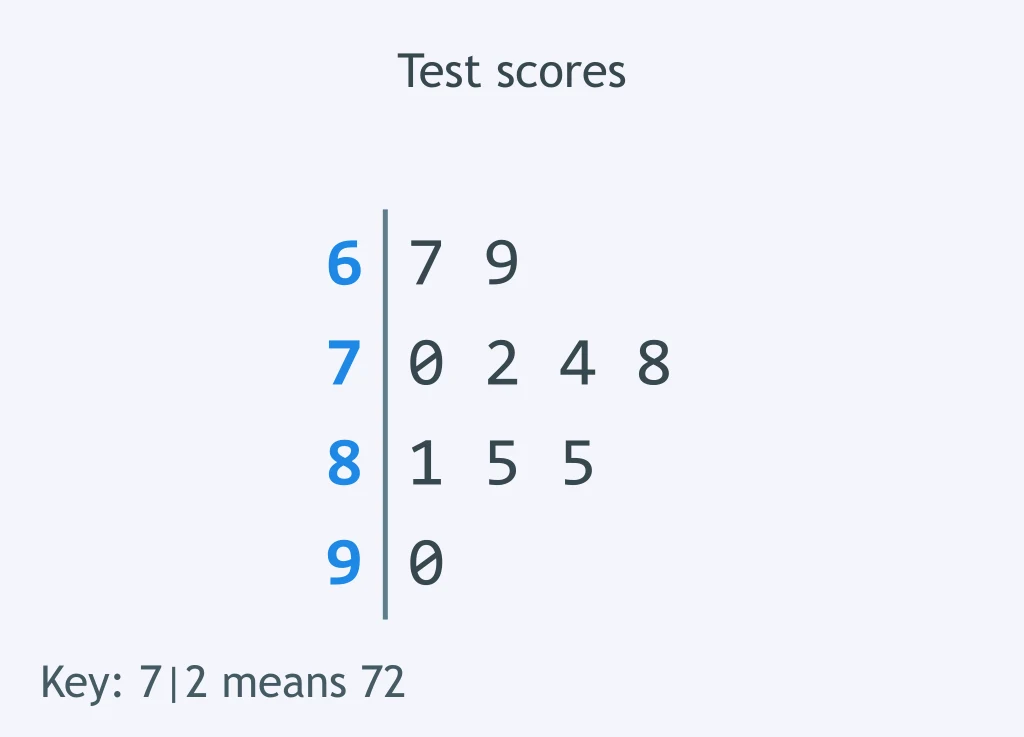
A stem-and-leaf plot shows test scores, using tens as stems, so a stem of 7 with a leaf of 2 means 72. How many scores are in the 80s?
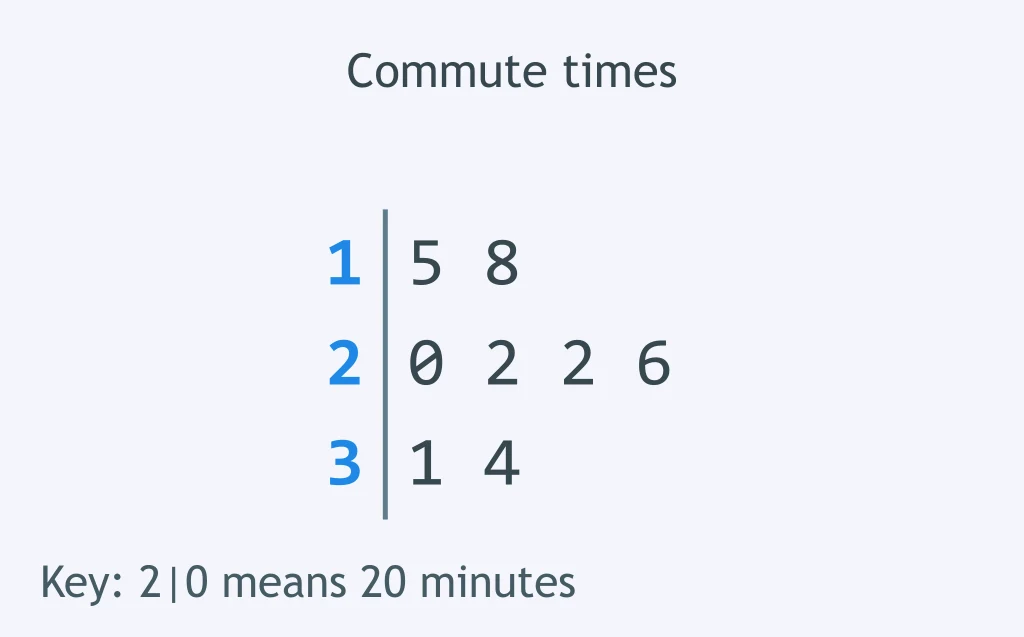
A stem-and-leaf plot shows commute times in minutes, using tens as stems, so a stem of 2 with a leaf of 0 means 20 minutes. What is the median commute time?
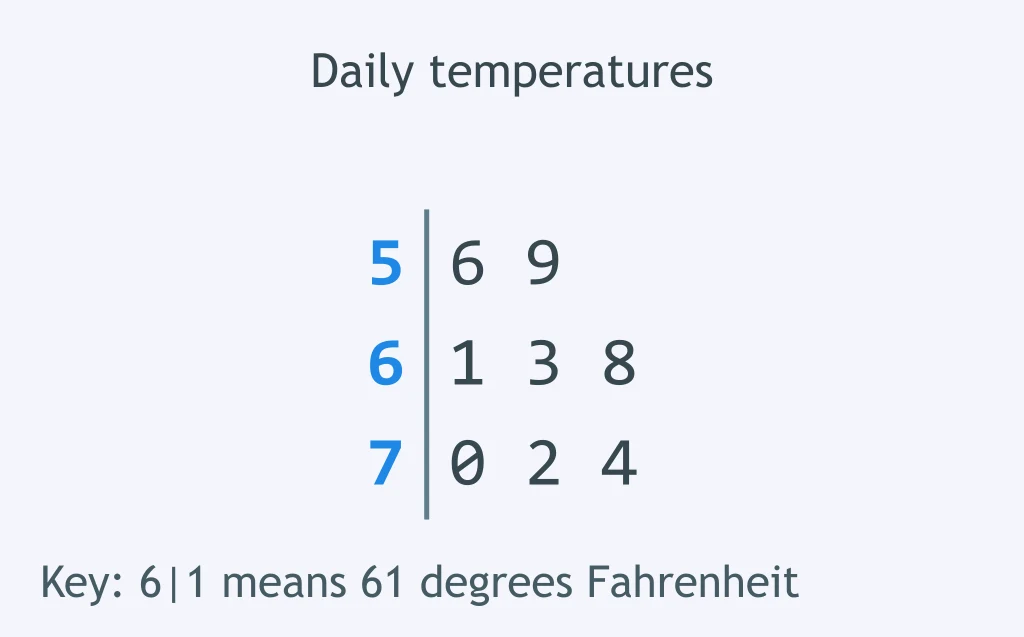
A stem-and-leaf plot shows daily temperatures in °F, using tens as stems, so a stem of 6 with a leaf of 1 means 61 °F. What is the range?
A histogram shows delivery times in minutes. How many deliveries took at least 20 minutes?
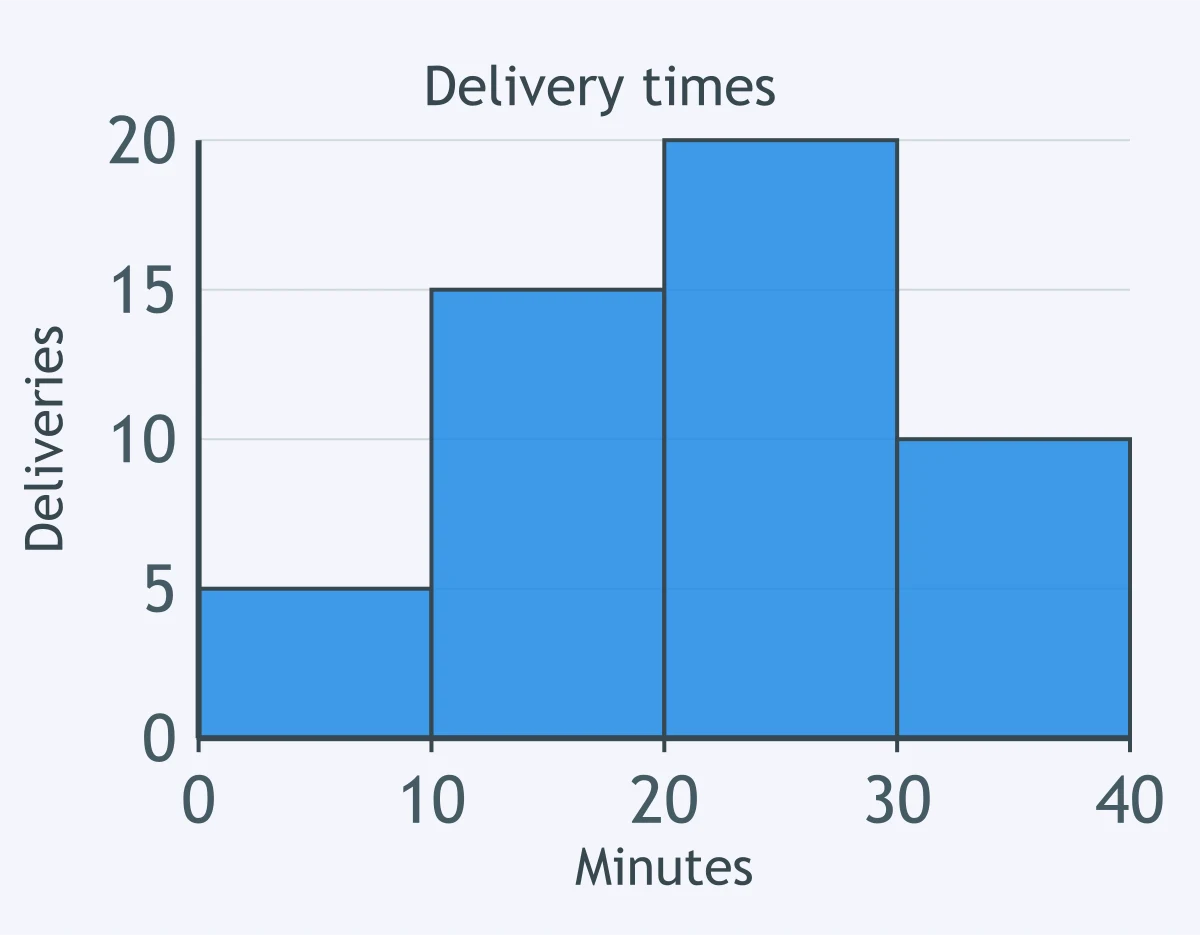
A histogram shows plant masses in grams. What is the class width?
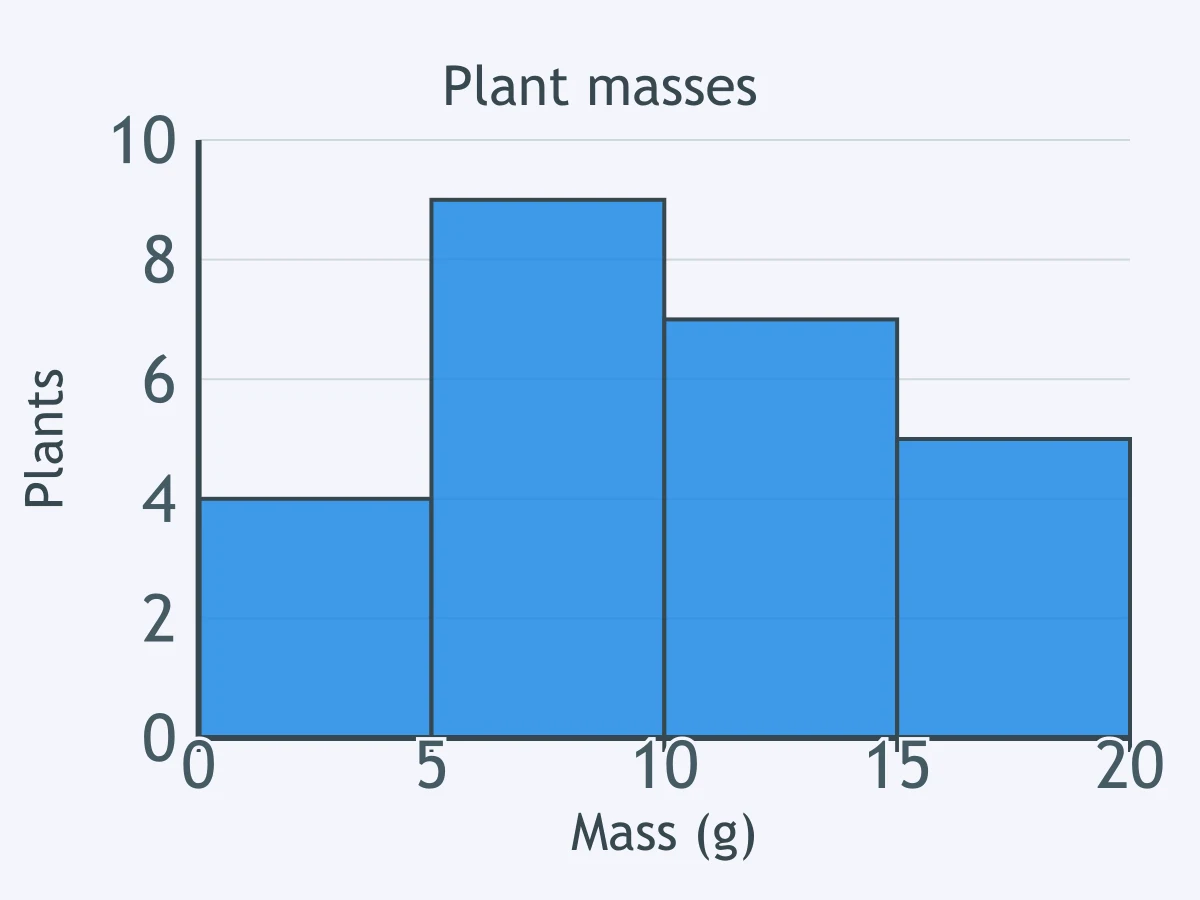
A histogram shows 50 app download times in seconds. How many times were under 6 seconds?
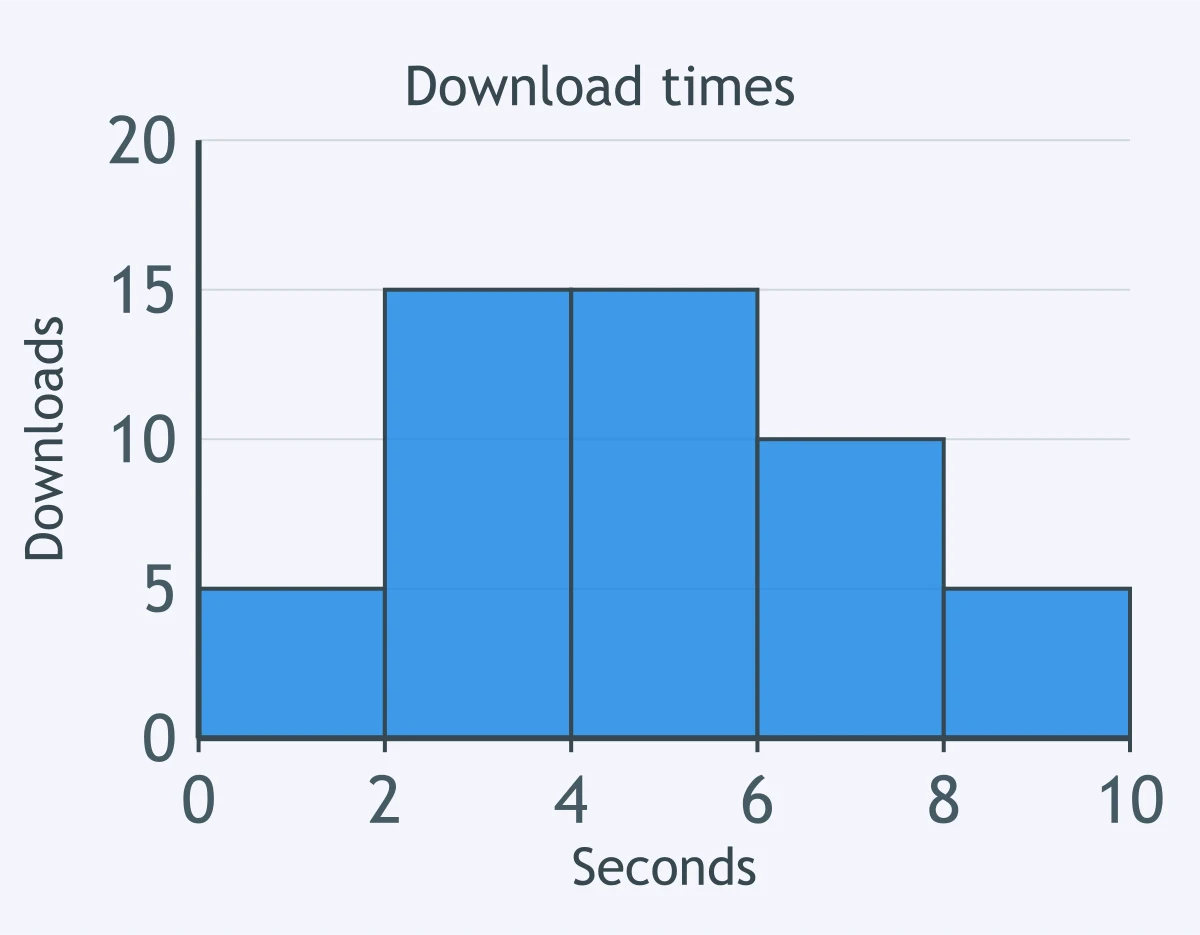
A histogram shows quiz completion times in minutes. Which class has the highest frequency?
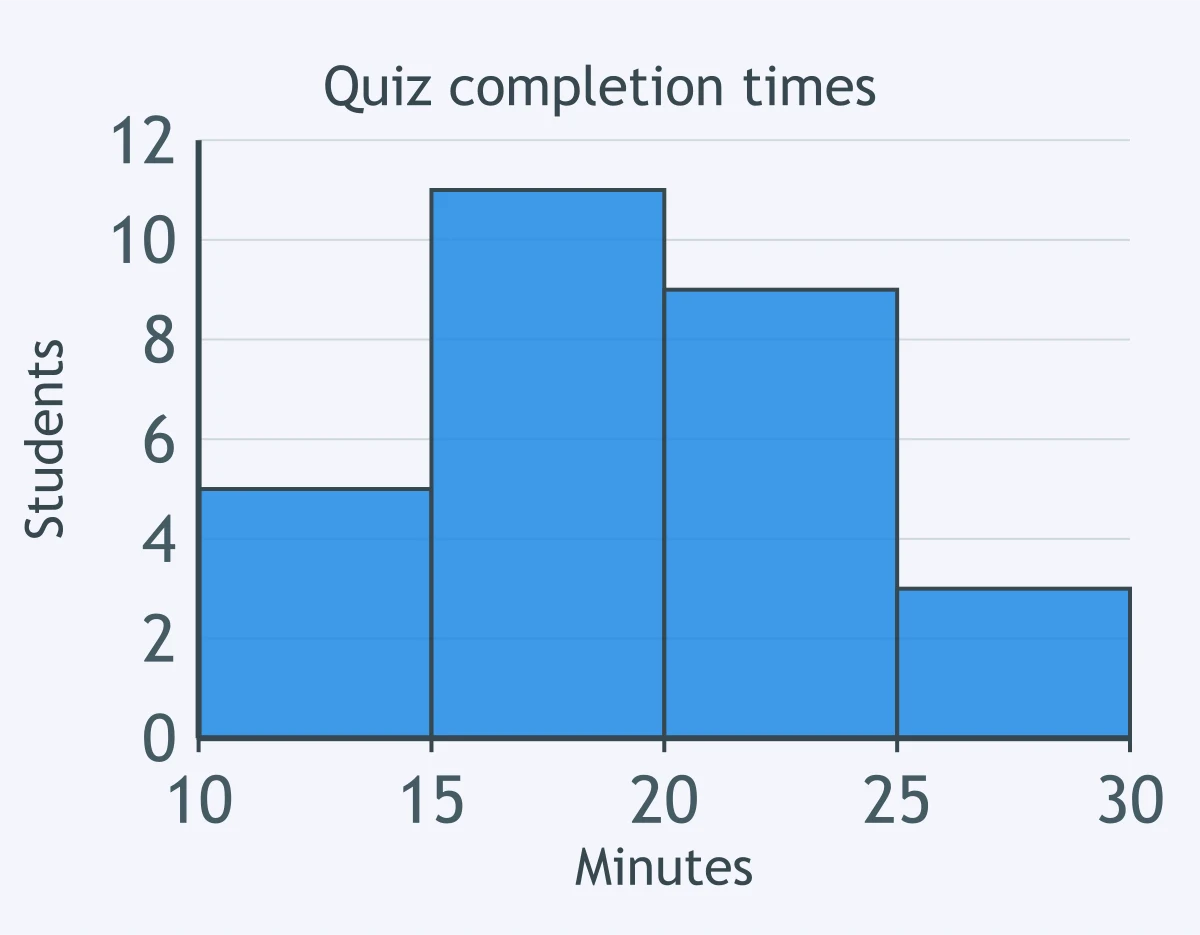
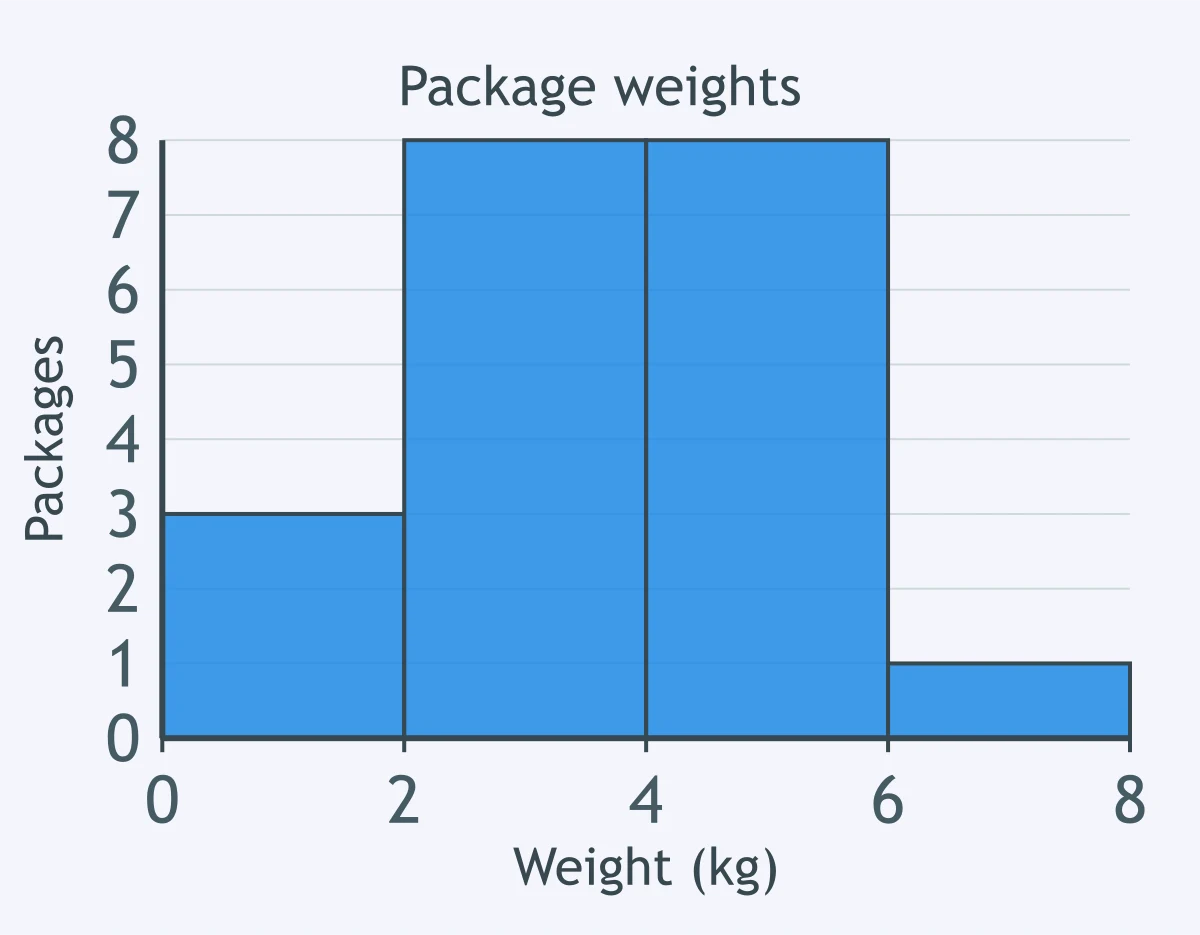
A histogram shows package weights in kilograms. What percent of packages weighed 2 to under 6 kilograms?
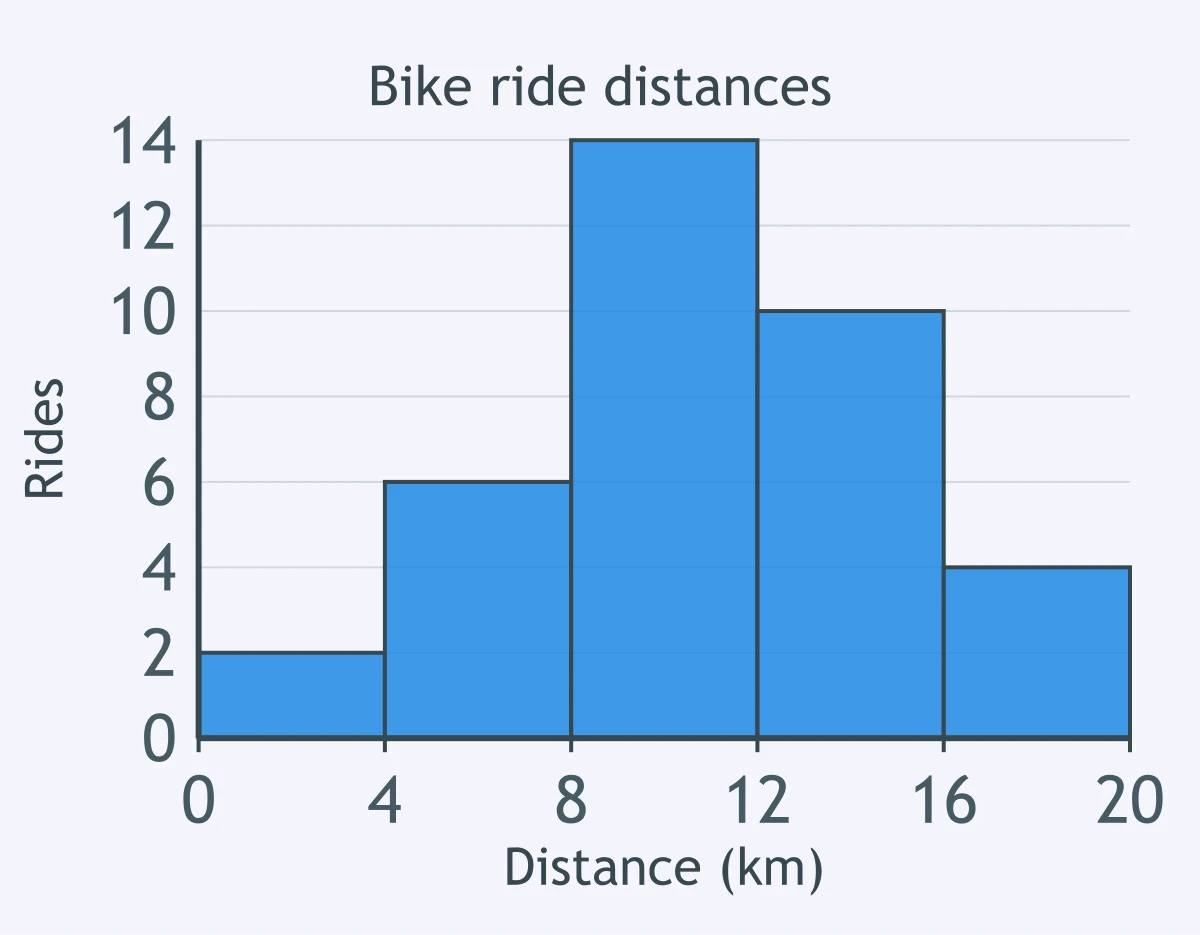
A histogram shows 36 bike ride distances in kilometers. Which distance class contains 10 rides?
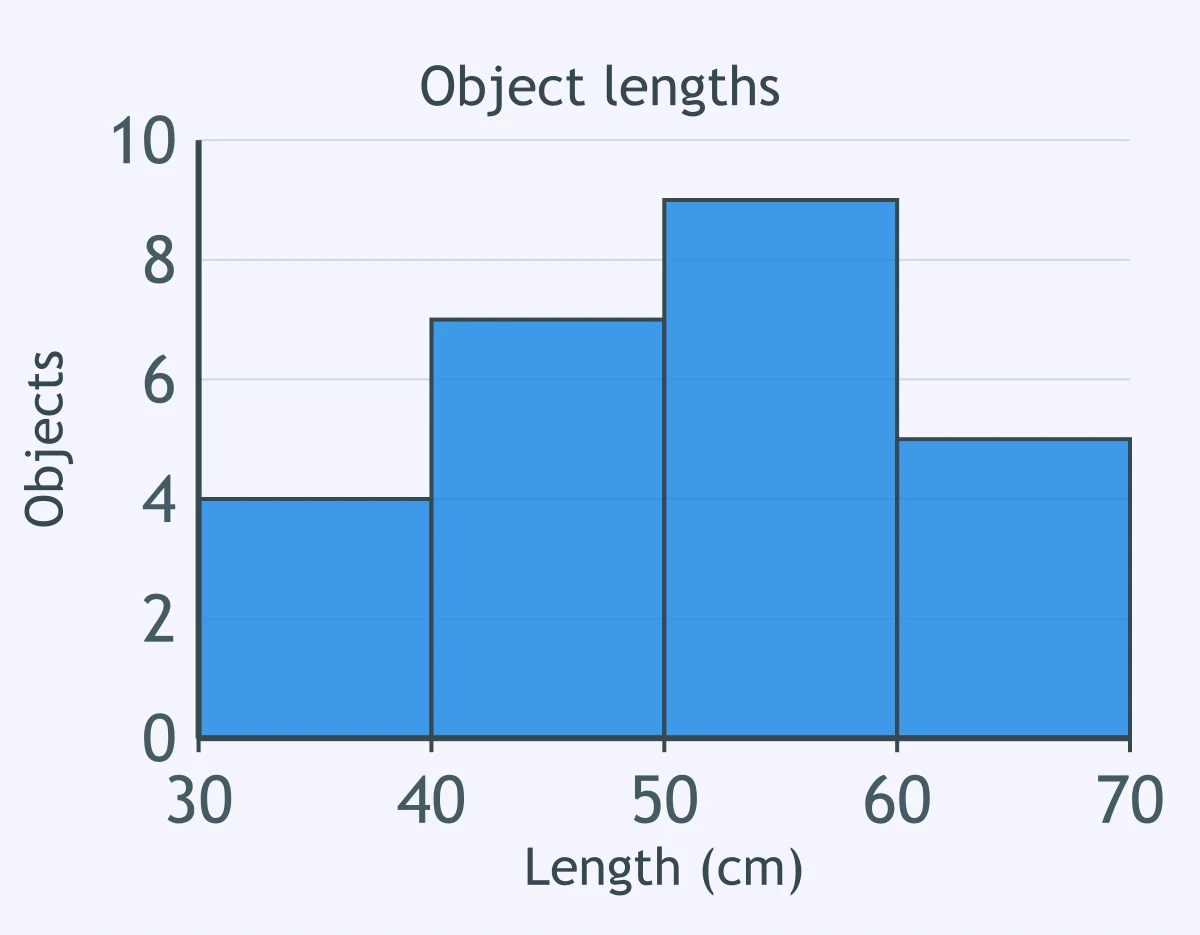
A histogram uses classes 30 to under 40, 40 to under 50, 50 to under 60 and 60 to under 70 centimeters. Which value belongs in the 50 to under 60 class?
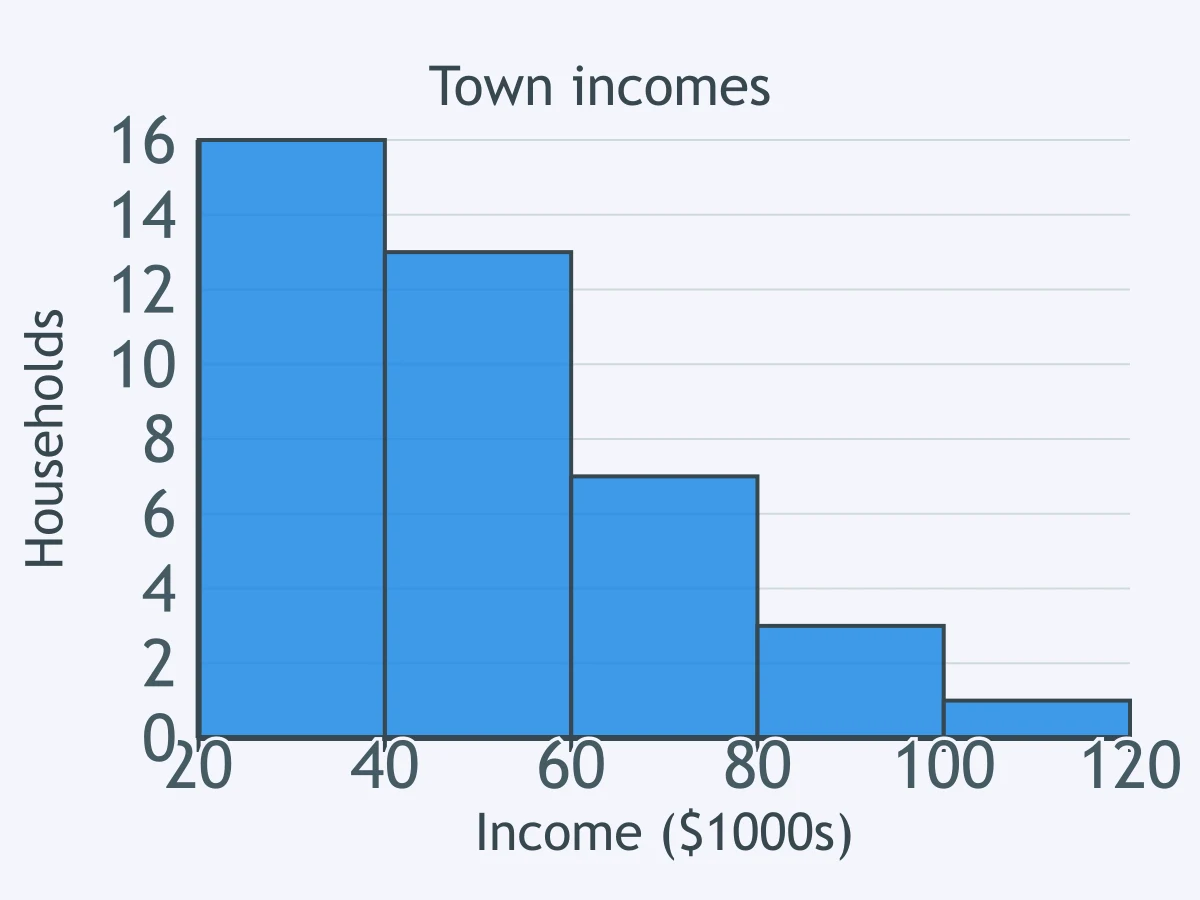
A histogram shows household incomes in a town. What shape is this distribution?
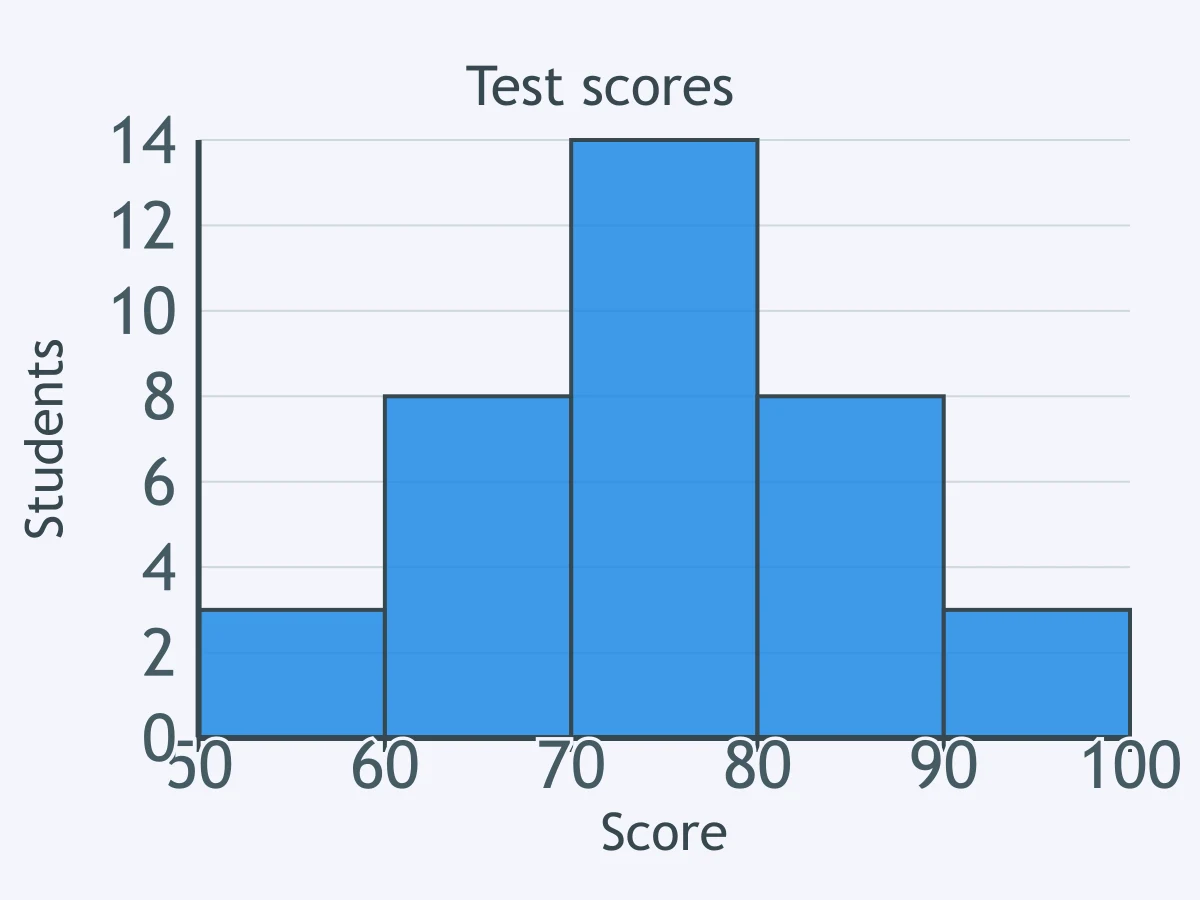
A histogram shows students' test scores. What shape is this distribution?
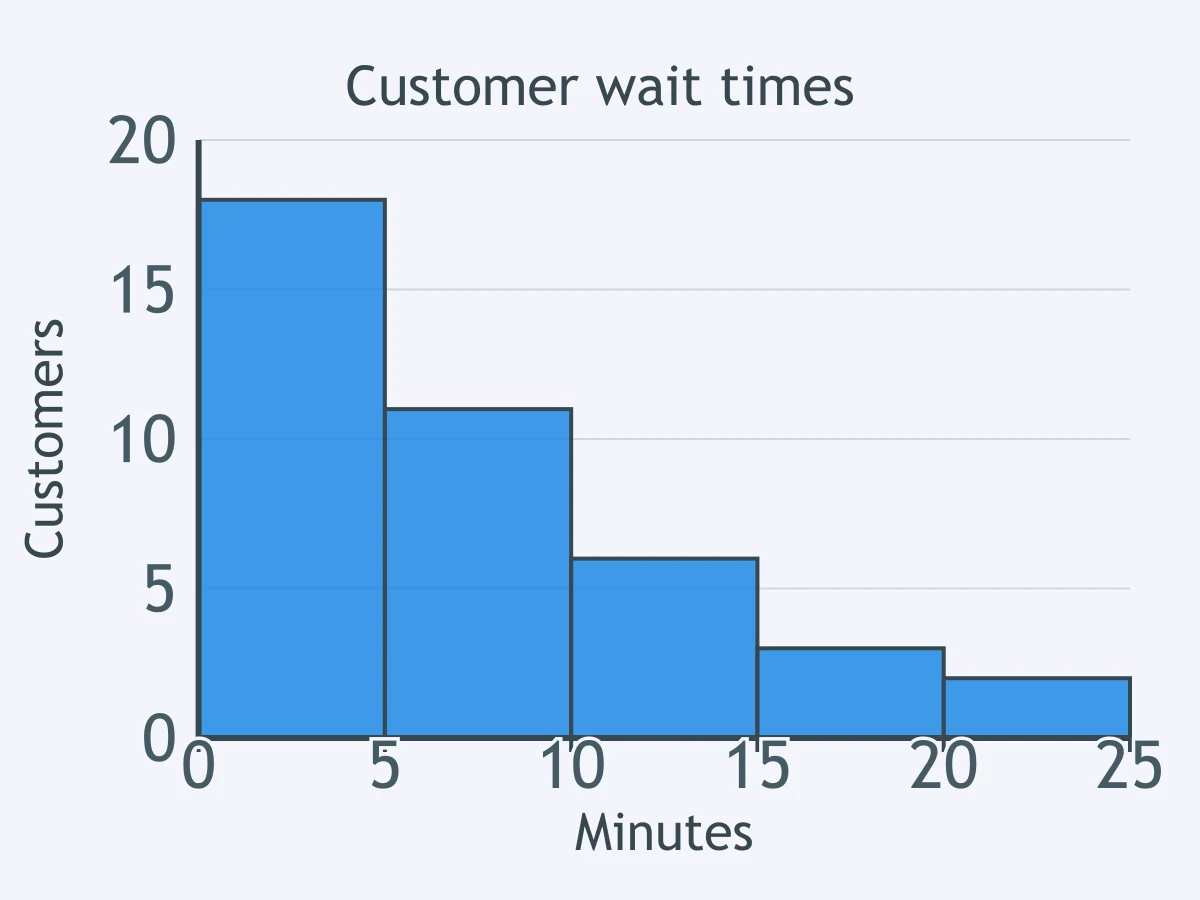
A histogram shows customer wait times in minutes. What does the shape of the histogram show?
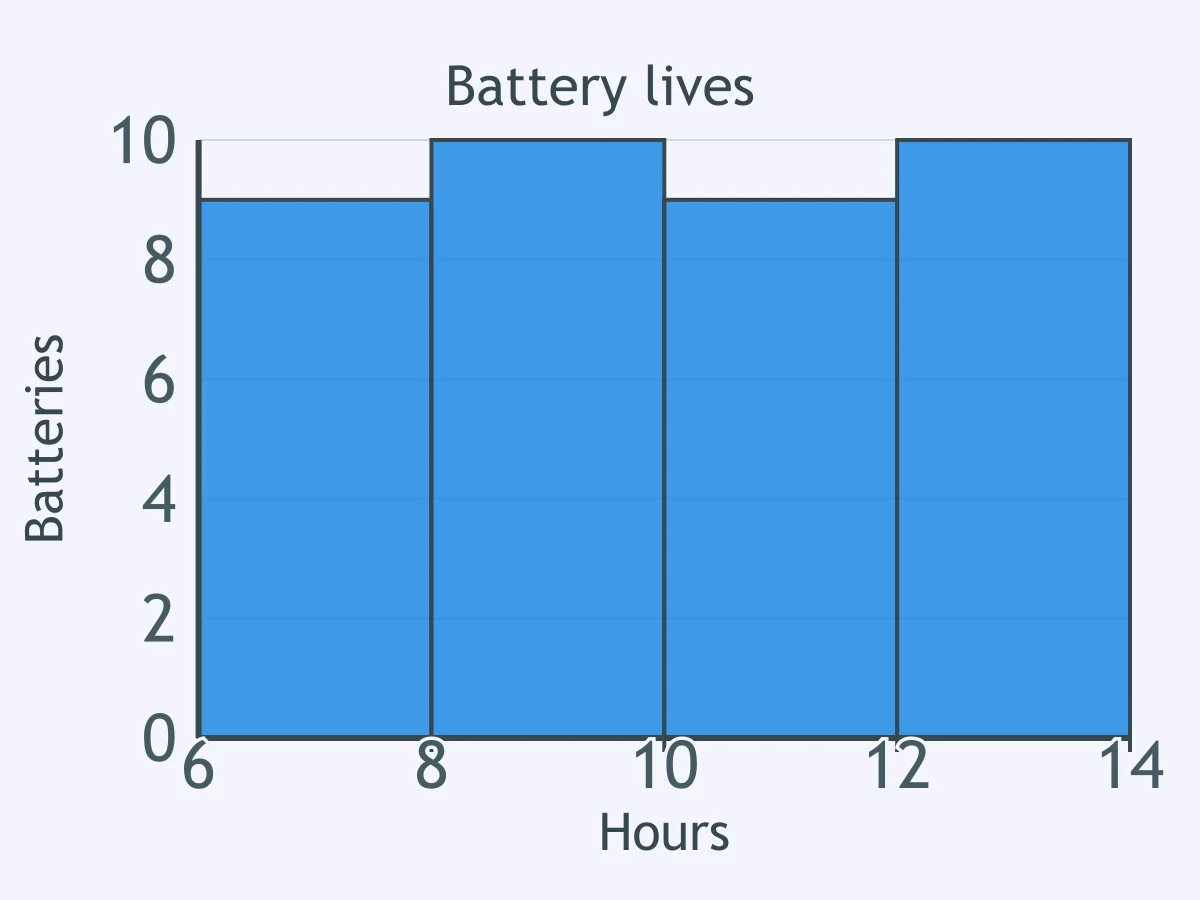
A histogram shows battery lives in hours. What shape best describes the distribution?
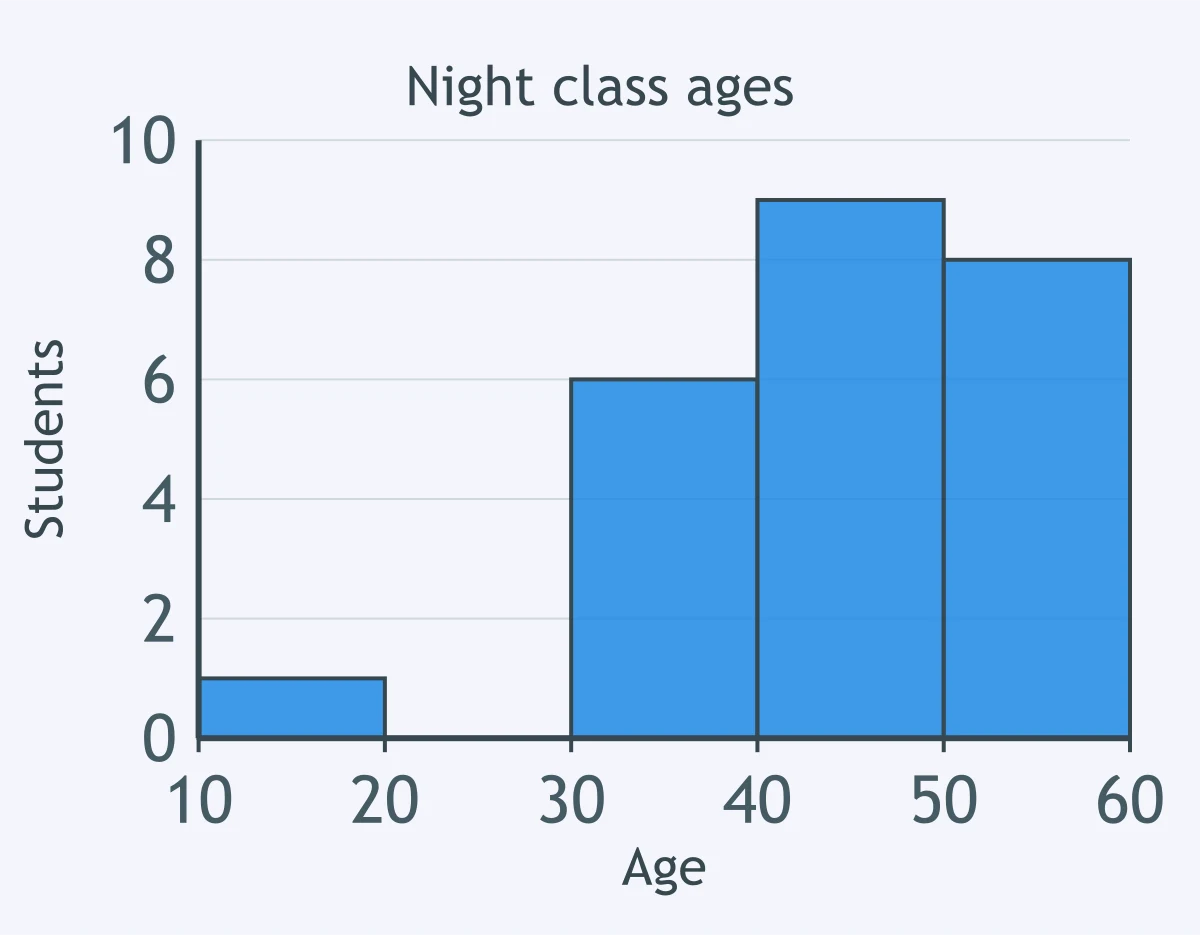
A histogram shows student ages at a night class. The only student younger than 20 is 18 years old. Which term describes this age?
A histogram of café order totals has high bars at low prices and one long tail stretching toward larger totals. Which center is usually pulled toward that tail?
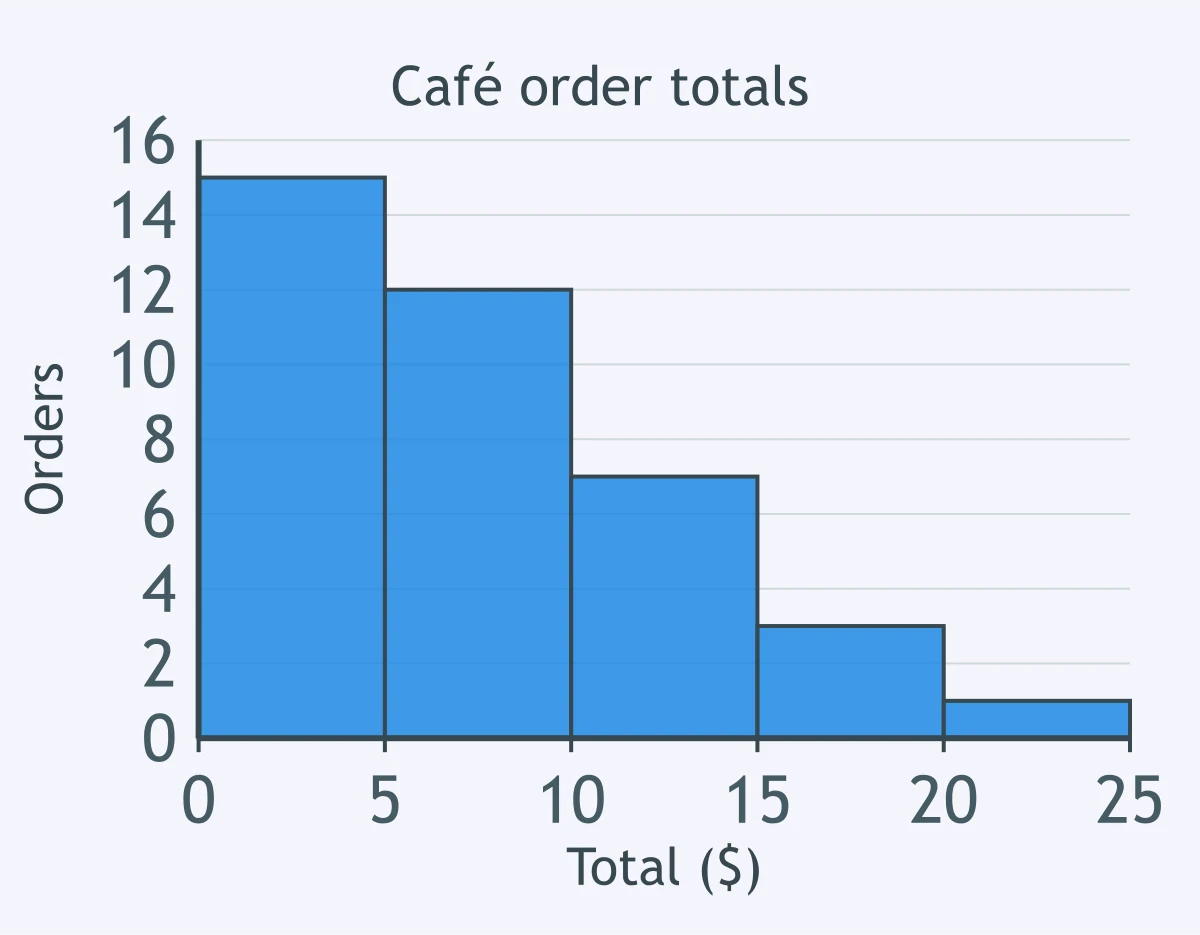
A counselor wants to show the percentage of seniors choosing college, work, military or another plan after graduation. Which display best shows parts of one whole?
A coach records each runner's 5-kilometer time in minutes and wants to show the distribution for 18 runners while keeping each exact time visible. Which display should the coach use?
A school has 300 exam scores and wants to show their overall shape using equal score intervals. Which display is most appropriate?
A class collected 15 plant heights in centimeters and wants a display that keeps every exact value and organizes tens and ones digits. Which display fits?
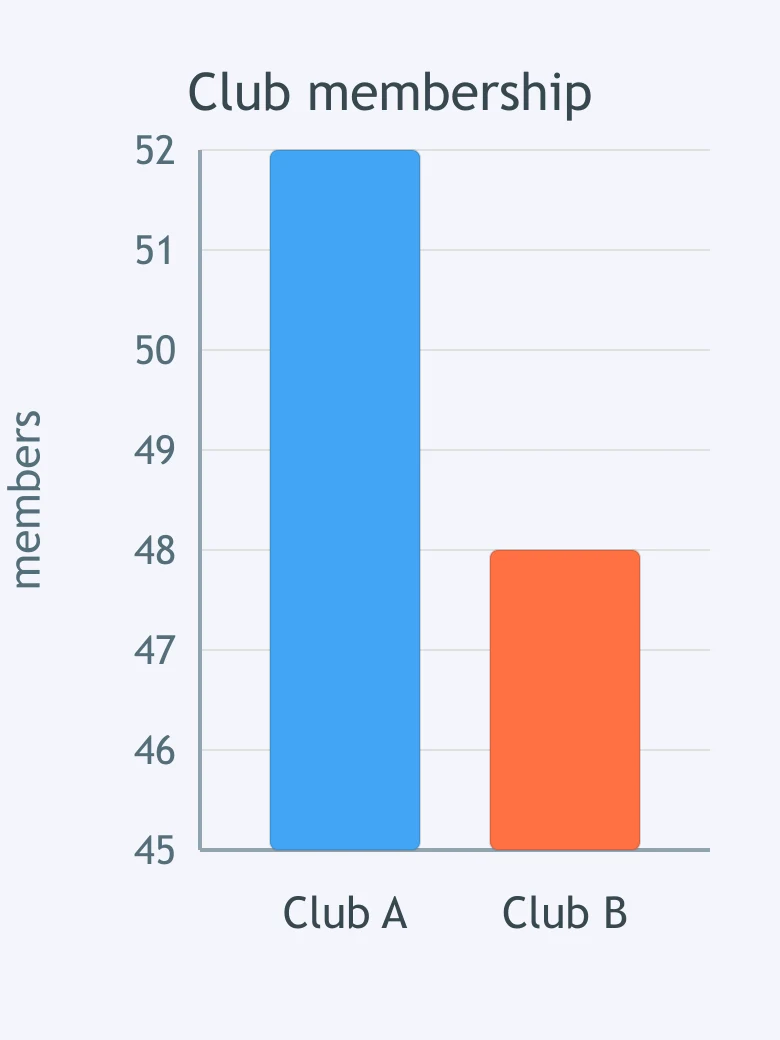
A bar graph compares membership in two clubs. What makes the graph misleading?
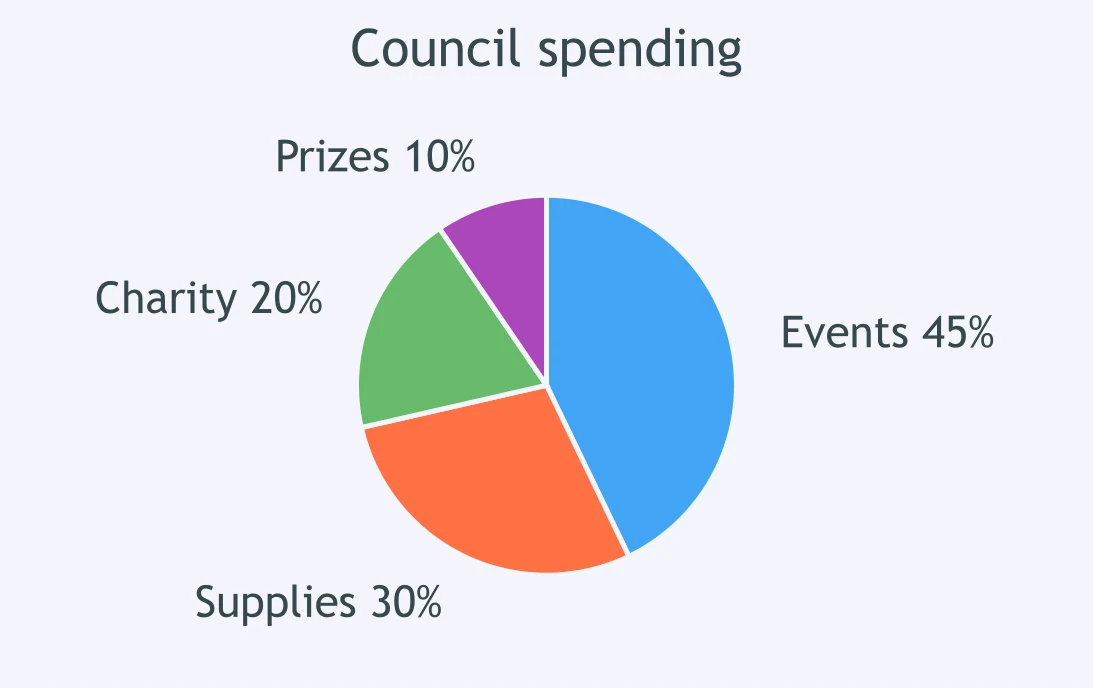
A pie chart shows how a student council spent its budget. What makes the chart misleading?
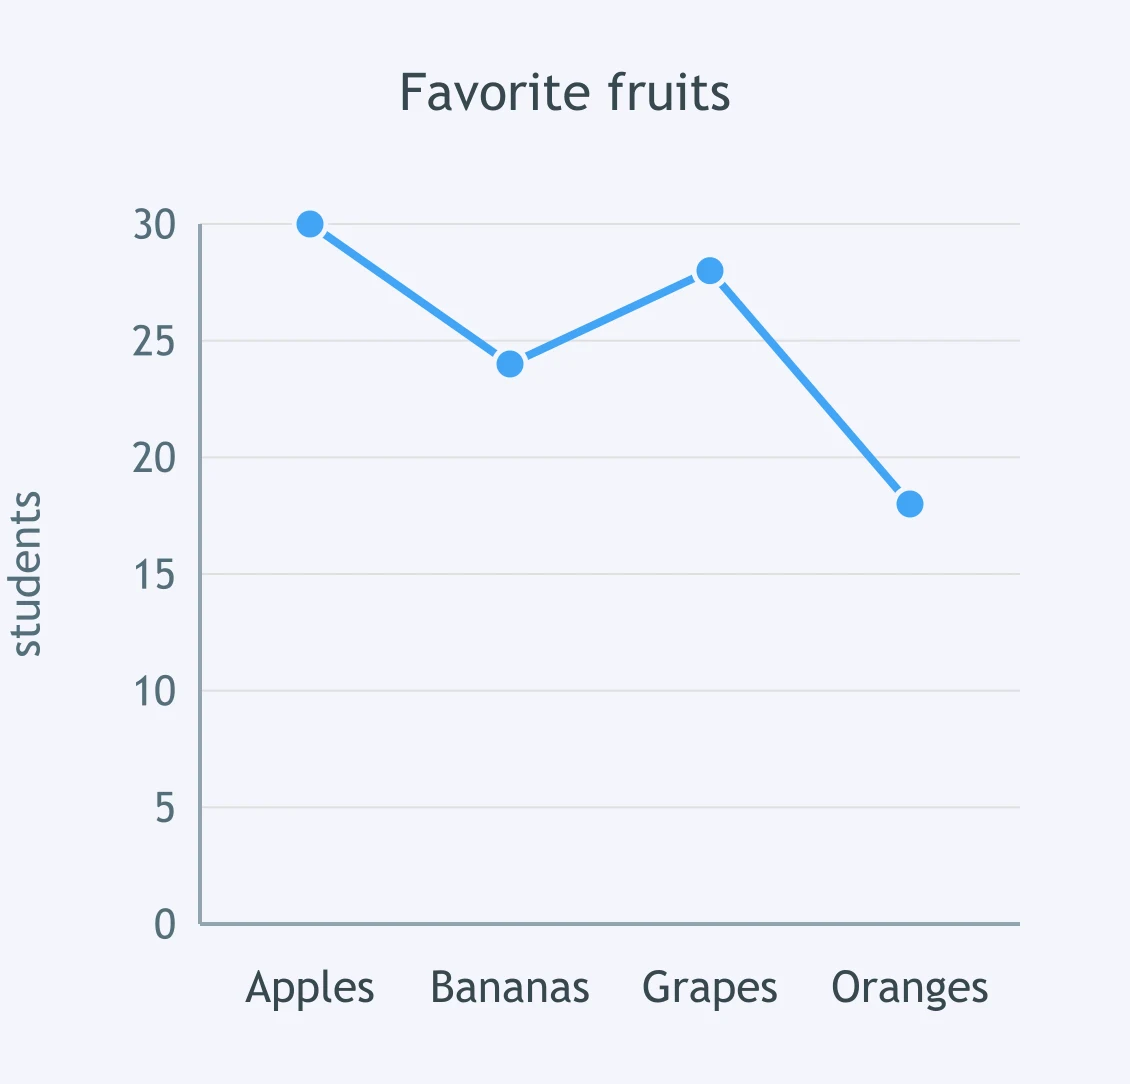
A line graph shows counts of favorite fruits by category. What is misleading about using this line graph?
Crack the passcode before the zombies get in.
Answer, then swat bugs for bonus points.
Race through questions at your own speed.
Same question on every screen. Fastest wins.

Pick a tile, answer, hit bonuses and steals.
The Normal Model Unit Review
40 questions