Loading
by BlastRoom
Read market graphs to identify shifts, movements, and new equilibria.
#us_hs_economics
30 questions
One question set, multiple game modes. Tap any game to see it in action. Not sure which to pick?
Answer to place stones and capture territory.
Outrun the snow together.
Earn blasts, then hunt the other team.
Answer to earn energy, then climb.

The class blasts through walls together.
Bid on mystery lots. Most money wins.
Sell tours. Nice, standard, or a total scam.

Answer, restock, and serve the rush.
More correct answers pulls the rope your way.
Answer, then shoot down the alien wave.
Answer, then tap to leap the frozen ridge.
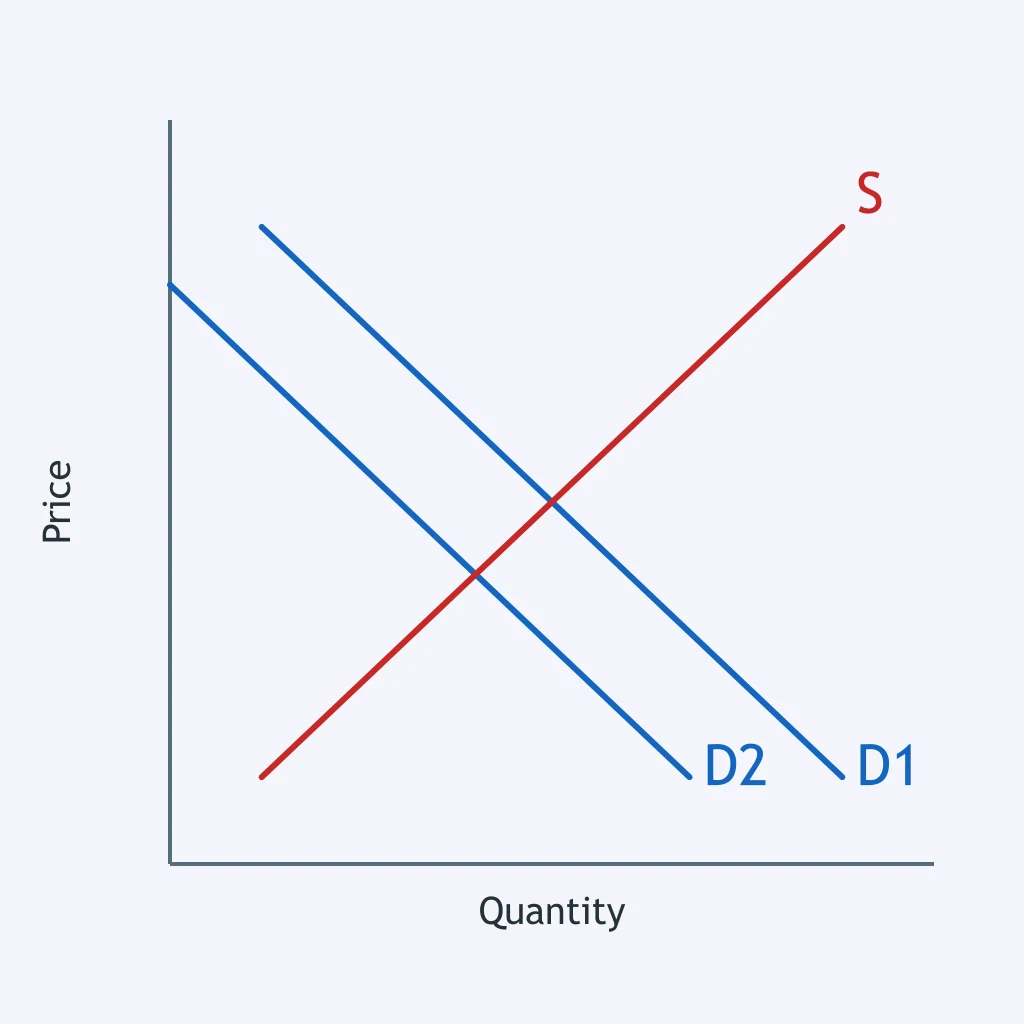
Which event best explains the shift from D1 to D2 in the electric-car graph?
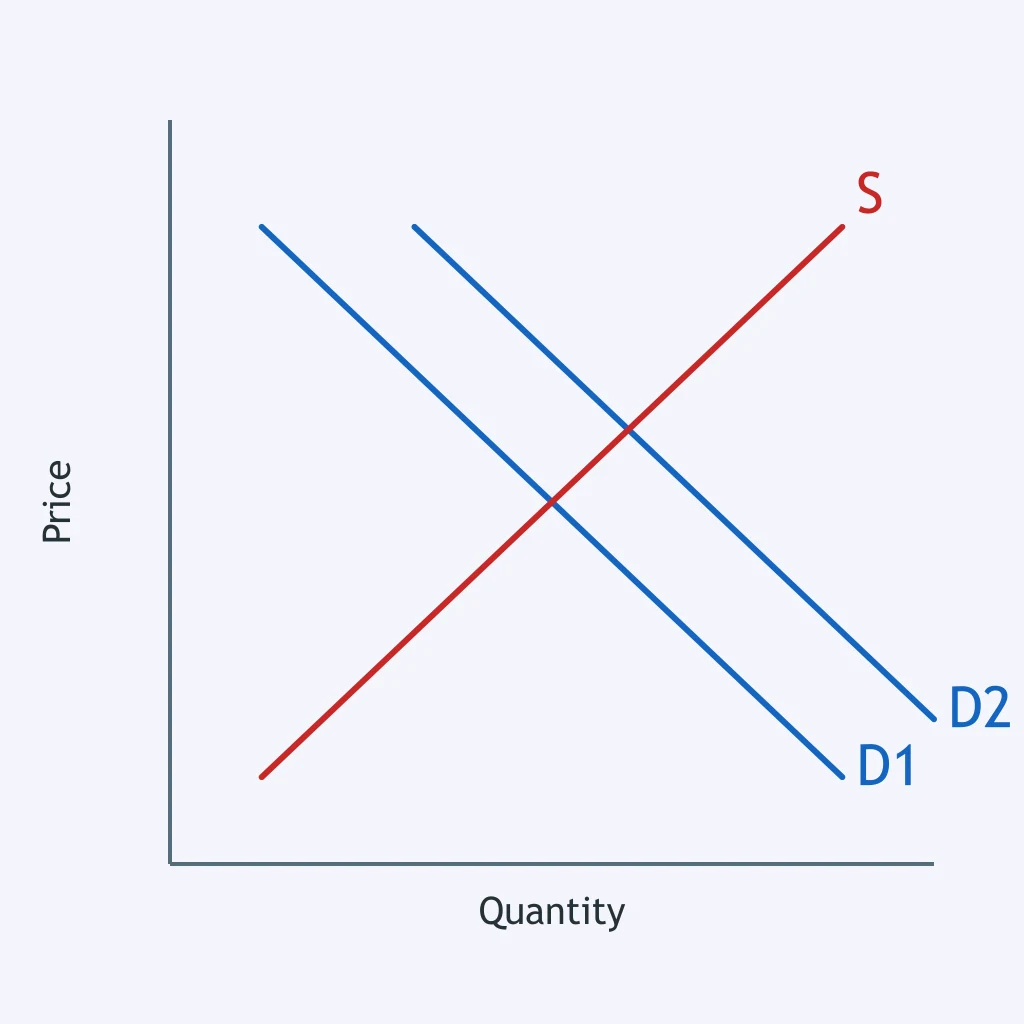
Which change could cause the shift from D1 to D2 in the orange market?
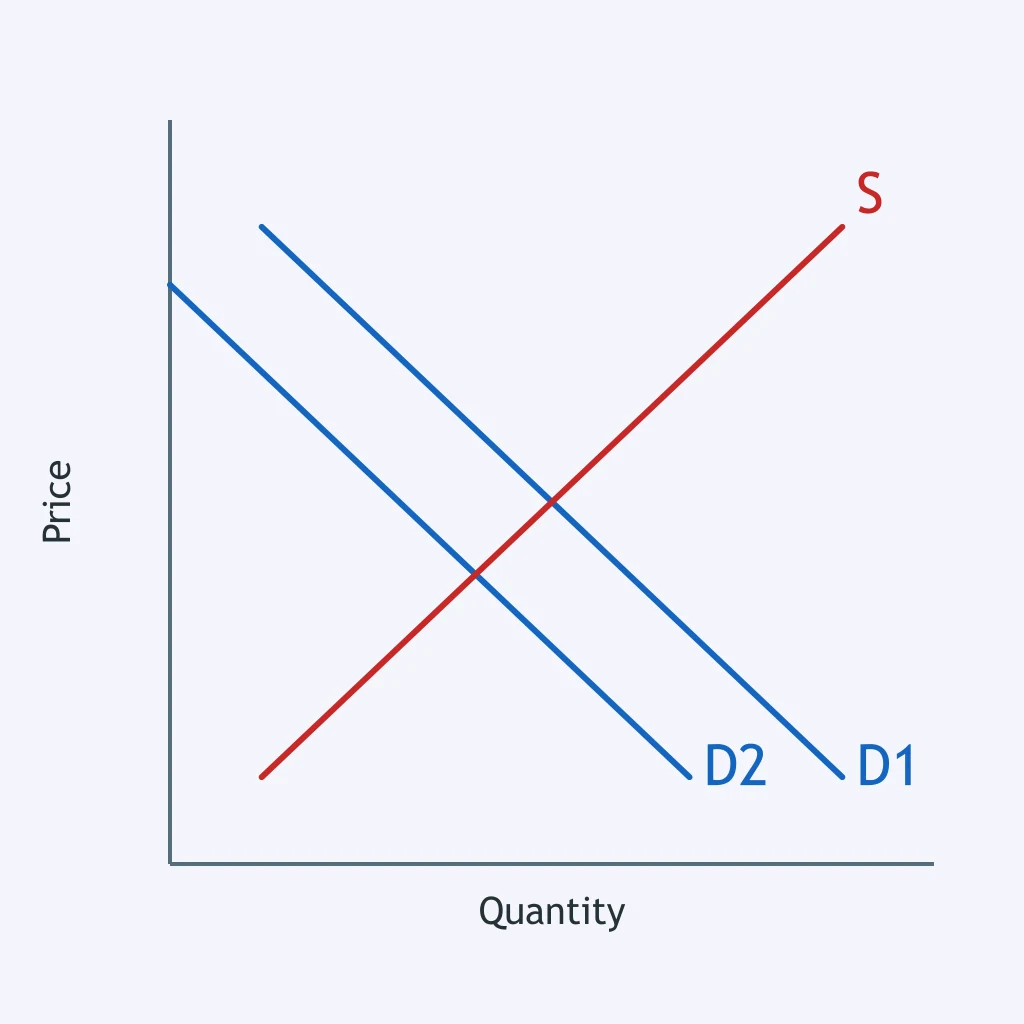
The graph for ride-share trips shows a demand shift with supply unchanged. What is a likely cause?
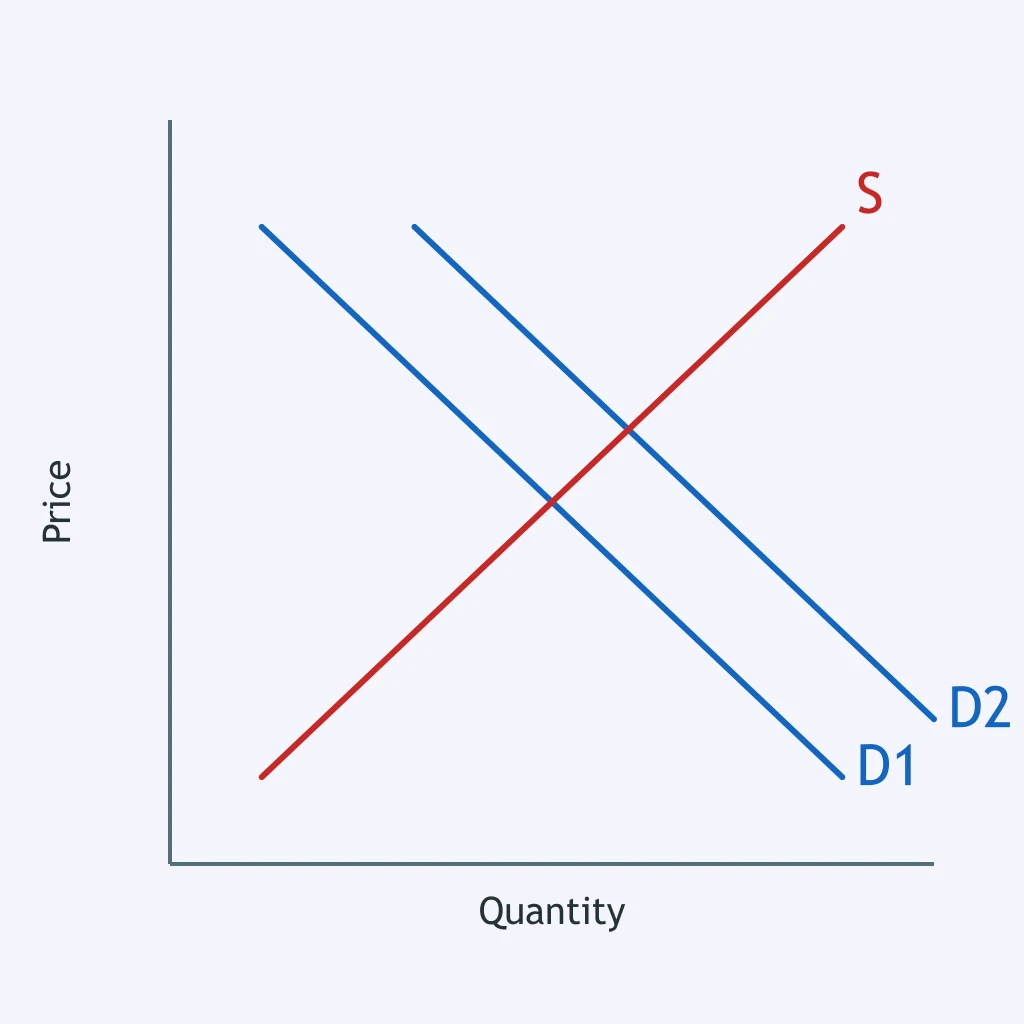
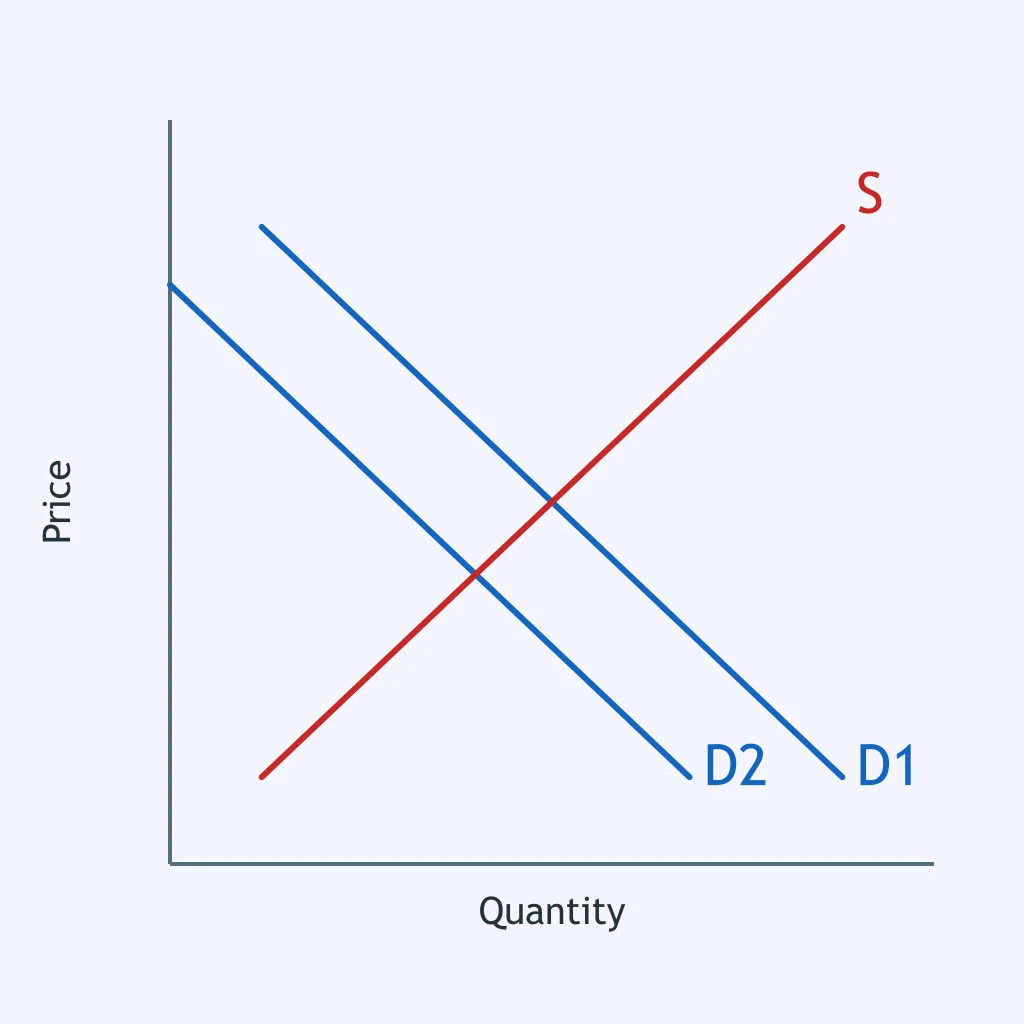
Supply is unchanged, but the demand curve for restaurant meals moves from D1 to D2. What could have caused this?
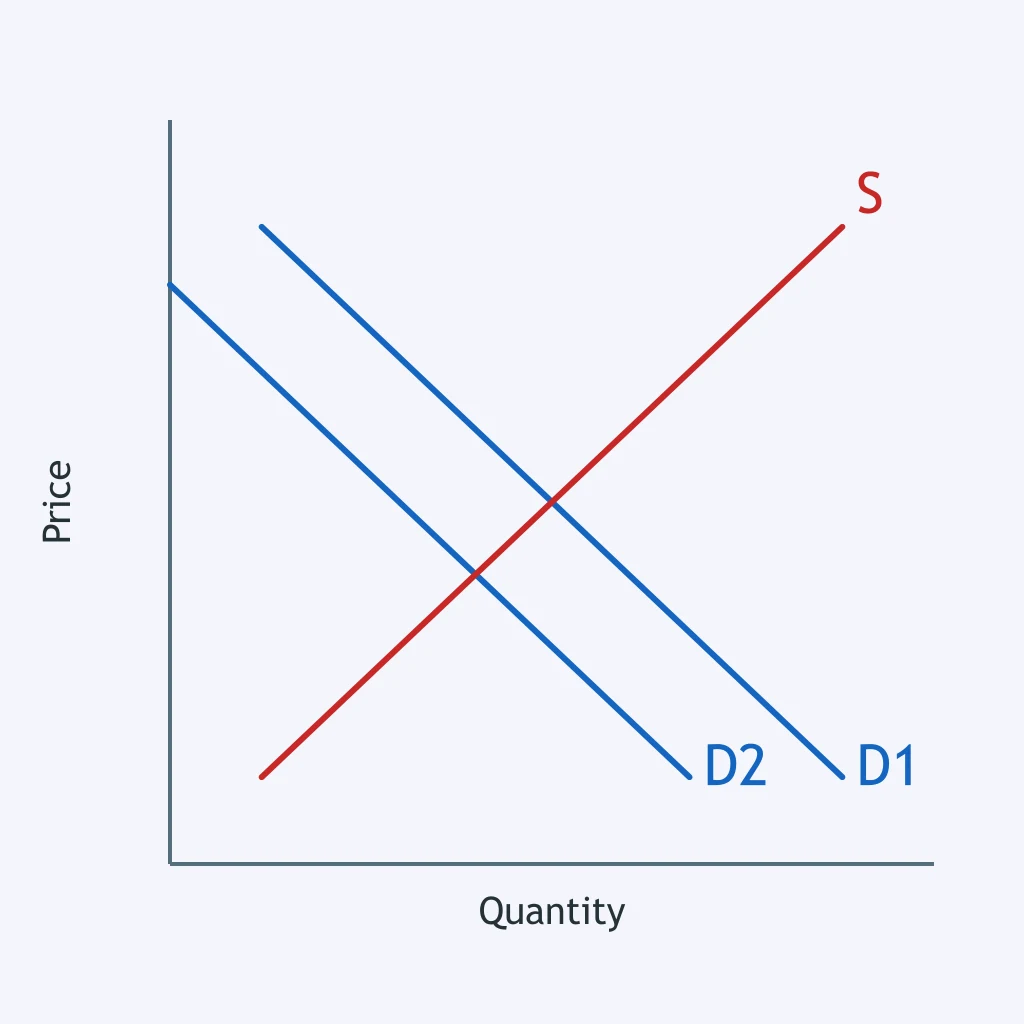
Which event best accounts for the shift from D1 to D2 in the printer graph?
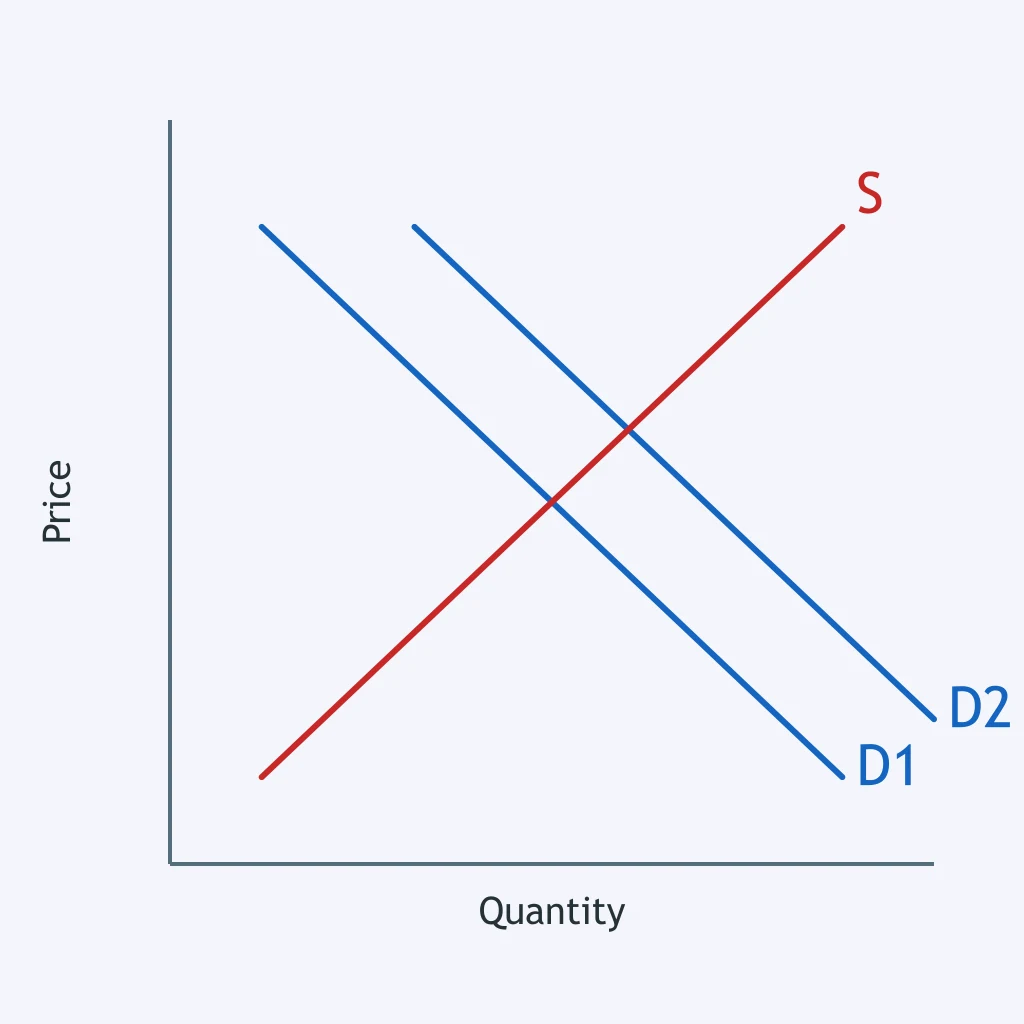
For ski rentals, the demand curve moves from D1 to D2 with no supply shift. What change most likely caused it?
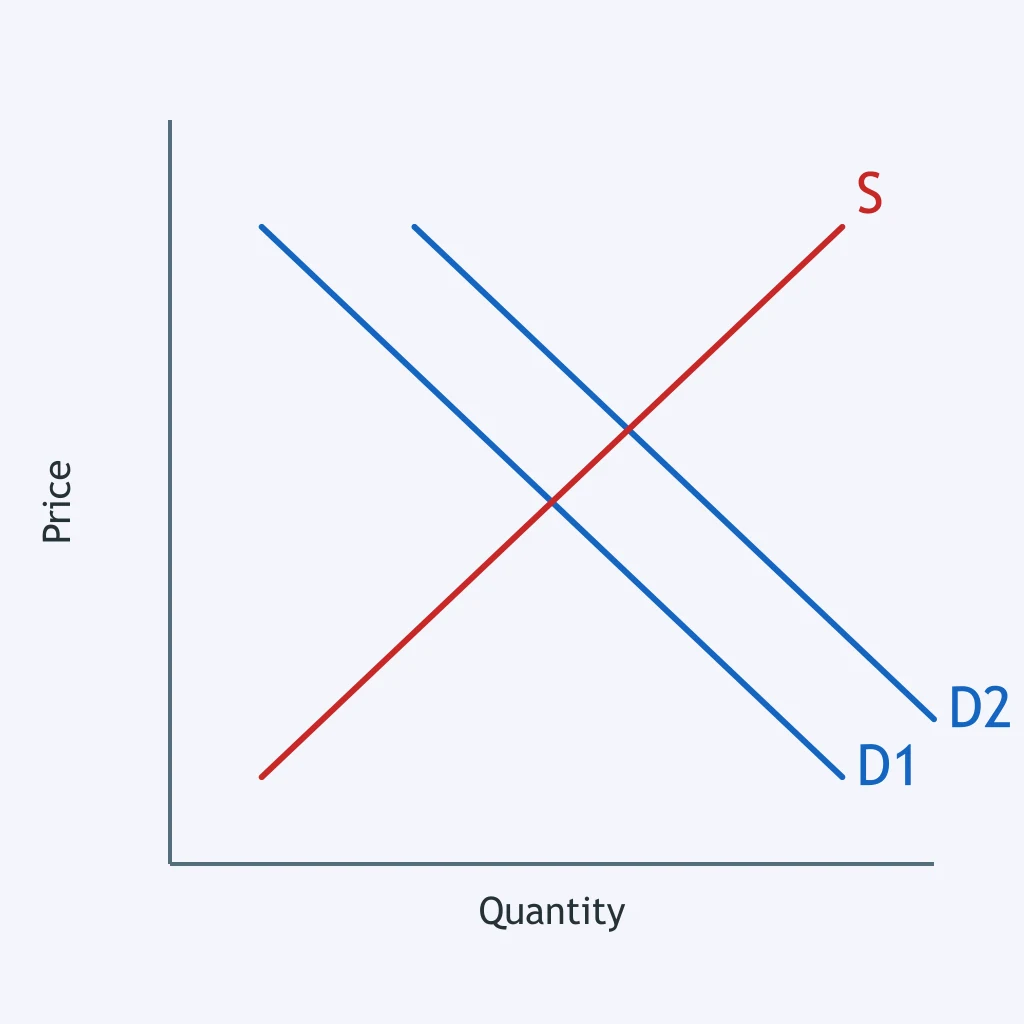
The graph shows a shift in demand for movie theater tickets with supply unchanged. Which event is the best explanation?
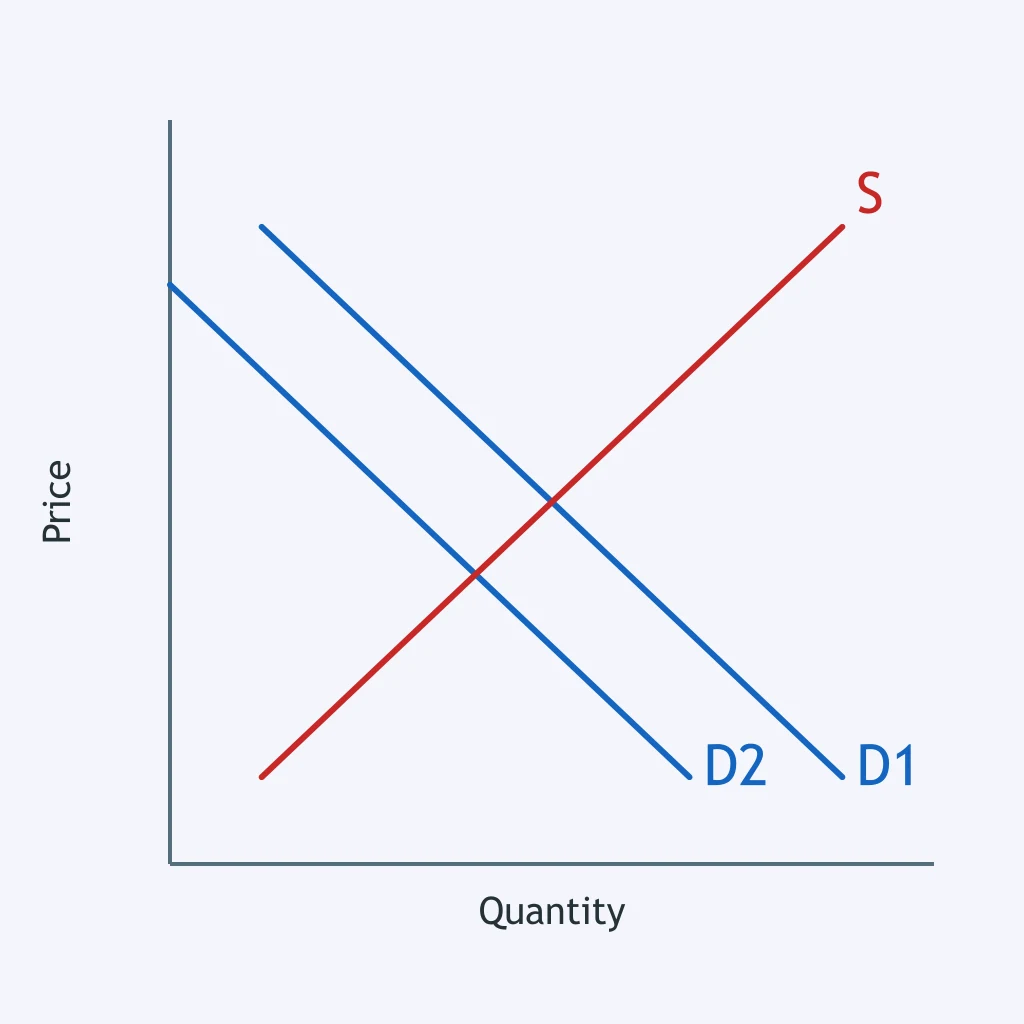
Which event could produce the shift from D1 to D2 in the market for smartphones?
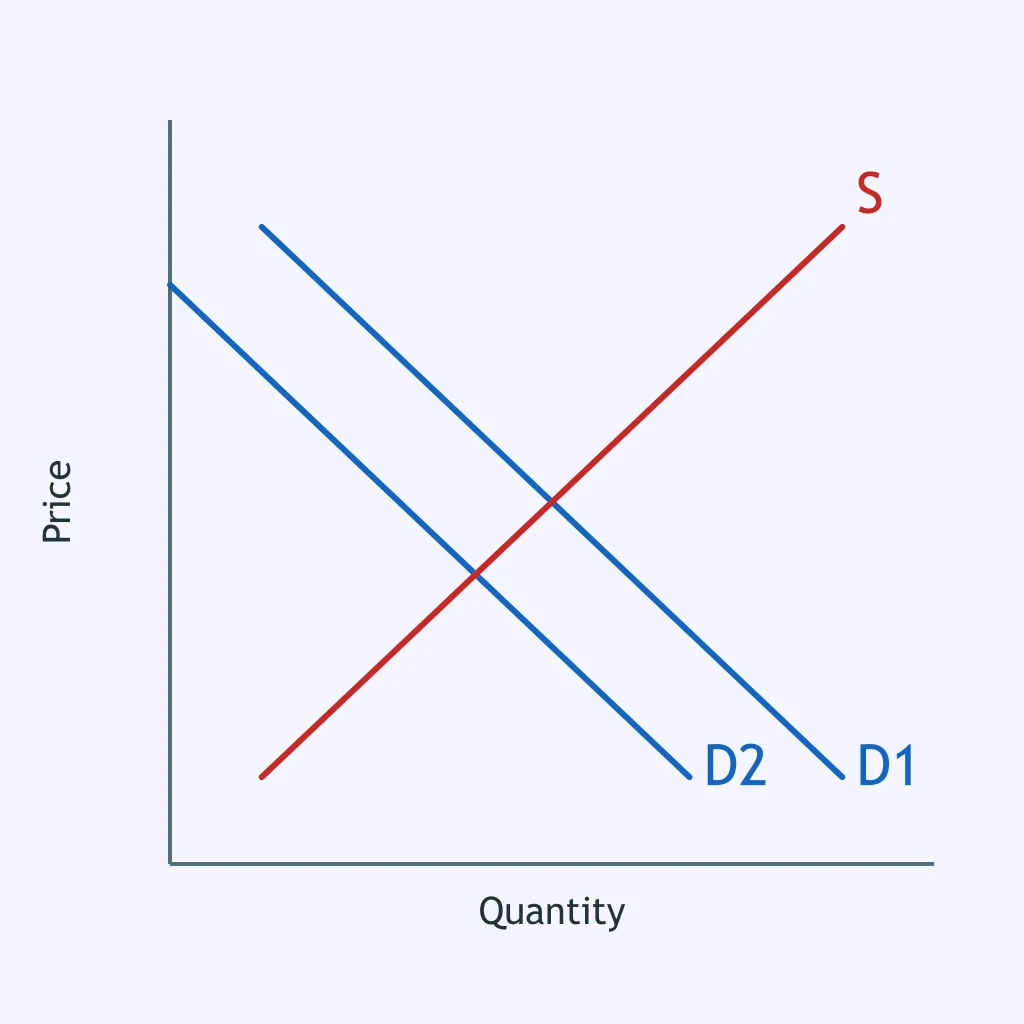
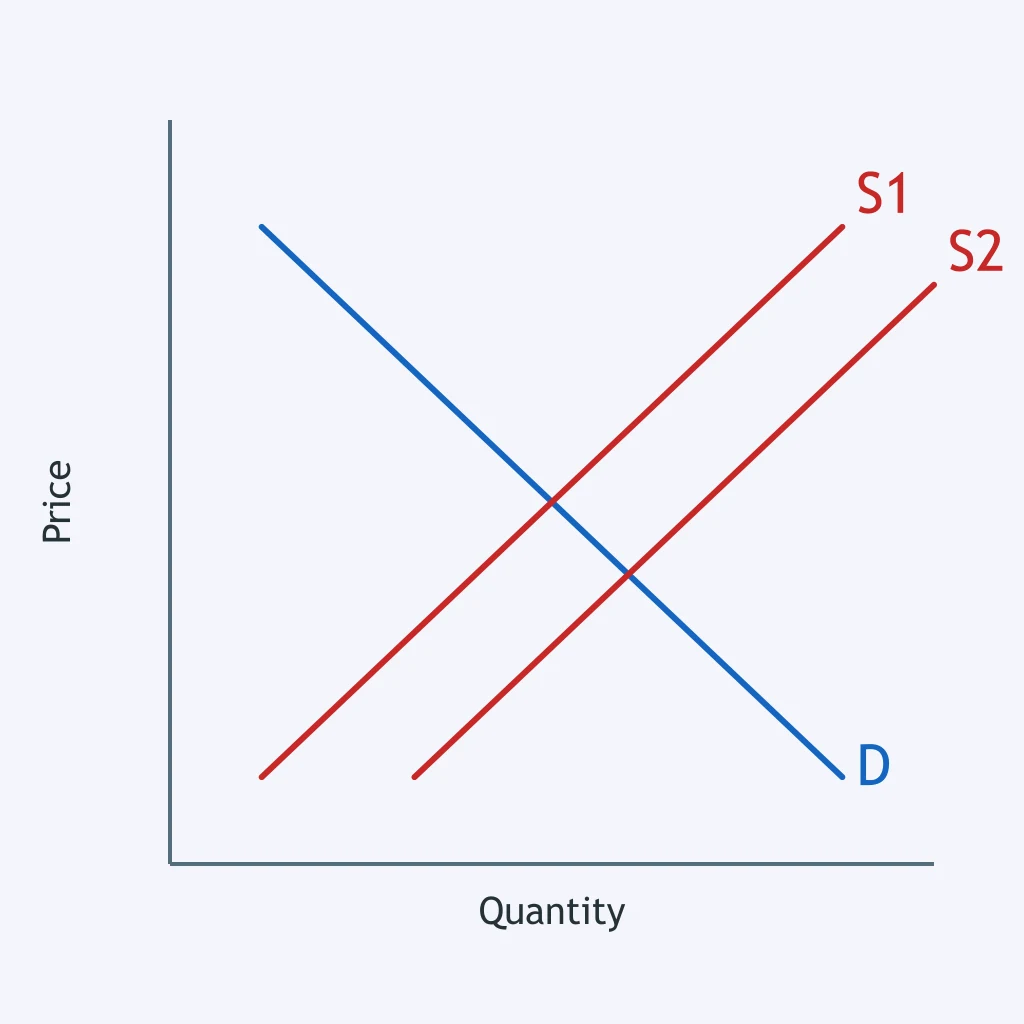
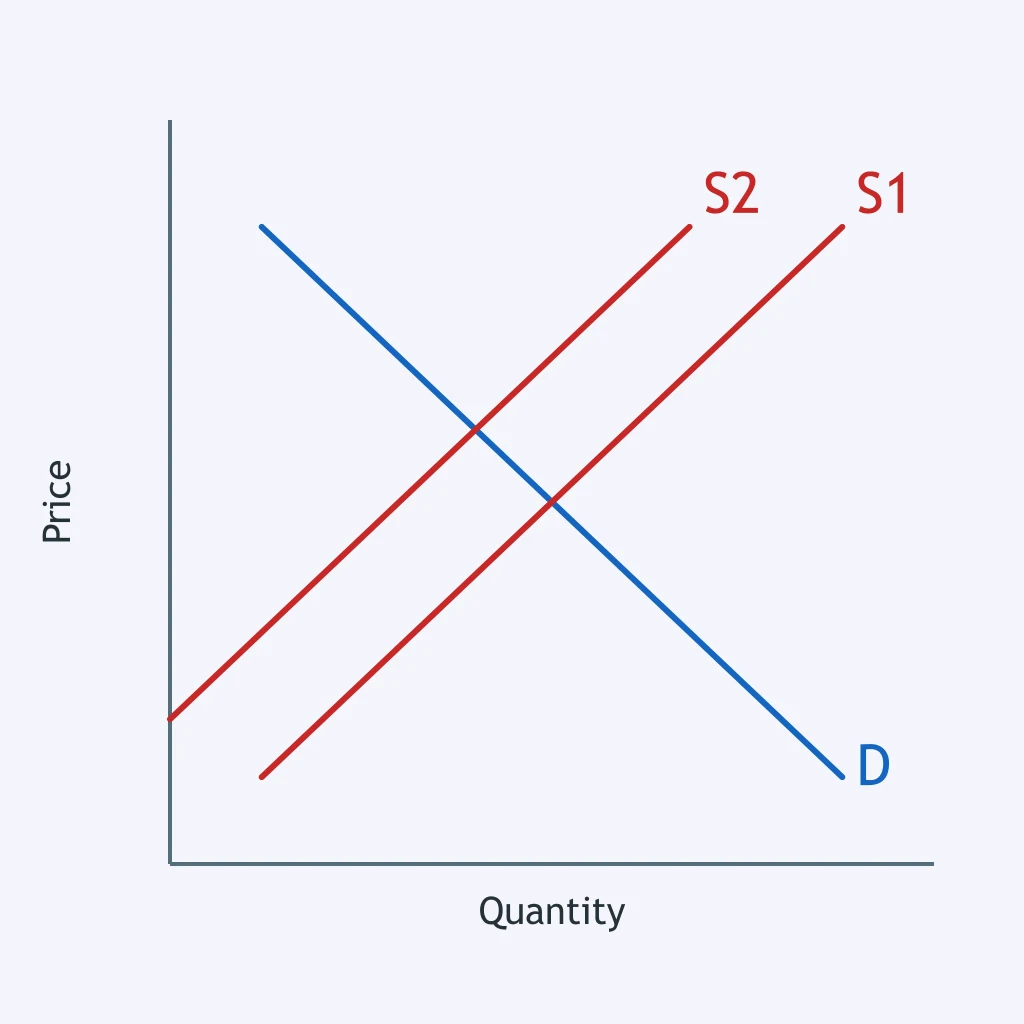
What event best explains the shift from S1 to S2 in the wheat graph?
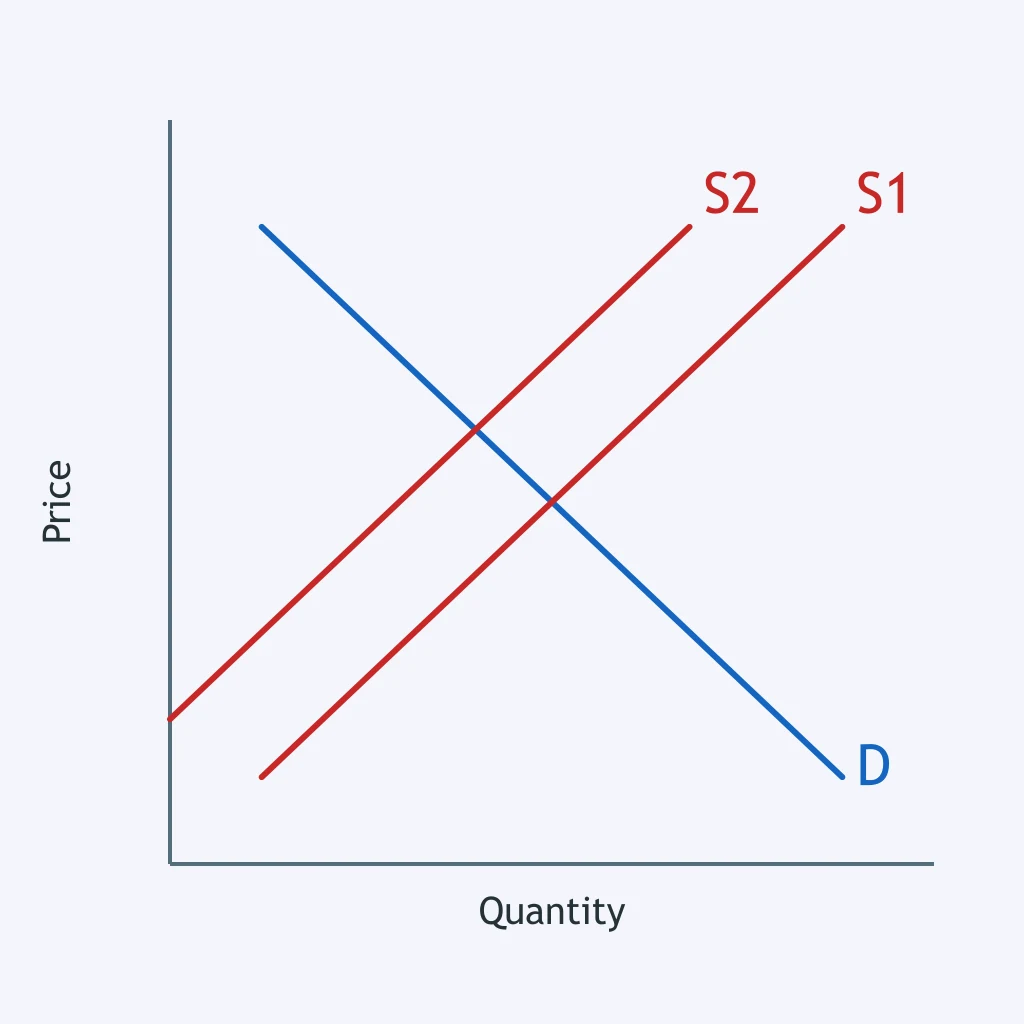
Which change would cause the shift from S1 to S2 in the laptop market graph?
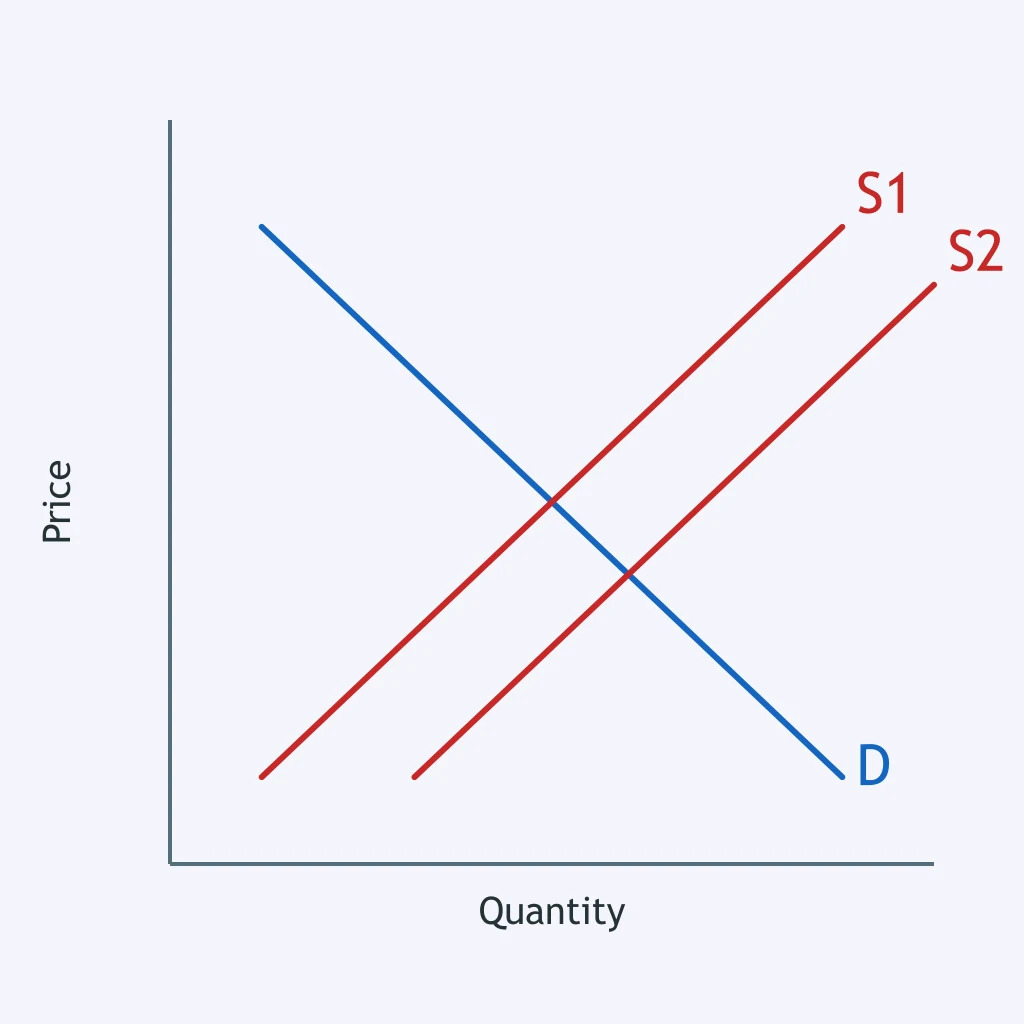
Which event could cause the shift from S1 to S2 in the coffee graph?
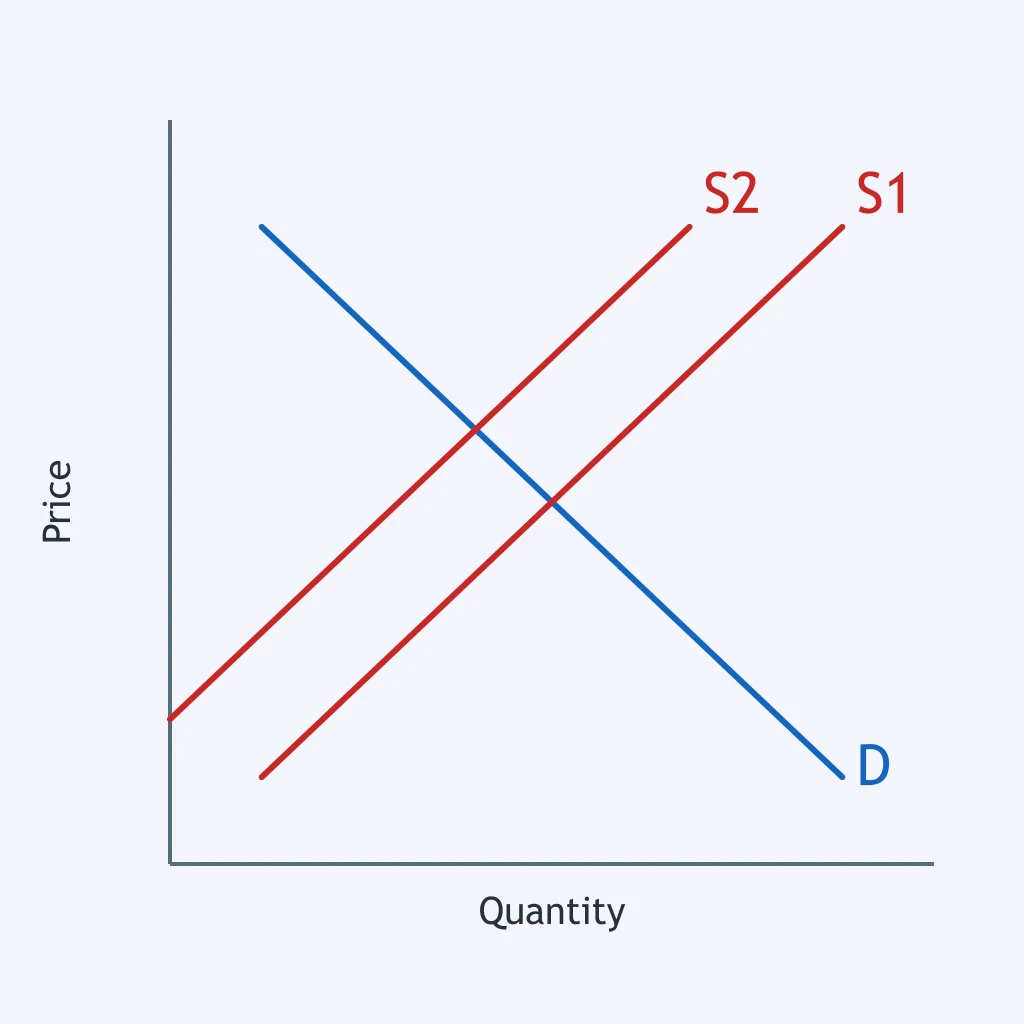
What is the most likely cause of the shift from S1 to S2 in the market for solar panels?
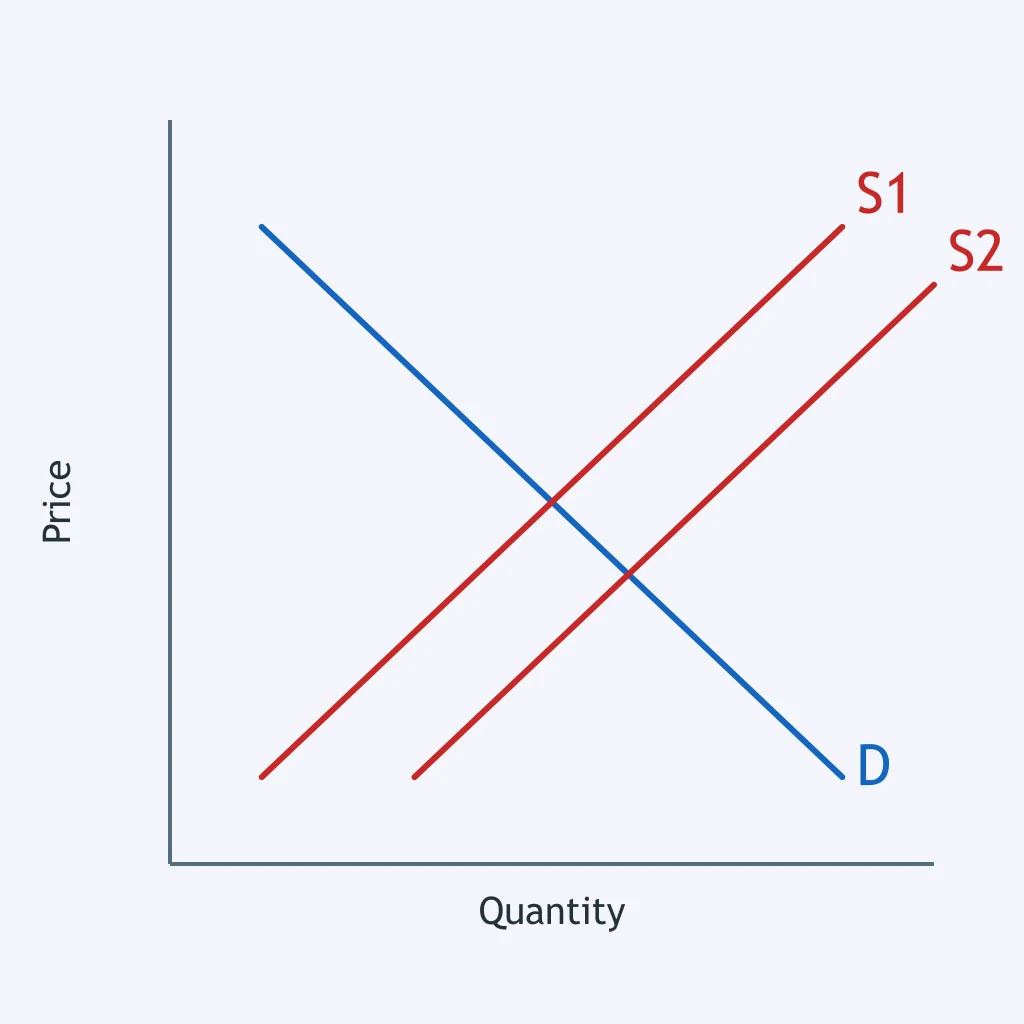
What change best explains the shift from S1 to S2 in the cigarette graph?
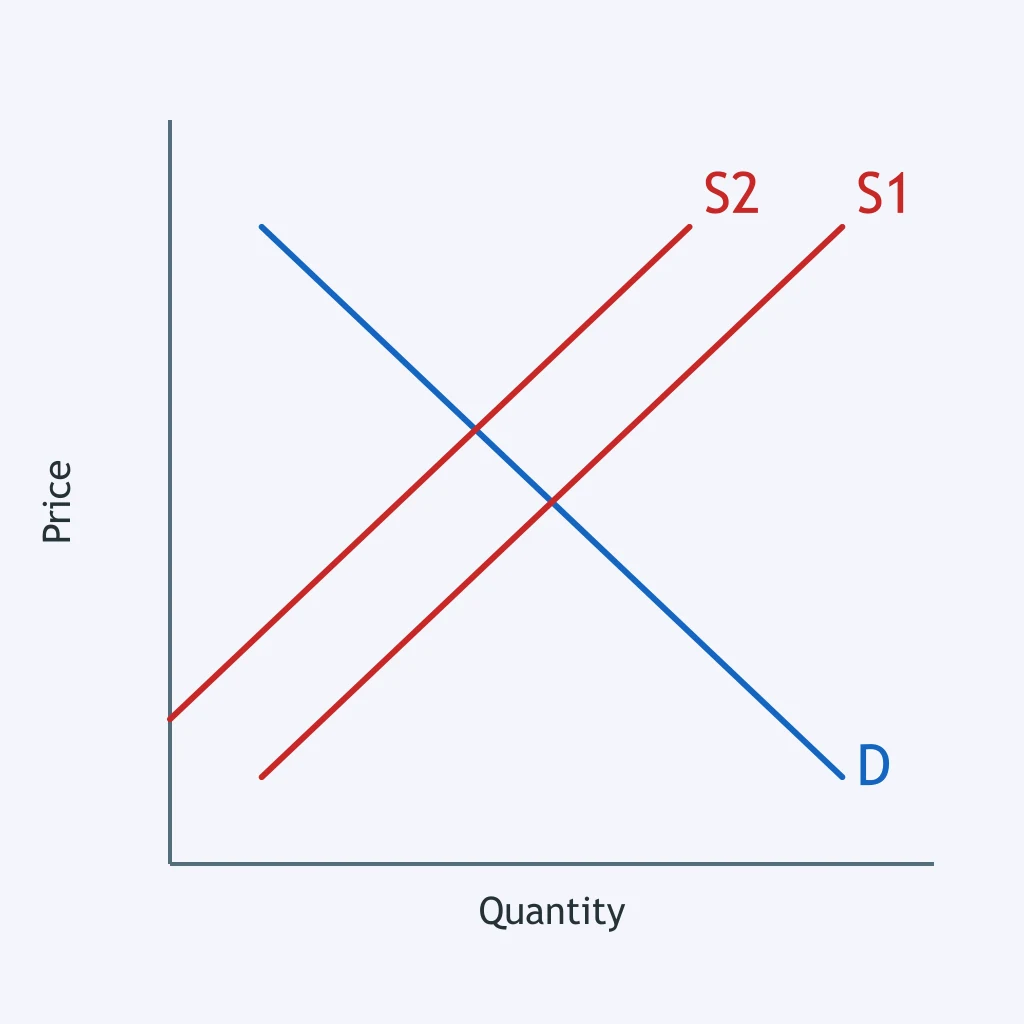
Which event could cause the shift from S1 to S2 in the pizza graph?
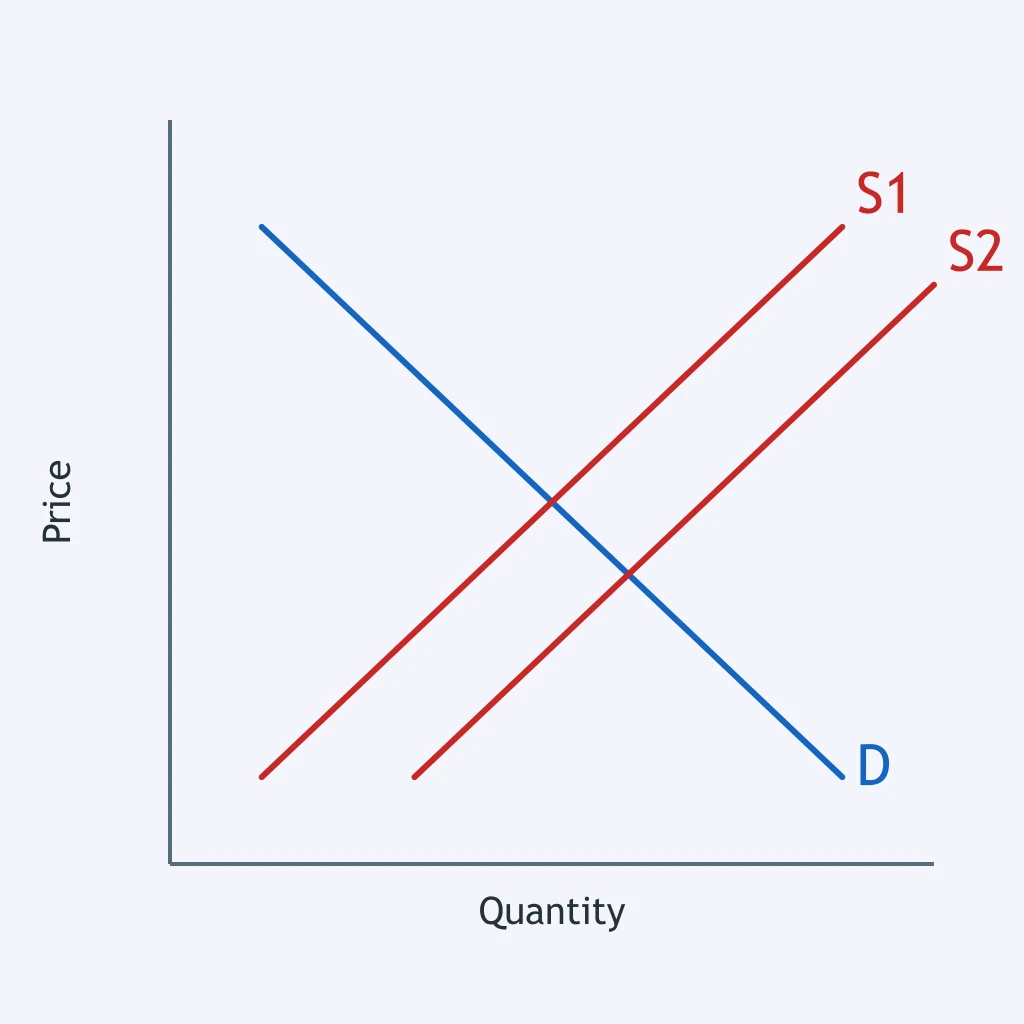
What is a likely explanation for the shift from S1 to S2 in the bicycle graph?
The graph shows a demand shift for concert tickets with supply unchanged. What happens to the new equilibrium?
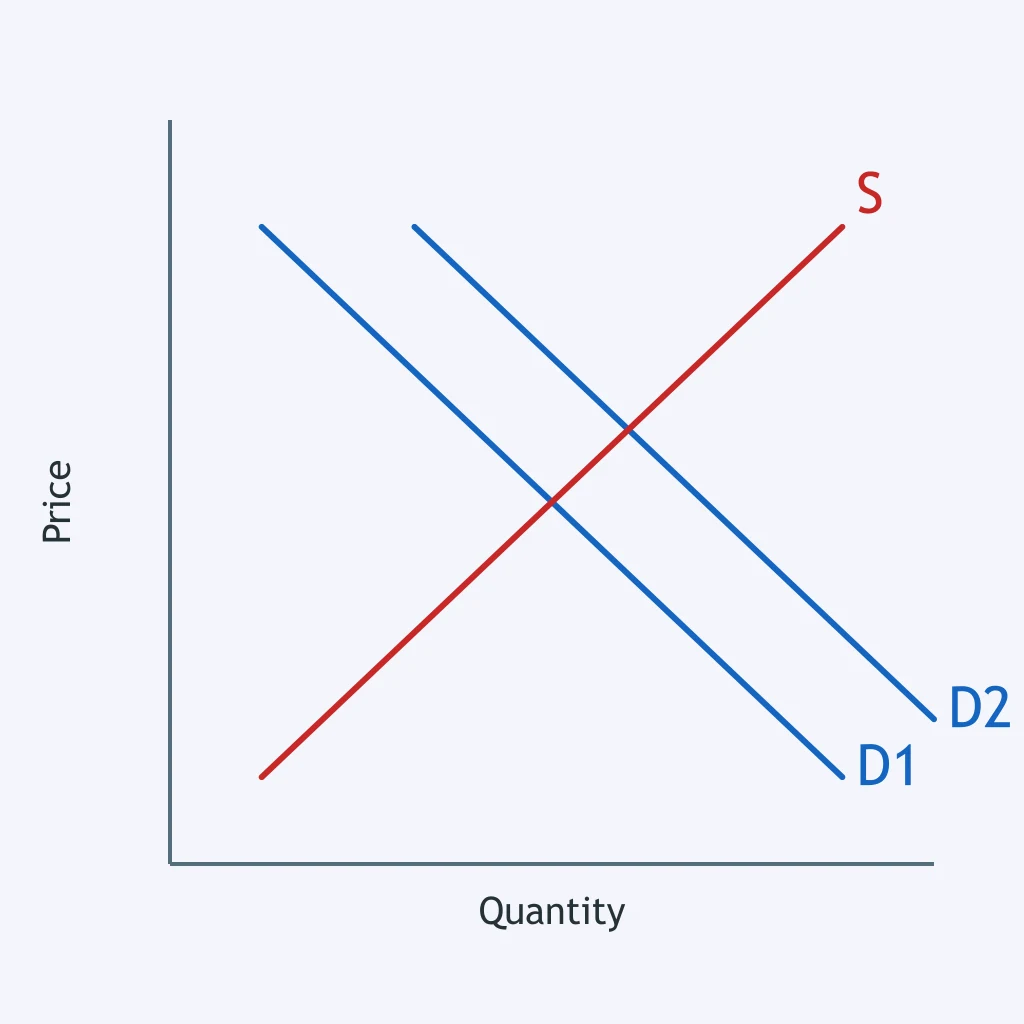
For oranges, the figure shows a demand shift with supply unchanged. How does equilibrium change?
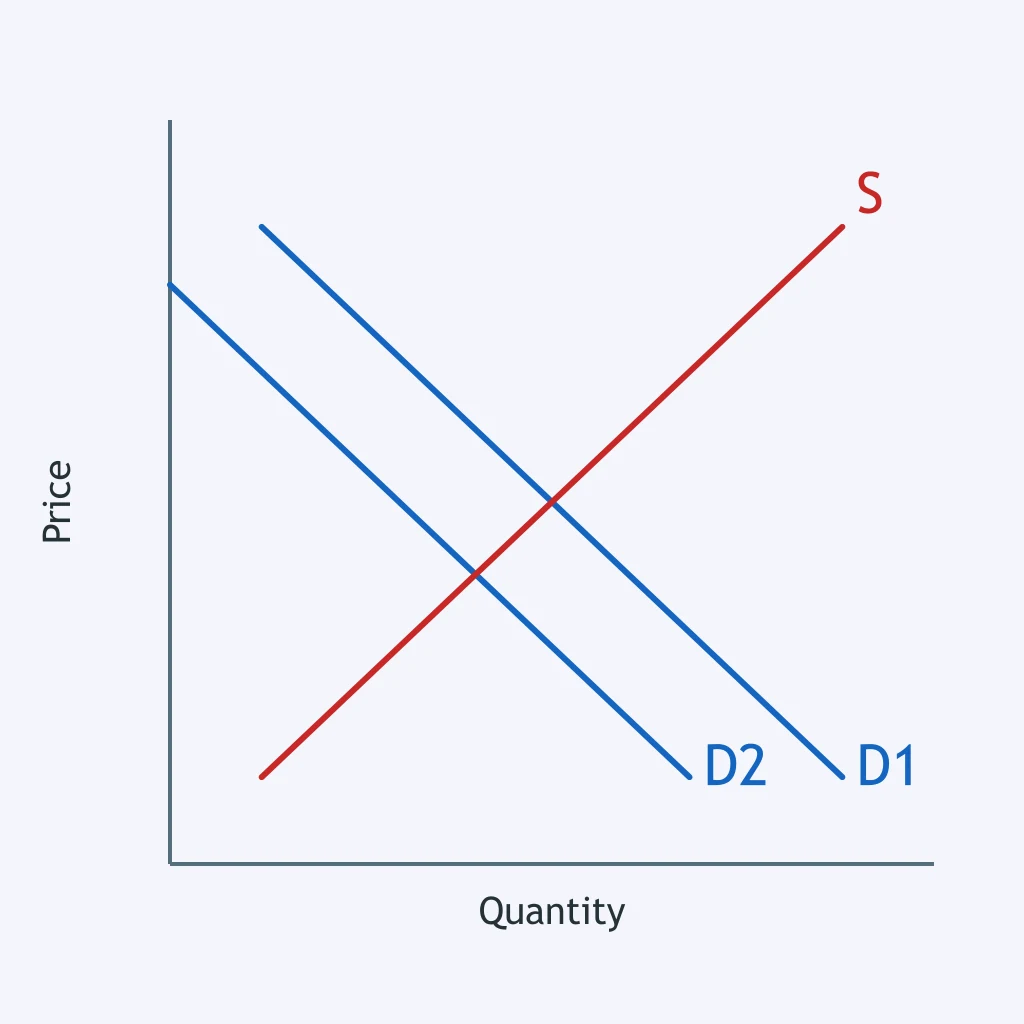
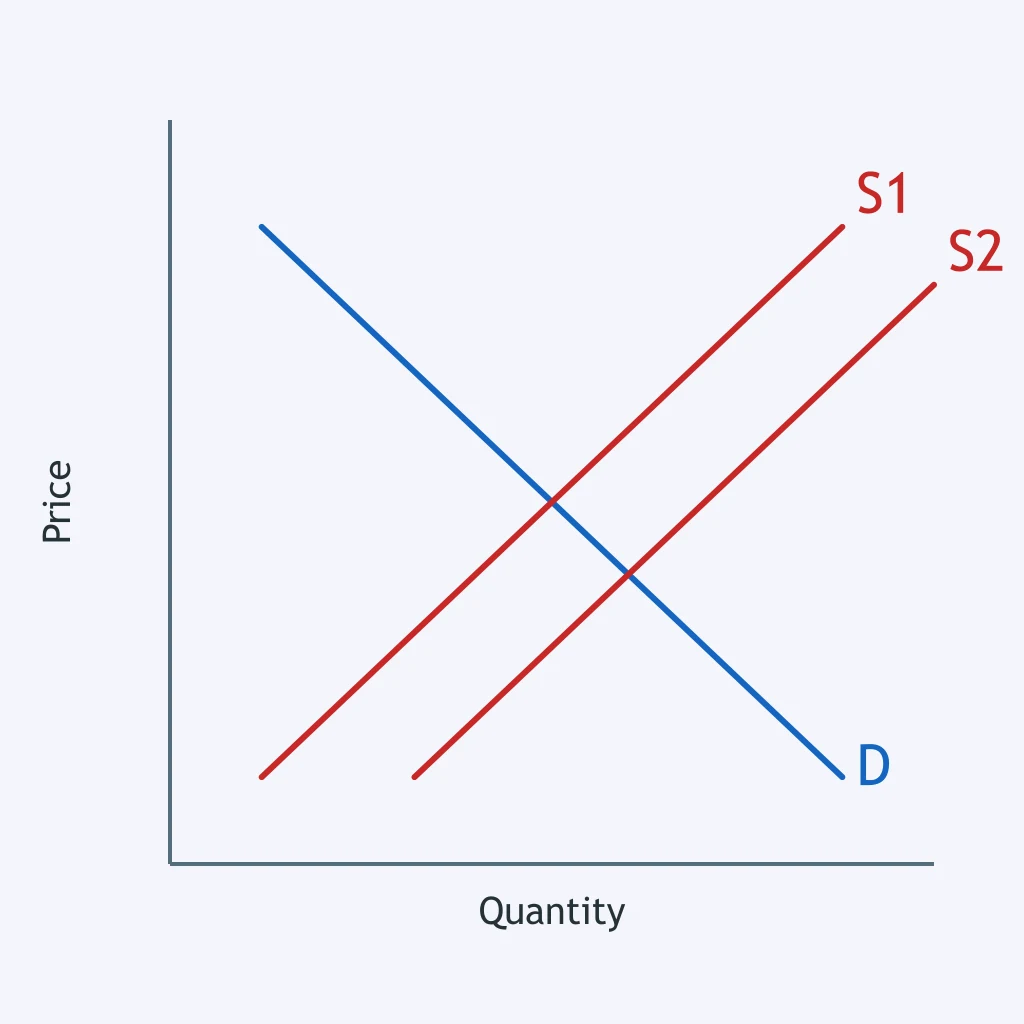
In the laptop market, the graph shows a supply shift with demand unchanged. What is the new equilibrium outcome?
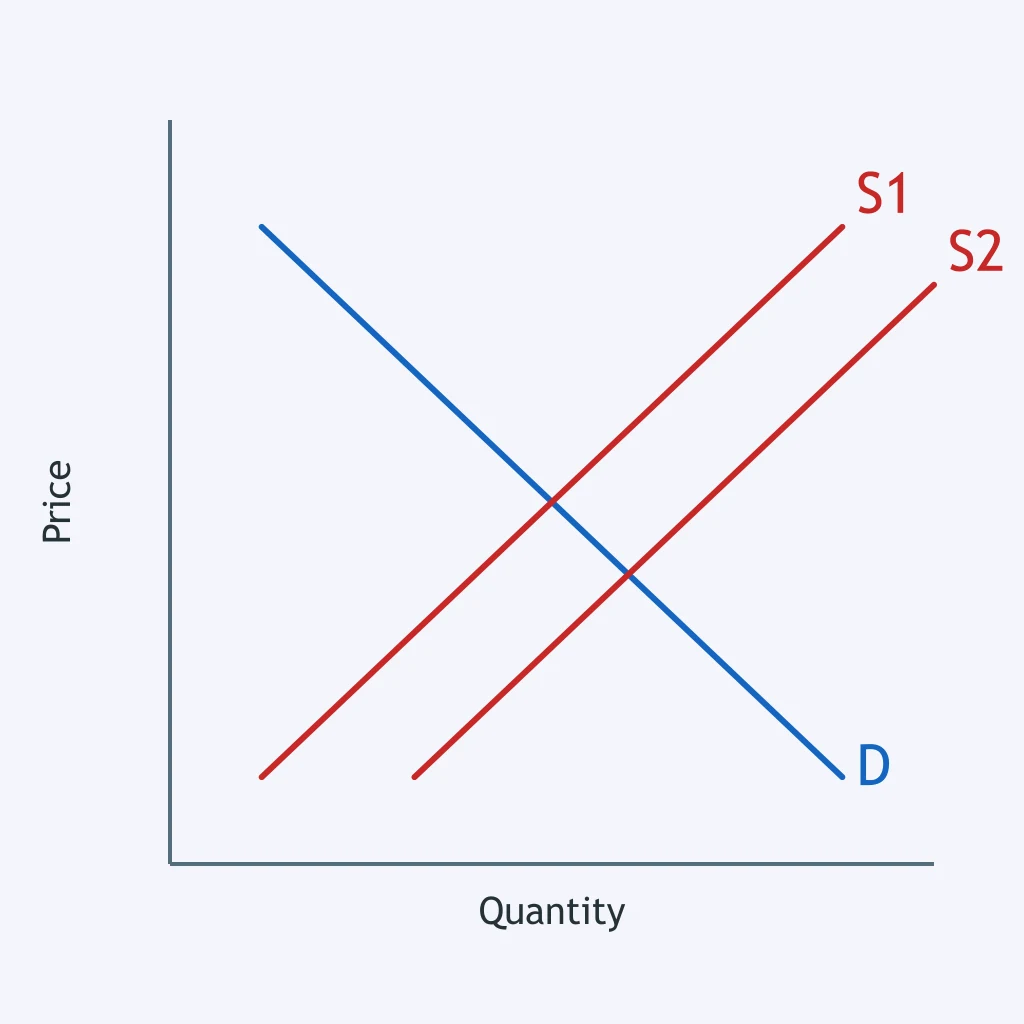
The market for fresh peaches shows a supply shift with demand unchanged. What happens at the new equilibrium?
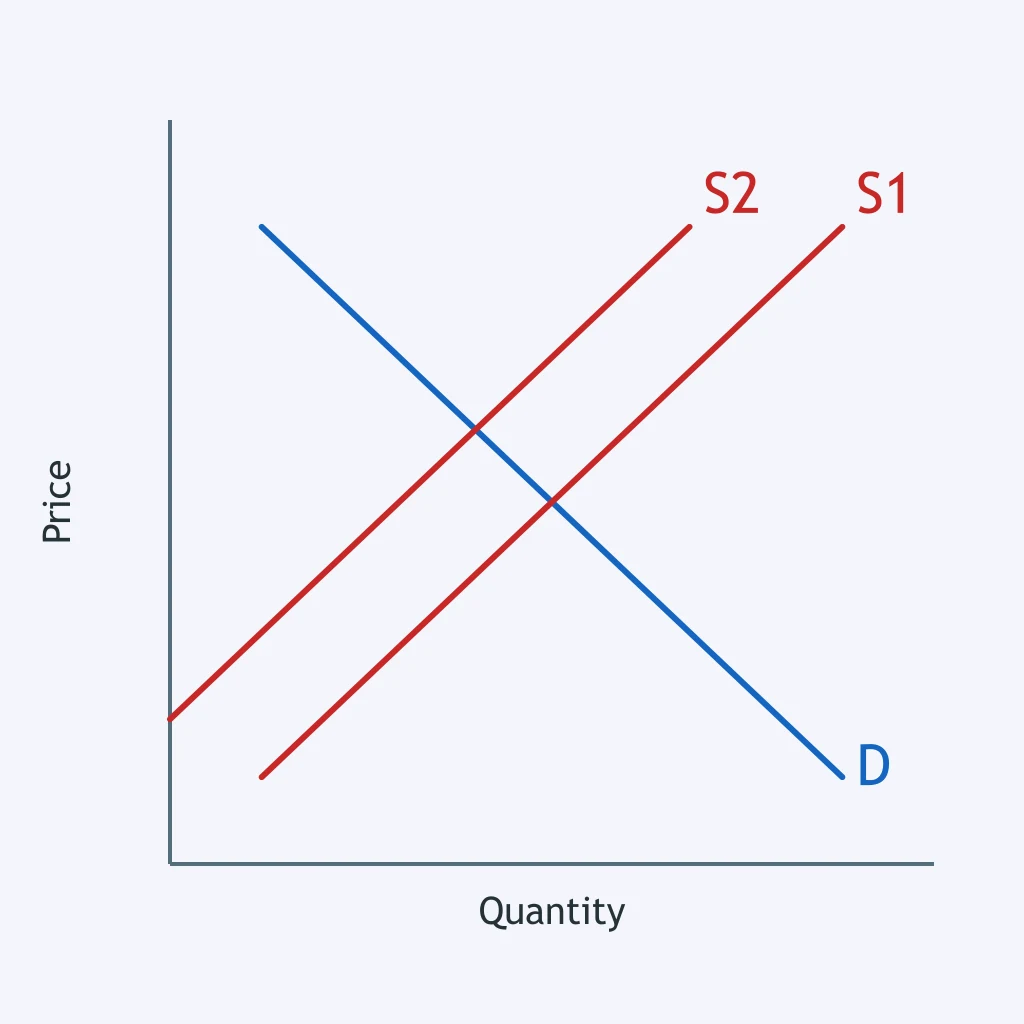
The graph for gym memberships shows a demand shift with supply unchanged. What happens to equilibrium price and quantity?
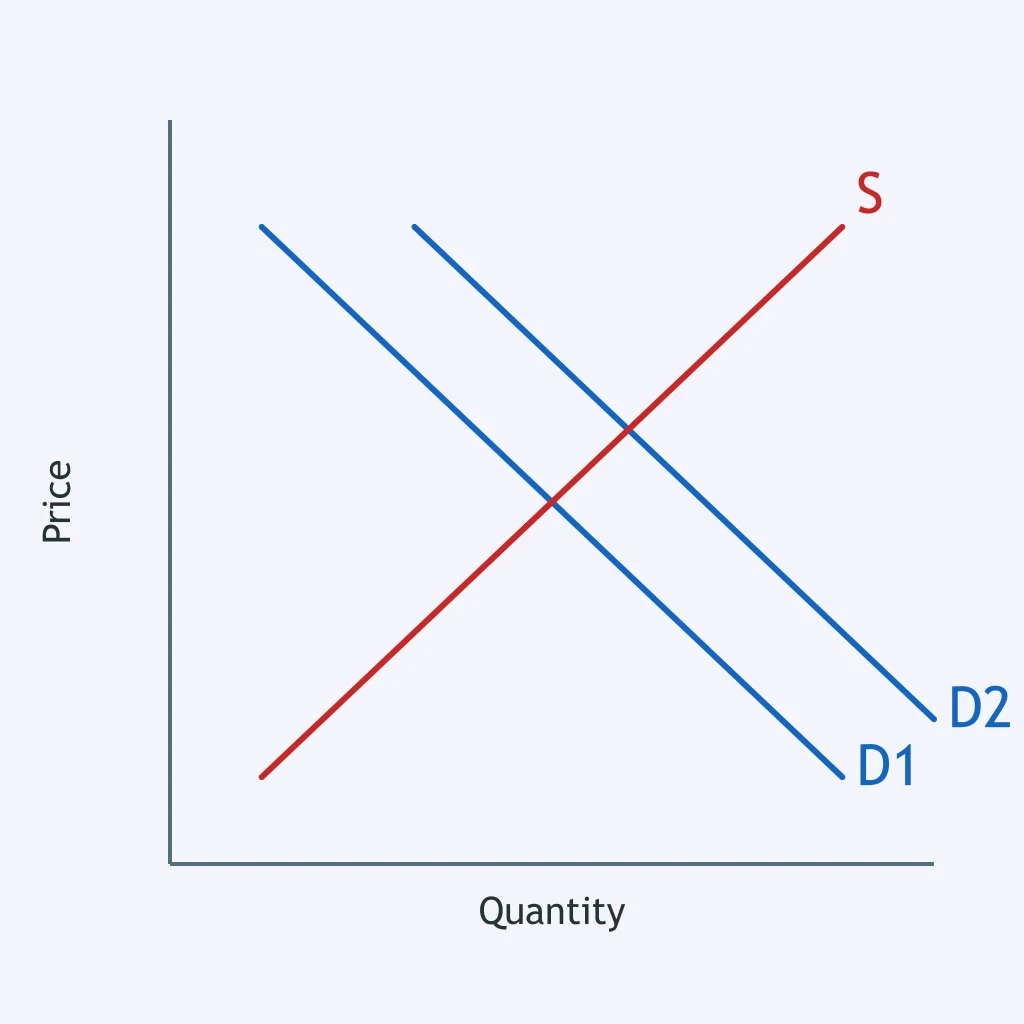
The graph for bottled water shows a supply shift with demand unchanged. Which equilibrium change follows?
The figure for bus passes shows a demand shift with no supply shift. What is the likely equilibrium result?
The graph for eggs shows a supply shift with demand unchanged. What happens to equilibrium?
What does the arrow on the graph show?
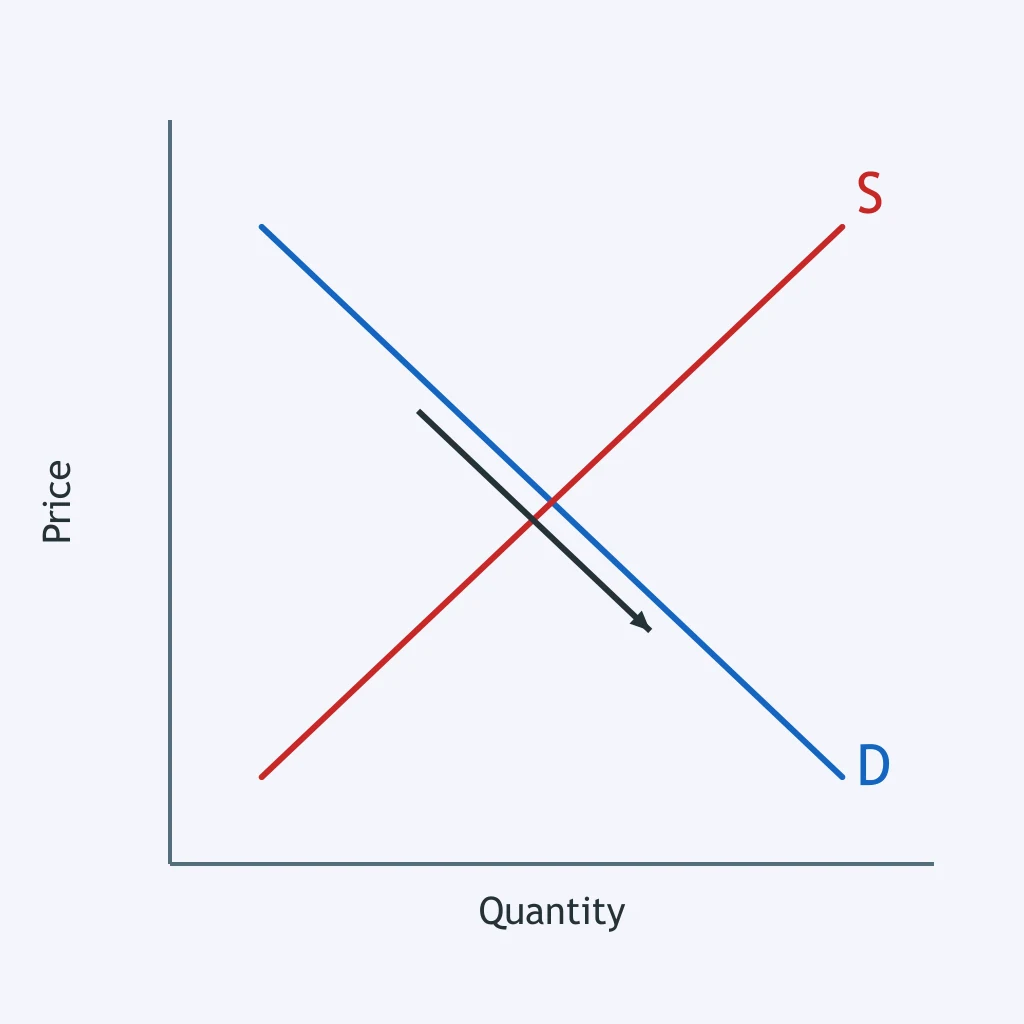
How should the change shown in the figure be classified?
What does the arrow on the graph represent?
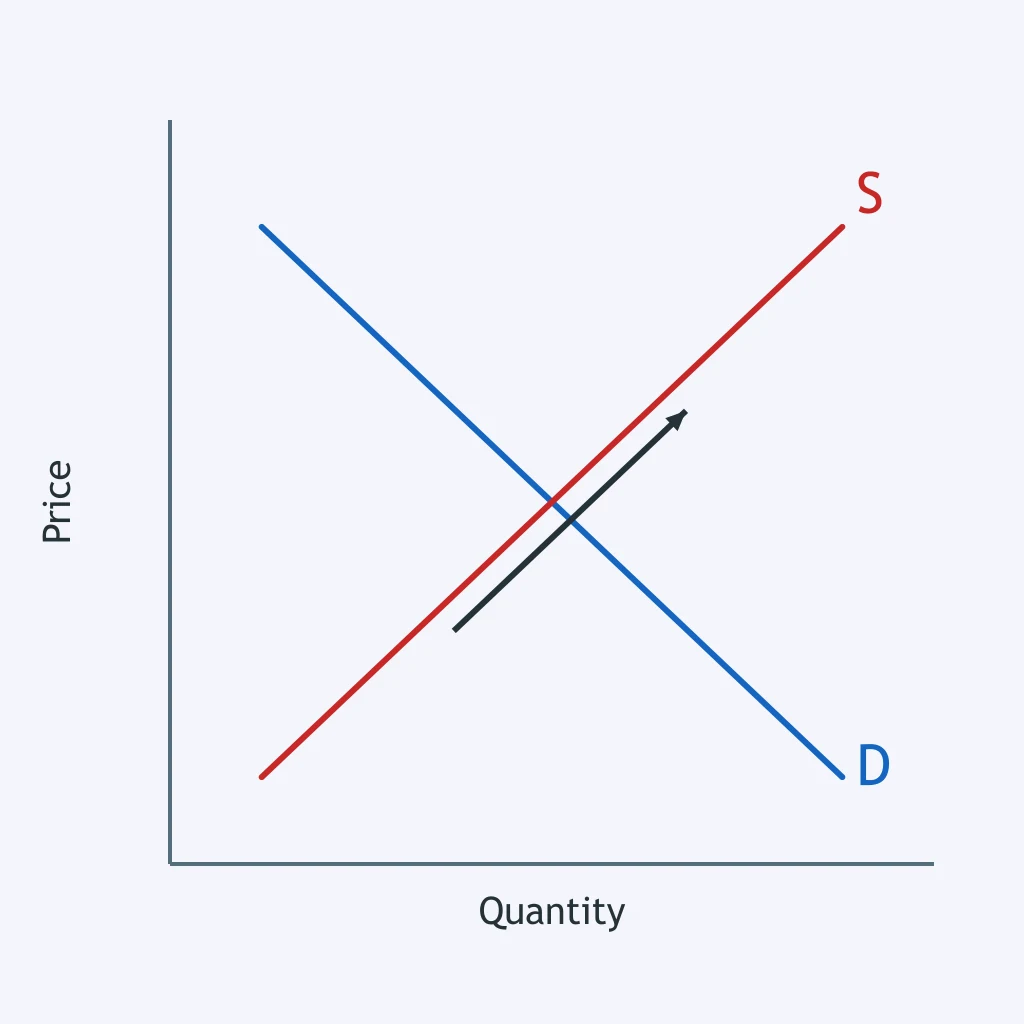
What is the change shown in the figure called?
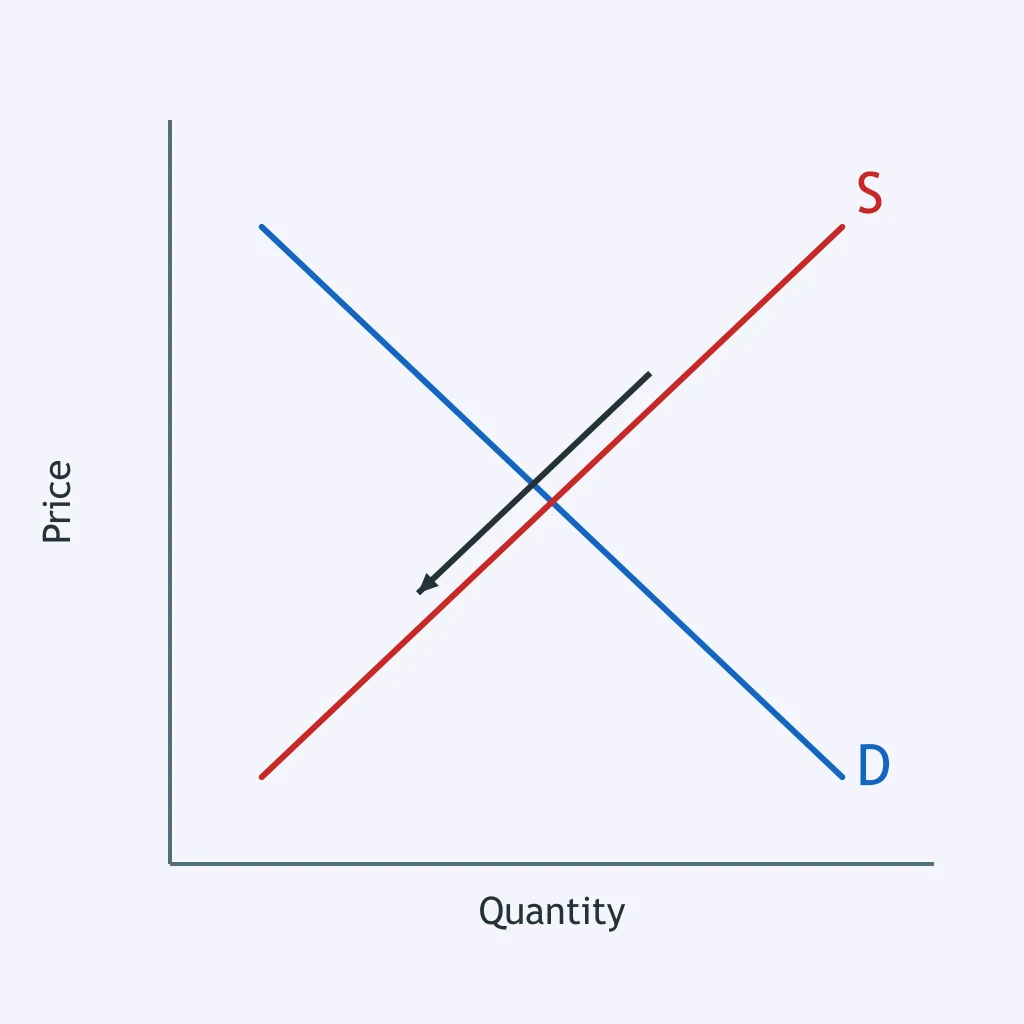
Which statement correctly describes the arrow on the graph?
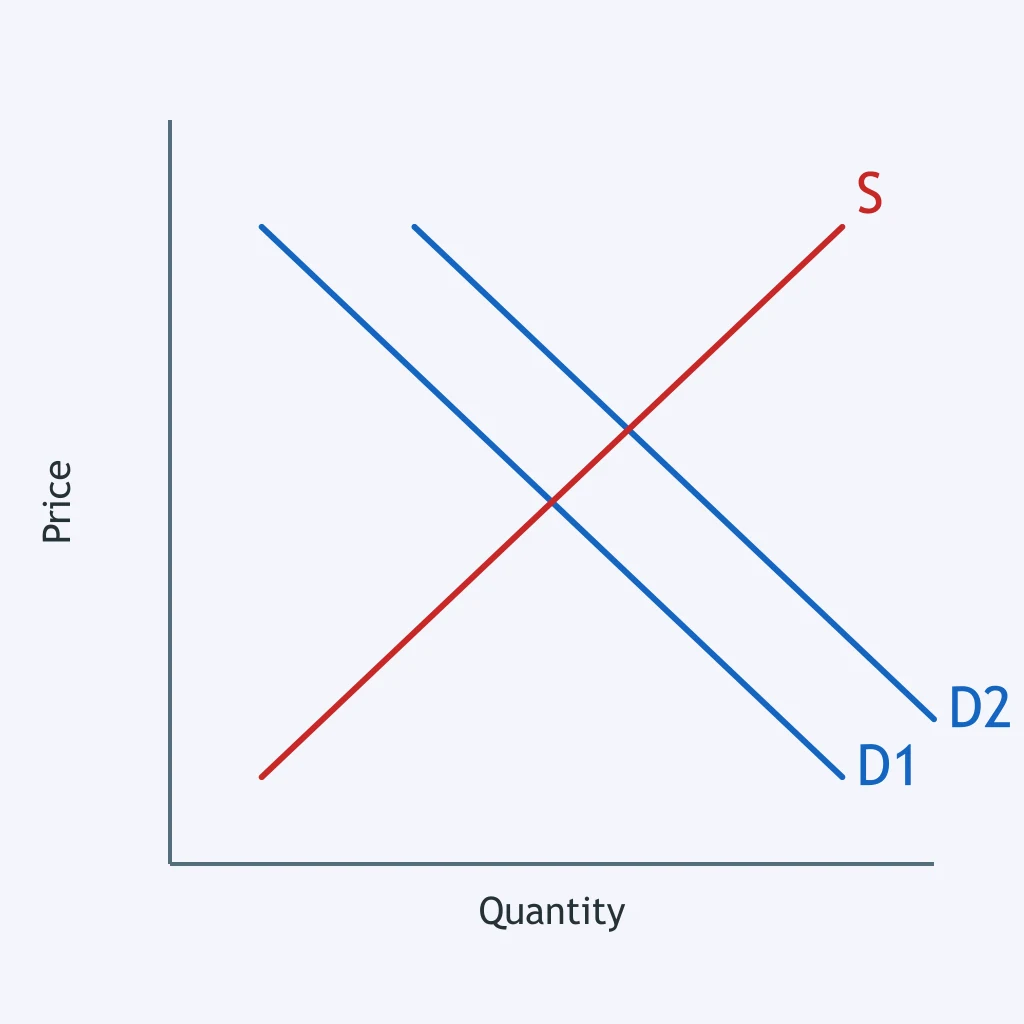
What does the second demand curve, D2, show?
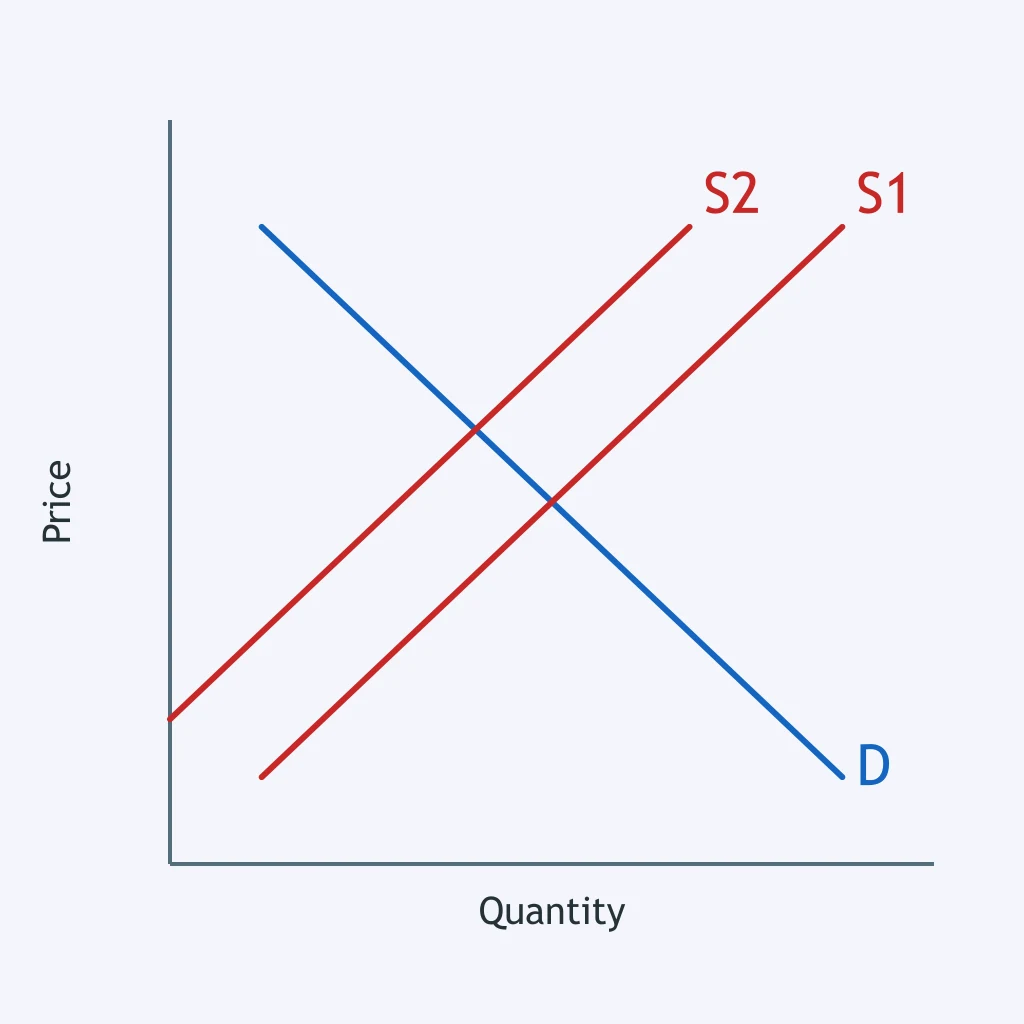
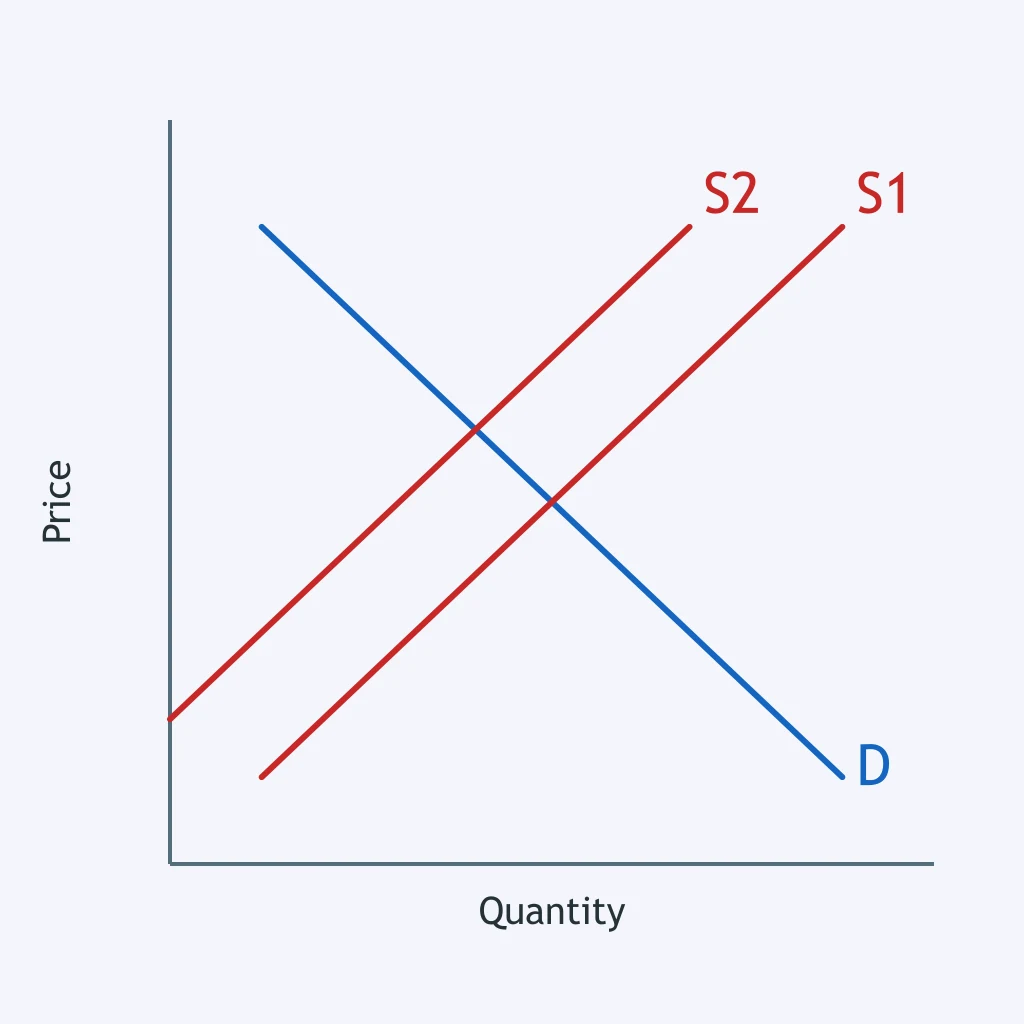
A tariff raises the cost of fabric used to make backpacks. The graph shows the result, with demand unchanged. What happens to equilibrium price and quantity?
Crack the passcode before the zombies get in.
Answer, then swat bugs for bonus points.
Race through questions at your own speed.
Same question on every screen. Fastest wins.

Pick a tile, answer, hit bonuses and steals.
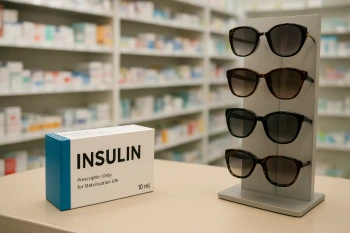
Elastic and Inelastic Demand
25 questions