Loading
by BlastRoom
Reading quartiles, spread, skew and outliers off a box plot, and comparing two plots on the same scale.
#probability_and_statistics

40 questions
One question set, multiple game modes. Tap any game to see it in action. Not sure which to pick?
Answer to place stones and capture territory.
Outrun the snow together.
Earn blasts, then hunt the other team.
Answer to earn energy, then climb.

The class blasts through walls together.
Bid on mystery lots. Most money wins.
Sell tours. Nice, standard, or a total scam.

Answer, restock, and serve the rush.
More correct answers pulls the rope your way.
Answer, then shoot down the alien wave.
Answer, then tap to leap the frozen ridge.
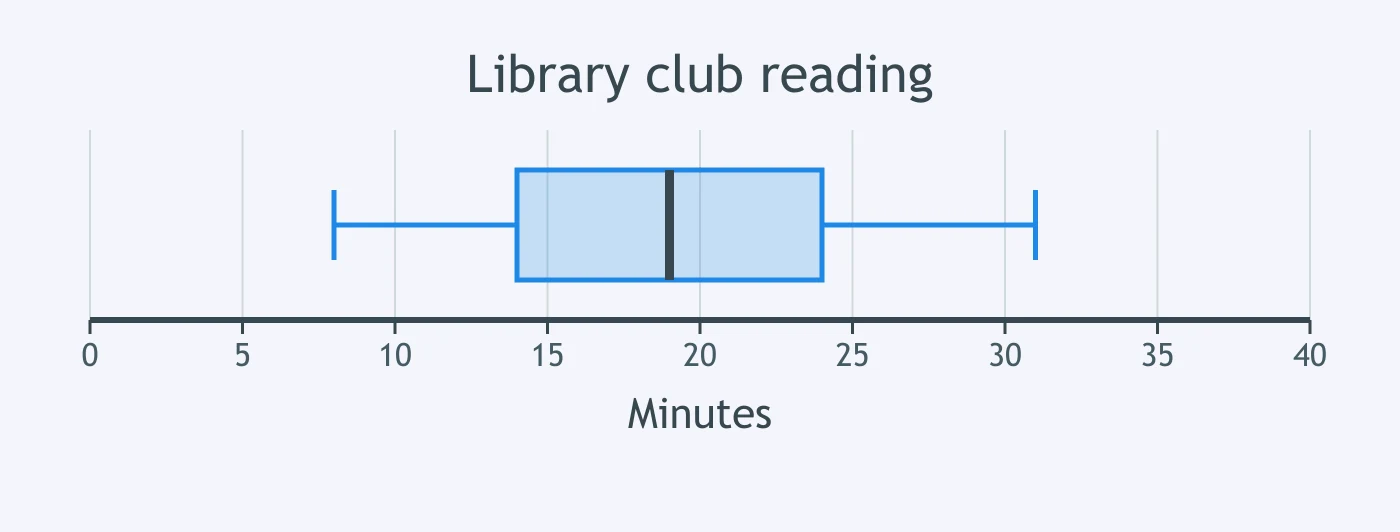
A box plot shows the nightly reading times of 36 library club students, in minutes, on an axis from 0 to 40 minutes. What is the median reading time?
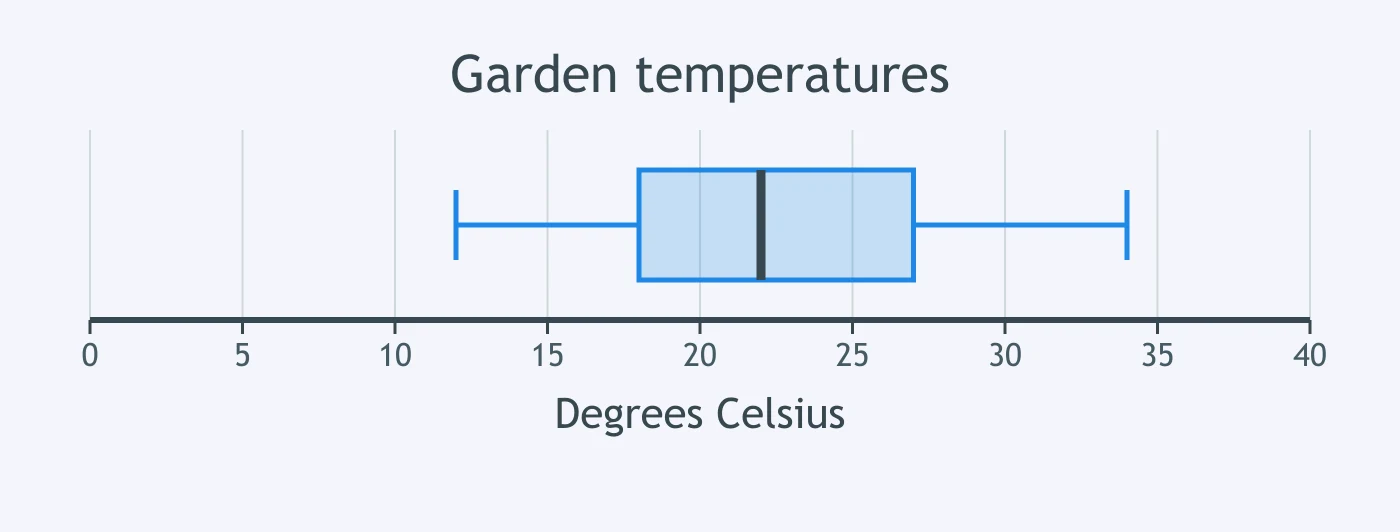
A box plot displays afternoon temperatures for 30 school garden days, in degrees Celsius, on an axis from 0 to 40 °C. What is the third quartile?
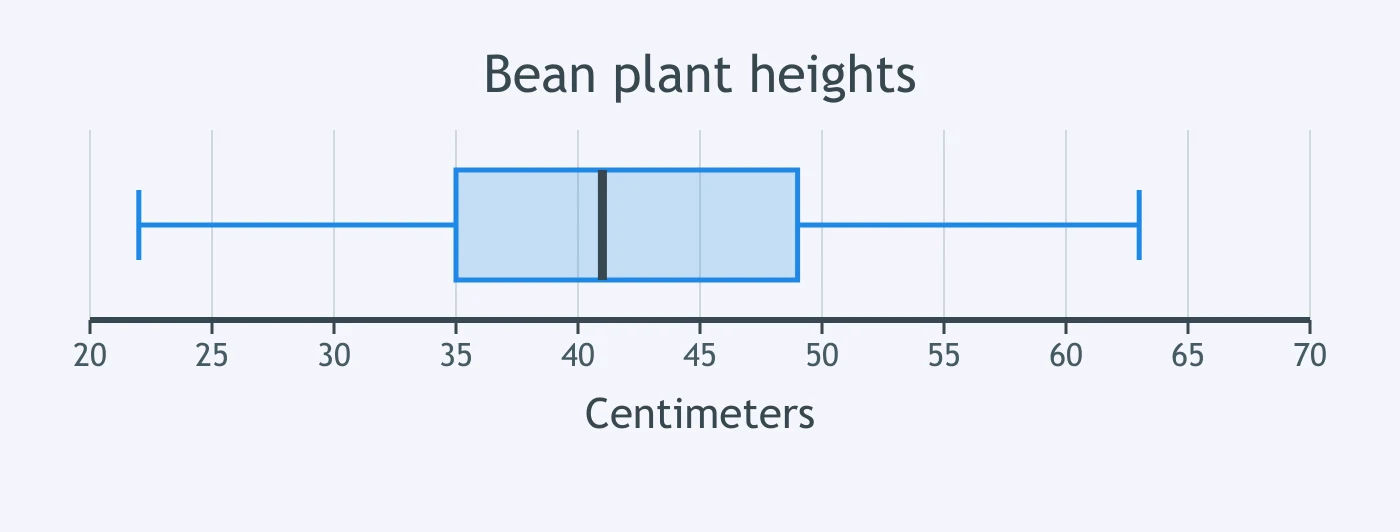
The box plot shows heights of 50 bean plants, in centimeters, on an axis from 20 to 70 cm. What is the first quartile?
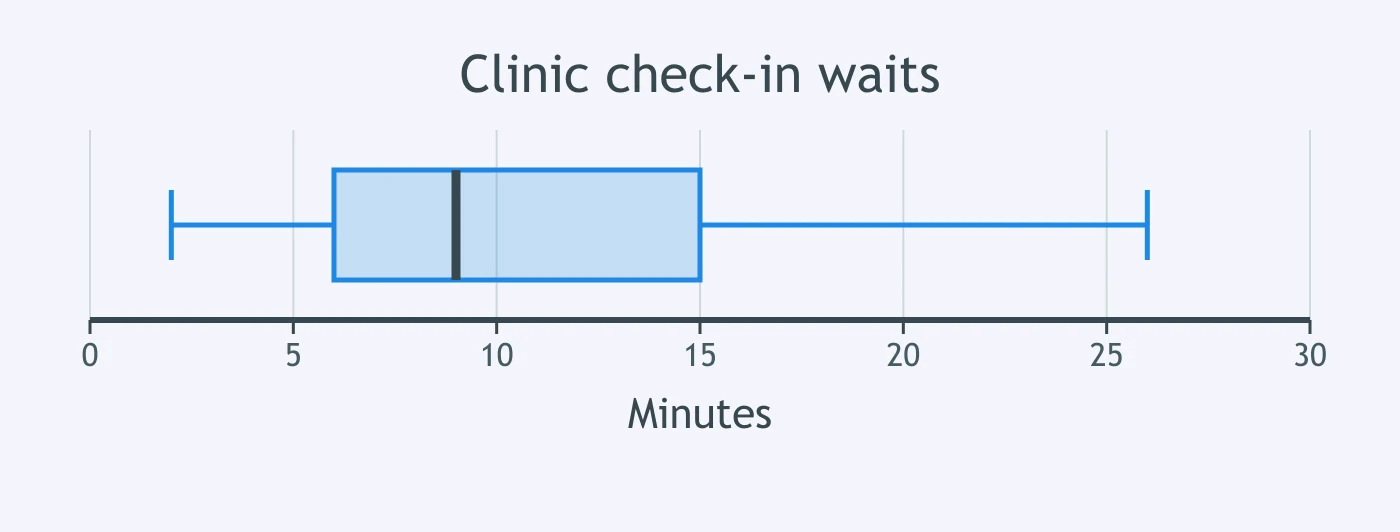
For 44 clinic visits, a box plot shows check-in wait times in minutes, on an axis from 0 to 30 minutes. Where is the third quartile?
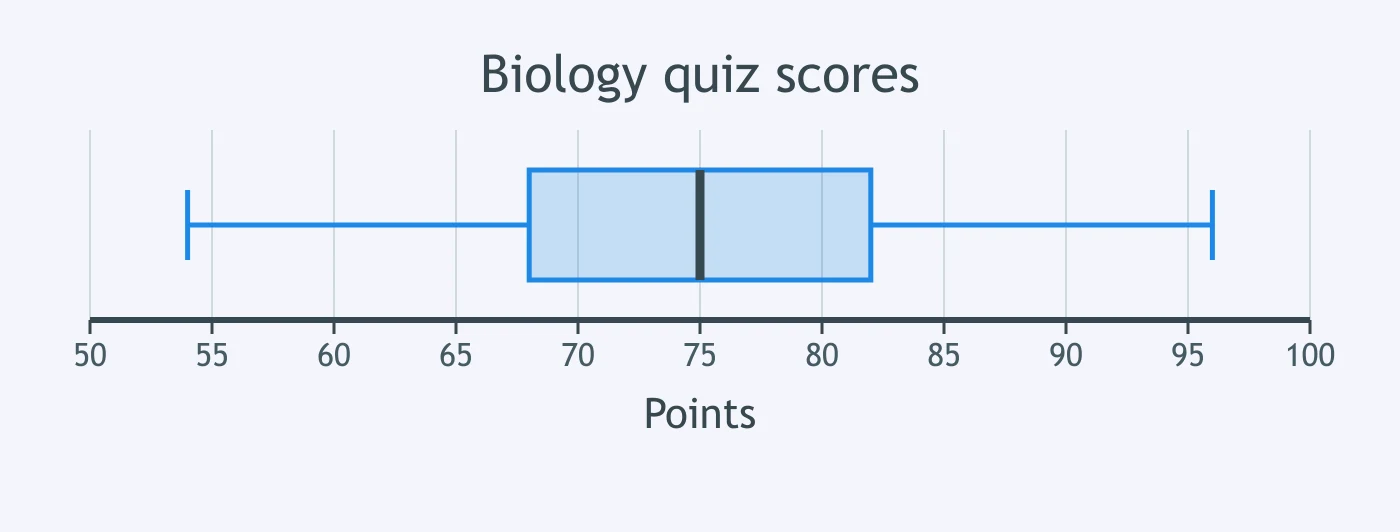
A box plot summarizes biology quiz scores for 80 students, in points, on an axis from 50 to 100 points. What score is the median?
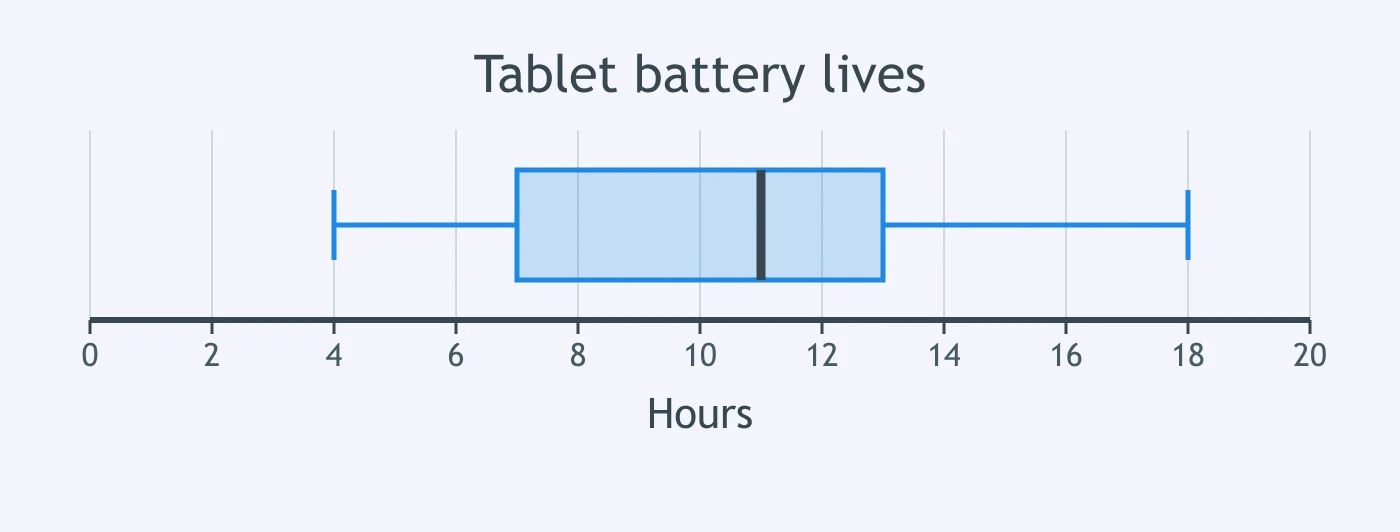
Battery lives for 25 tablets are shown in a box plot, in hours, on an axis from 0 to 20 hours. What is the first quartile?
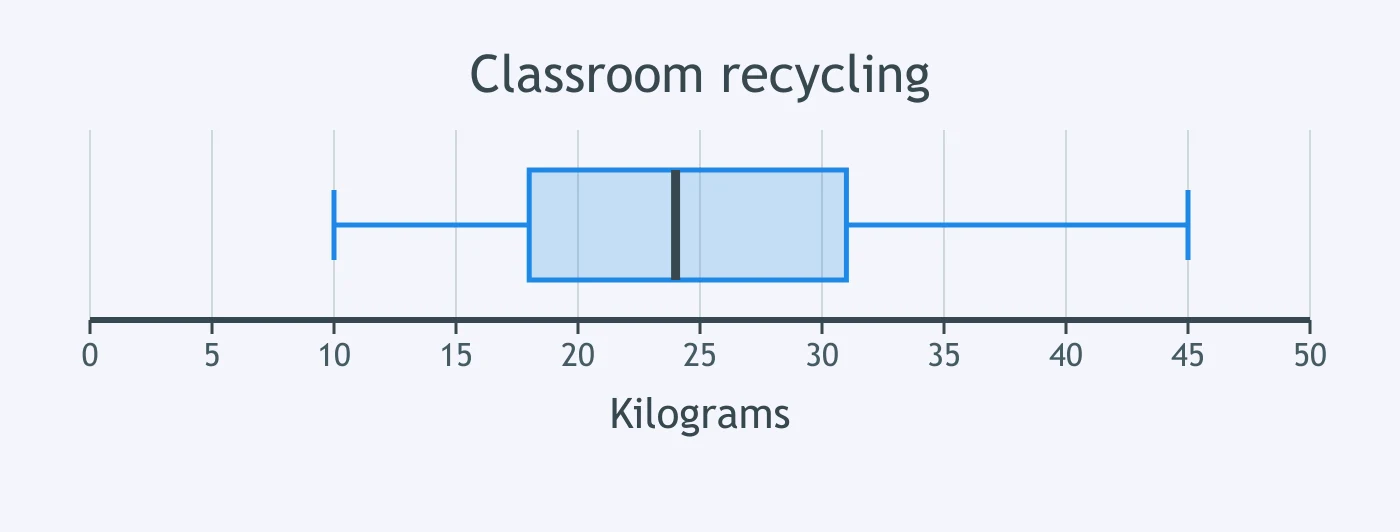
A box plot shows weekly recycling amounts for 32 classrooms, in kilograms, on an axis from 0 to 50 kg. Where is the third quartile?
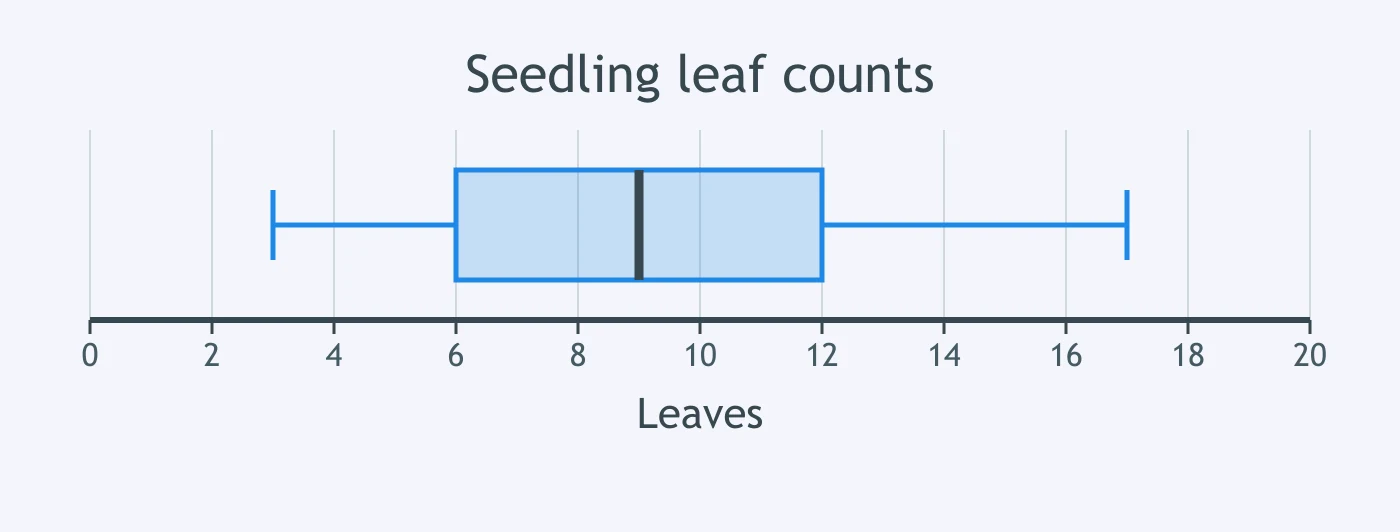
For 40 seedlings, a box plot shows number of leaves on an axis from 0 to 20 leaves. What is the median number of leaves?
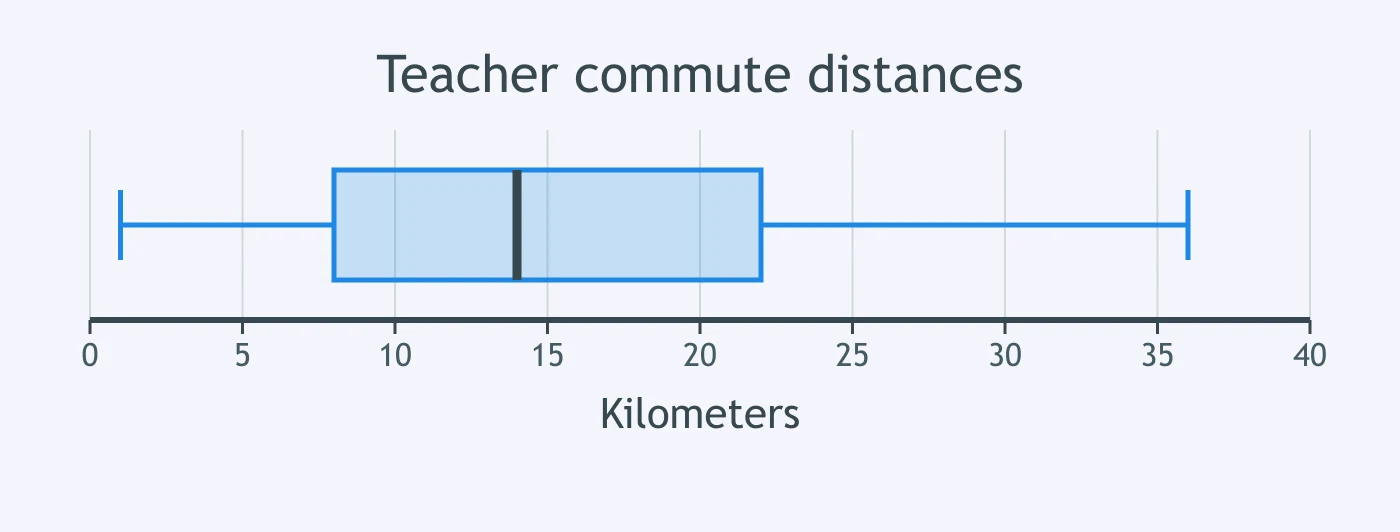
A box plot displays commute distances for 60 teachers, in kilometers, on an axis from 0 to 40 km. What is the first quartile distance?
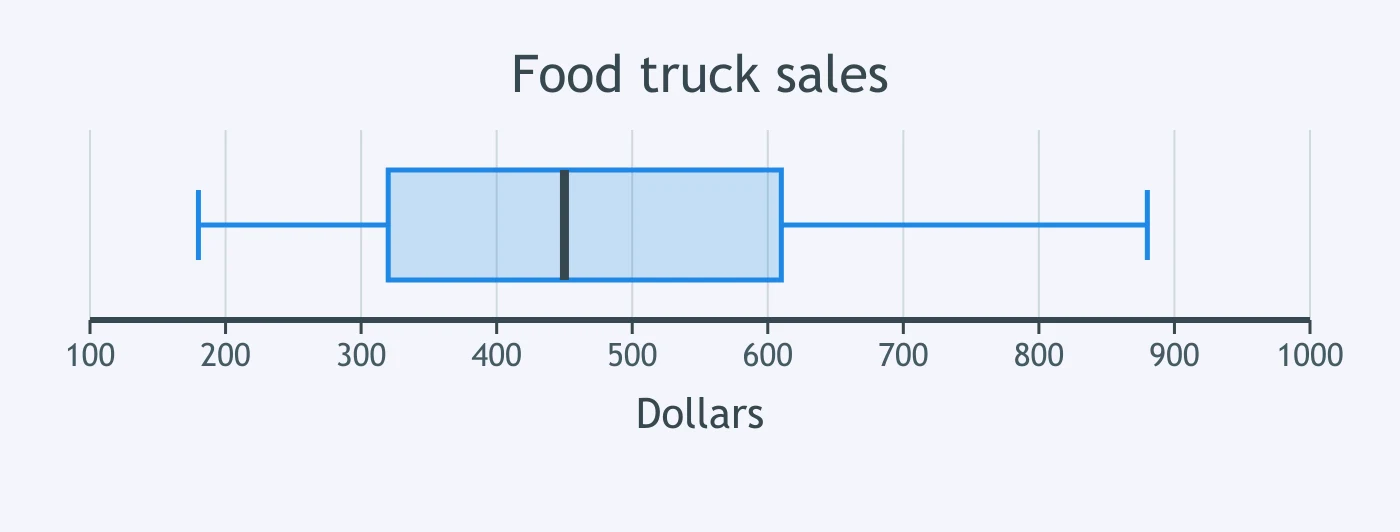
A box plot shows daily food truck sales for 45 days, in dollars, on an axis from $100 to $1000. What is the interquartile range of the sales?
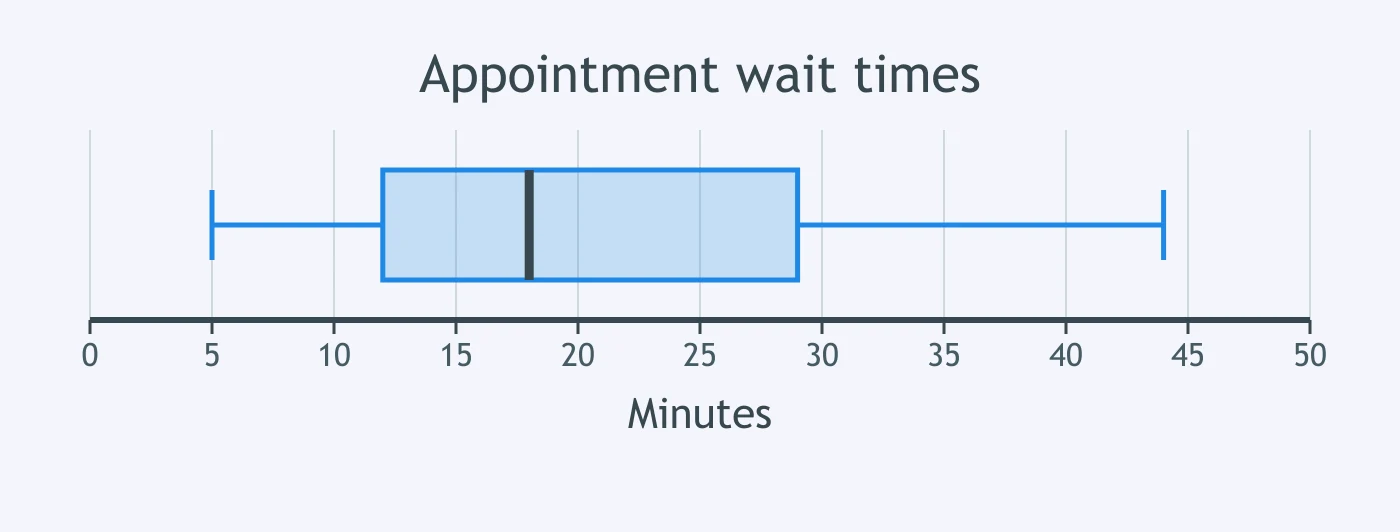
A box plot summarizes appointment wait times for 38 clinic patients, in minutes, on an axis from 0 to 50 minutes. What is the range of the wait times?
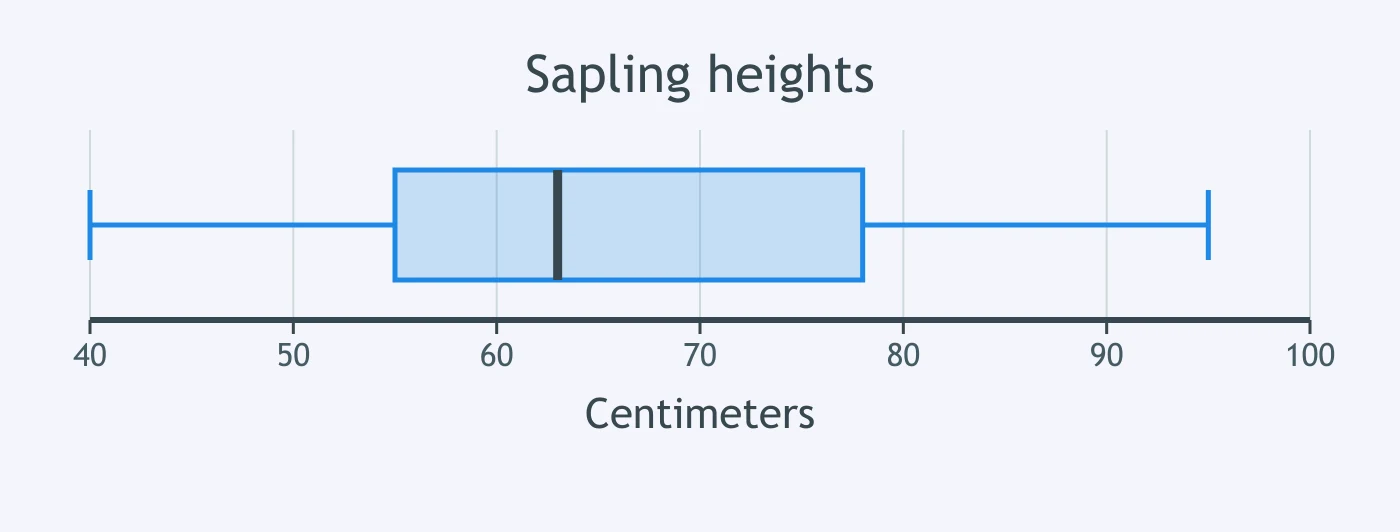
A nursery box plot shows heights of 28 saplings, in centimeters, on an axis from 40 to 100 cm. What is the interquartile range?
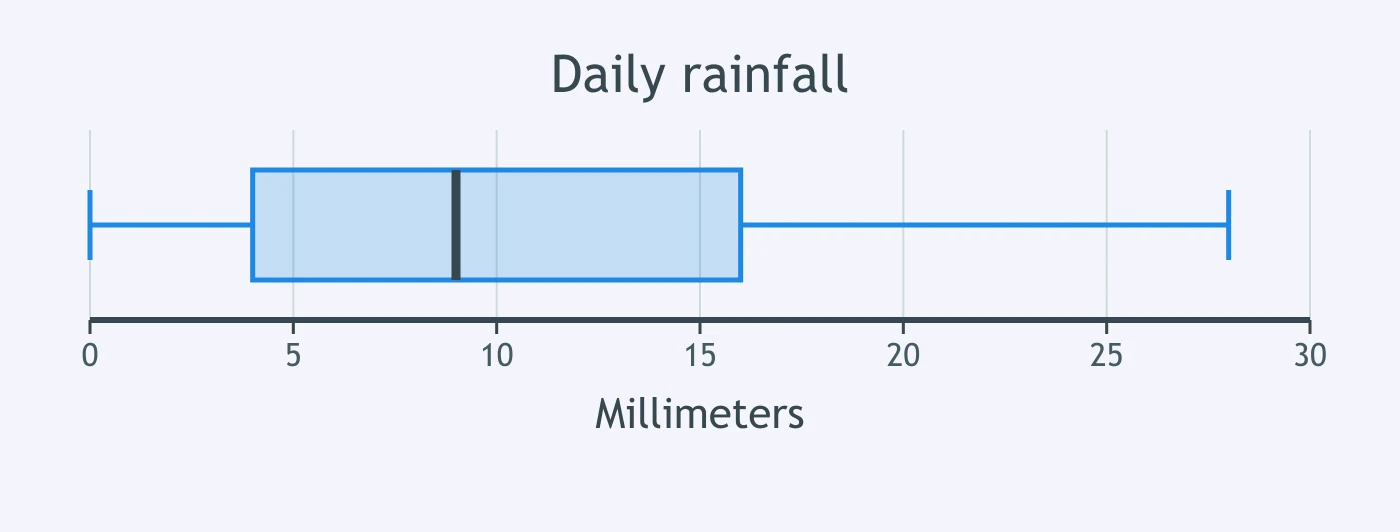
The box plot shows daily rainfall at a weather station over 31 days, in millimeters, on an axis from 0 to 30 mm. What is the range?
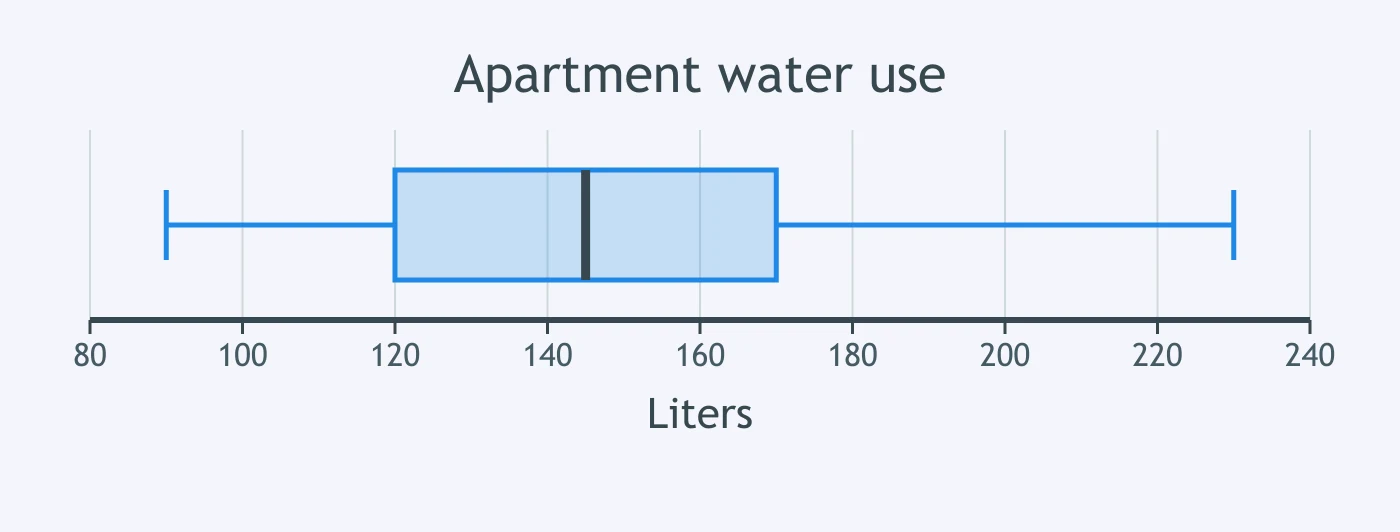
A box plot displays daily water use for 52 apartments, in liters, on an axis from 80 to 240 liters. What is the interquartile range?
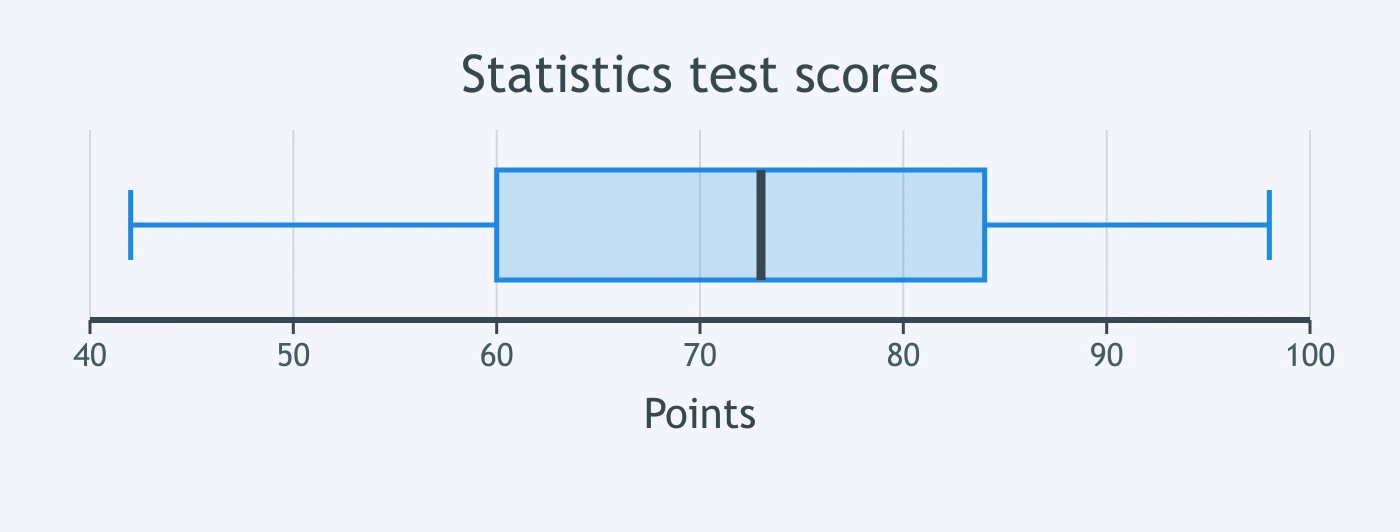
A box plot shows statistics test scores for 90 students, in points, on an axis from 40 to 100 points. What is the range of the scores?
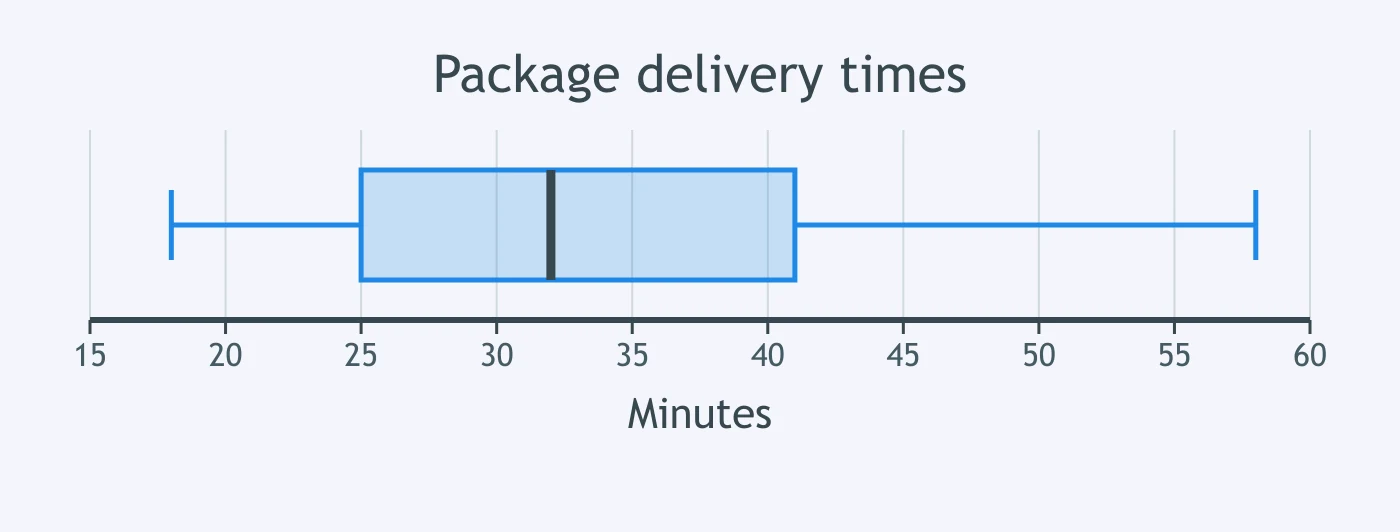
Delivery times for 34 packages are shown in a box plot, in minutes, on an axis from 15 to 60 minutes. Find the interquartile range.
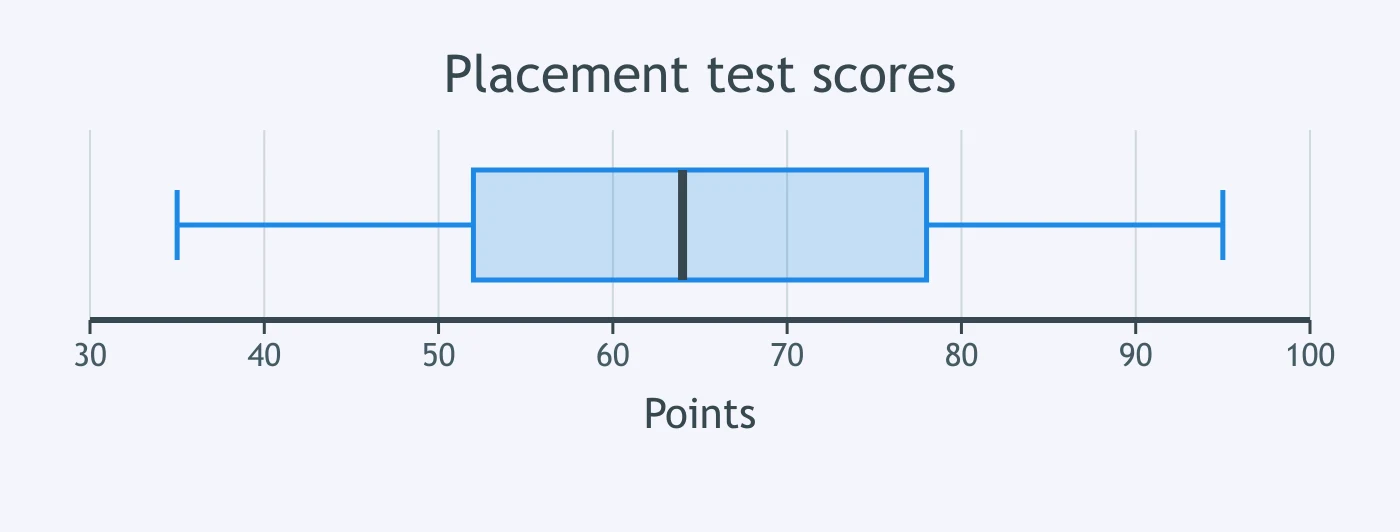
A box plot shows placement test scores for 200 students, in points, on an axis from 30 to 100 points. About how many students scored between the first quartile and the median?
A box plot summarizes fill volumes for 80 juice bottles, in milliliters, on an axis from 480 to 540 mL. About how many bottles are between the minimum and the first quartile?
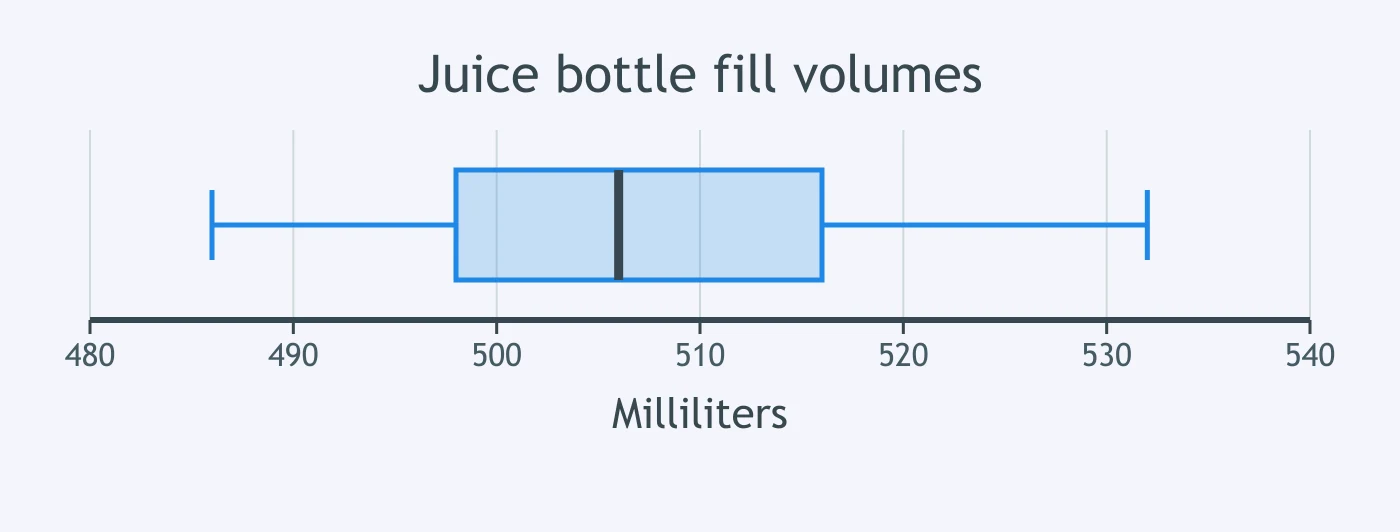
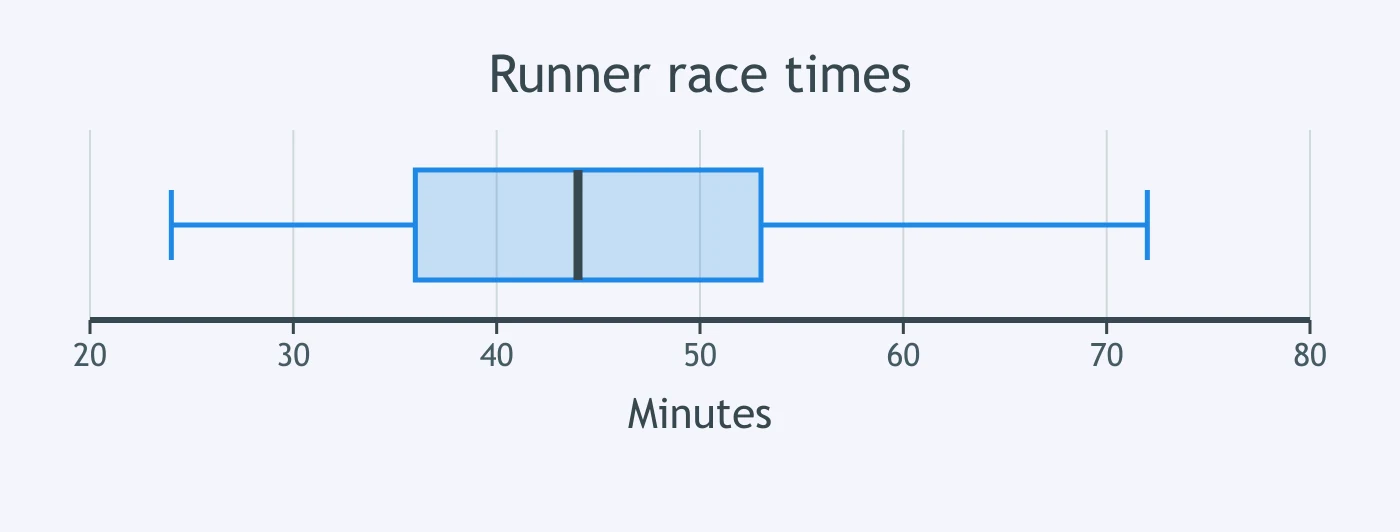
Race times for 120 runners are shown in a box plot, in minutes, on an axis from 20 to 80 minutes. About how many runners are between the median and the third quartile?
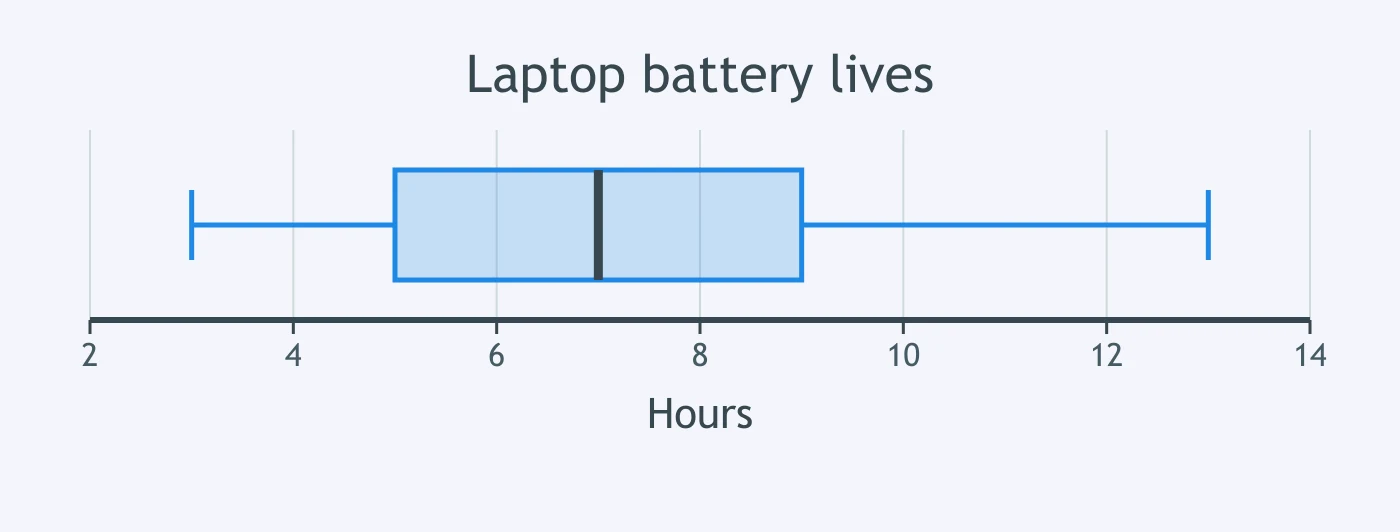
A box plot shows battery lives for 64 laptops, in hours, on an axis from 2 to 14 hours. About how many laptops are in the middle half from Q1 to Q3?
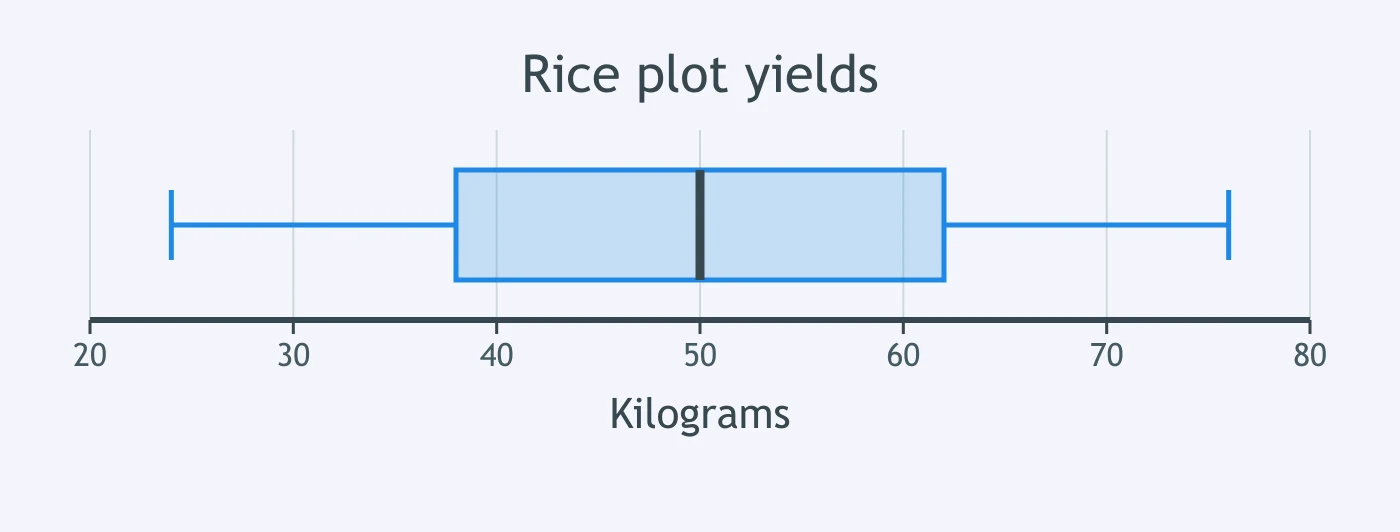
A box plot displays rice yields for 48 farm plots, in kilograms, on an axis from 20 to 80 kg. About how many plots fall from the third quartile to the maximum?
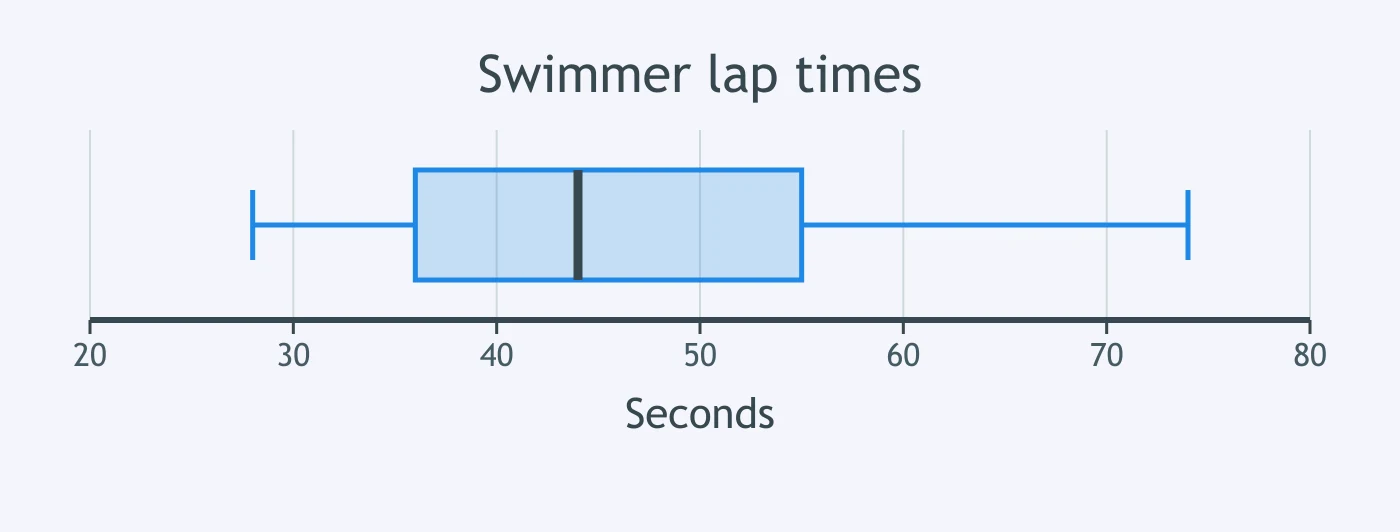
A box plot summarizes lap times for 160 swimmers, in seconds, on an axis from 20 to 80 seconds. About how many swimmers are at or below the median?
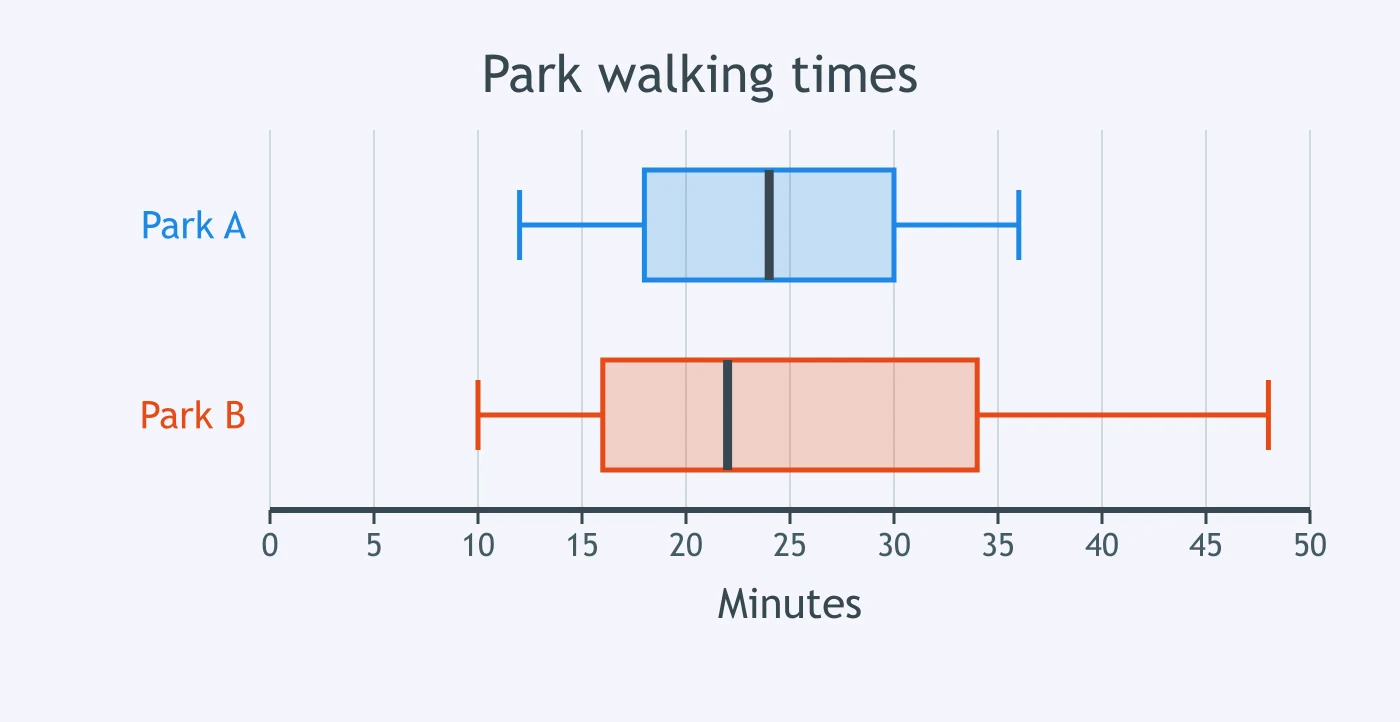
Two box plots share an axis from 0 to 50 minutes for walking times of 40 park visitors: upper is Park A, lower is Park B. Which park has the more spread-out middle half?
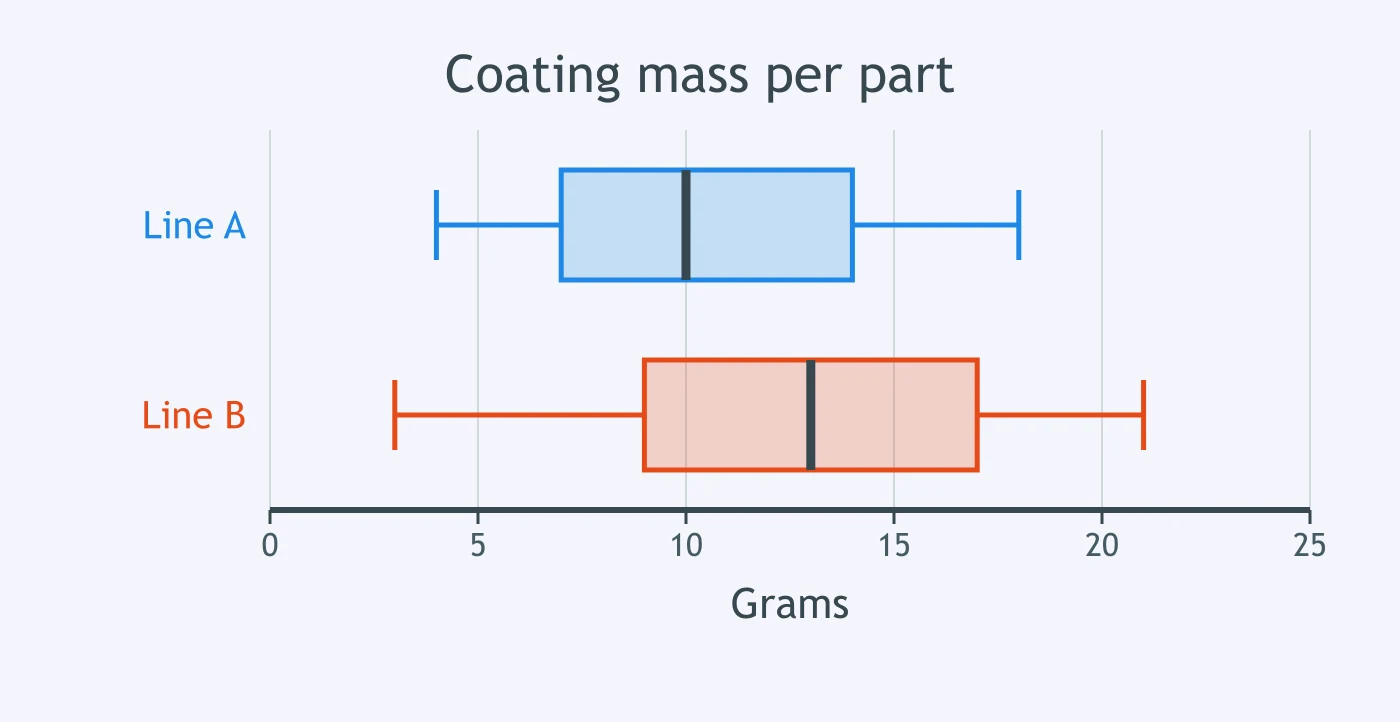
For 30 machine parts from each line, two box plots share an axis from 0 to 25 grams of coating mass: upper Line A, lower Line B. Which line has the higher median?
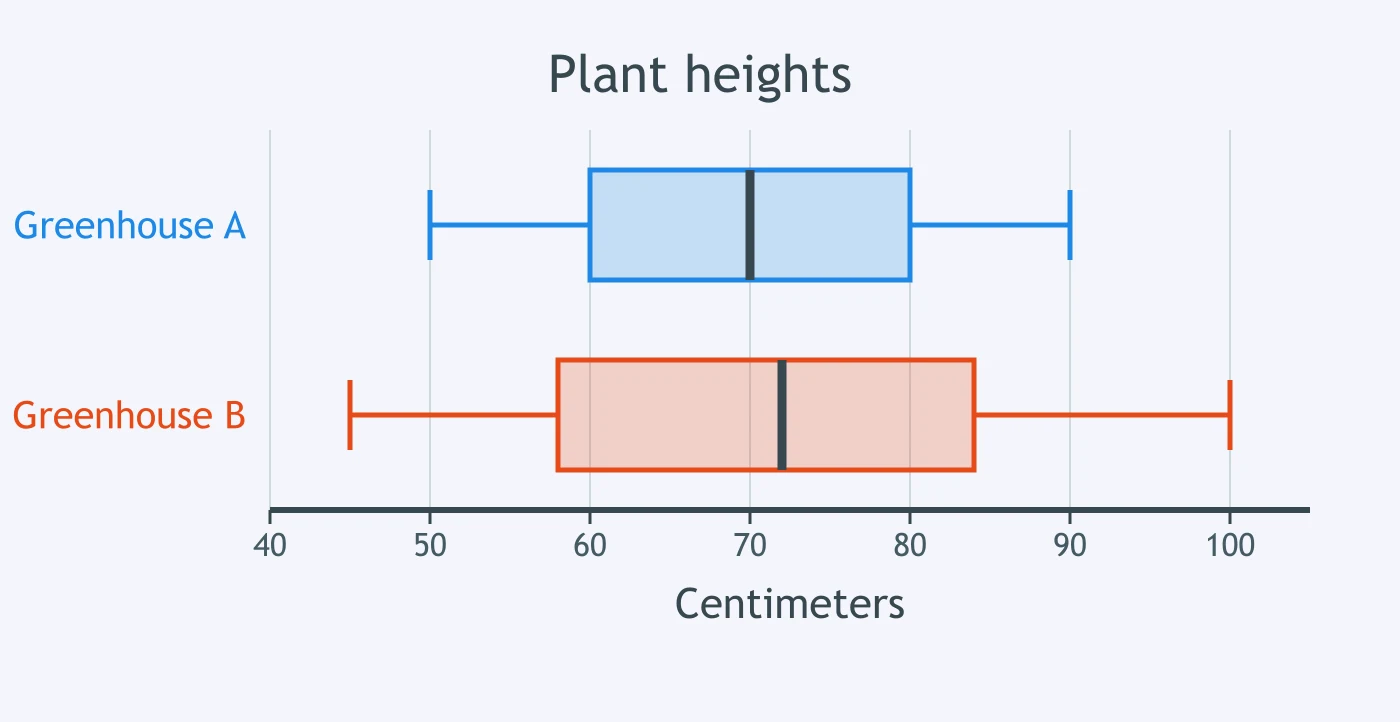
Two box plots share an axis from 40 to 105 cm for plant heights in two greenhouses: upper Greenhouse A, lower Greenhouse B. Which greenhouse has the larger overall range?
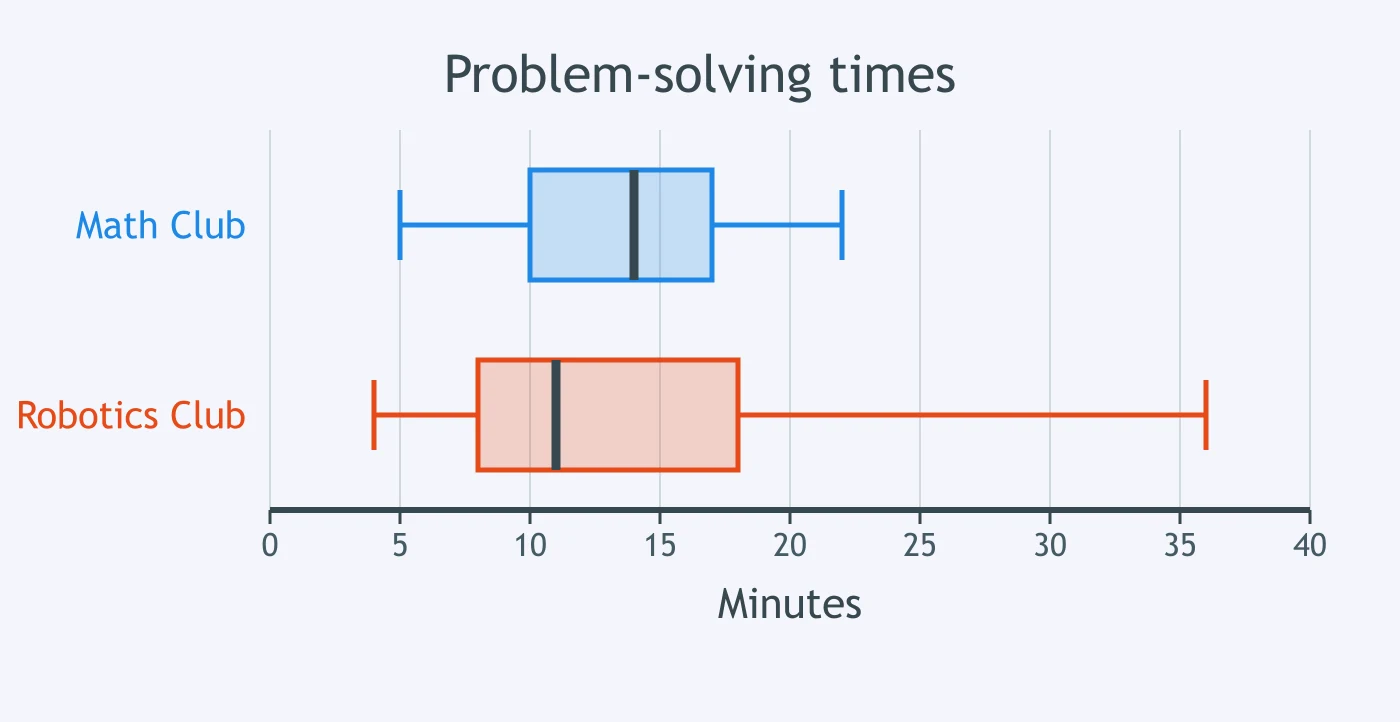
Two box plots compare problem-solving times for 35 students in each club, in minutes, on an axis from 0 to 40 minutes: upper Math Club, lower Robotics Club. Which club's times look more right-skewed?
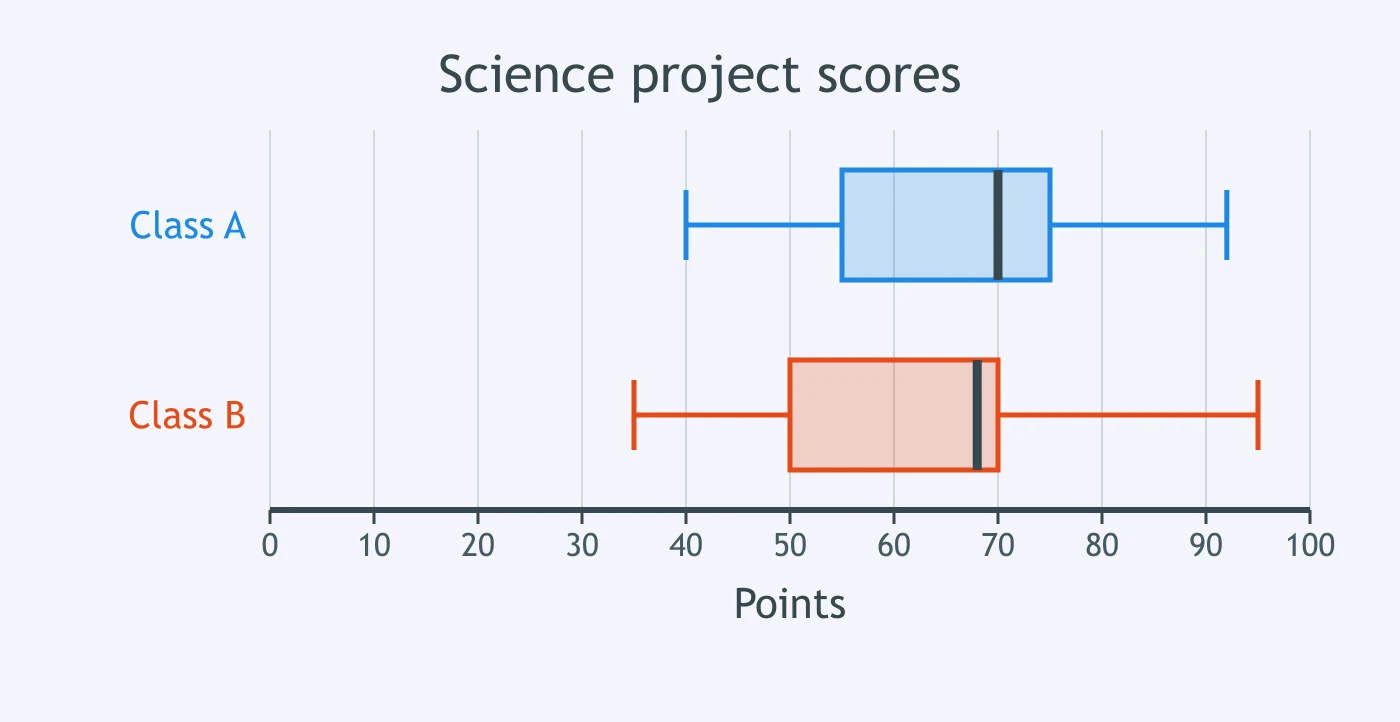
Two box plots share an axis from 0 to 100 points for science project scores in two classes: upper Class A, lower Class B. Which class has the same middle-half spread as the other?
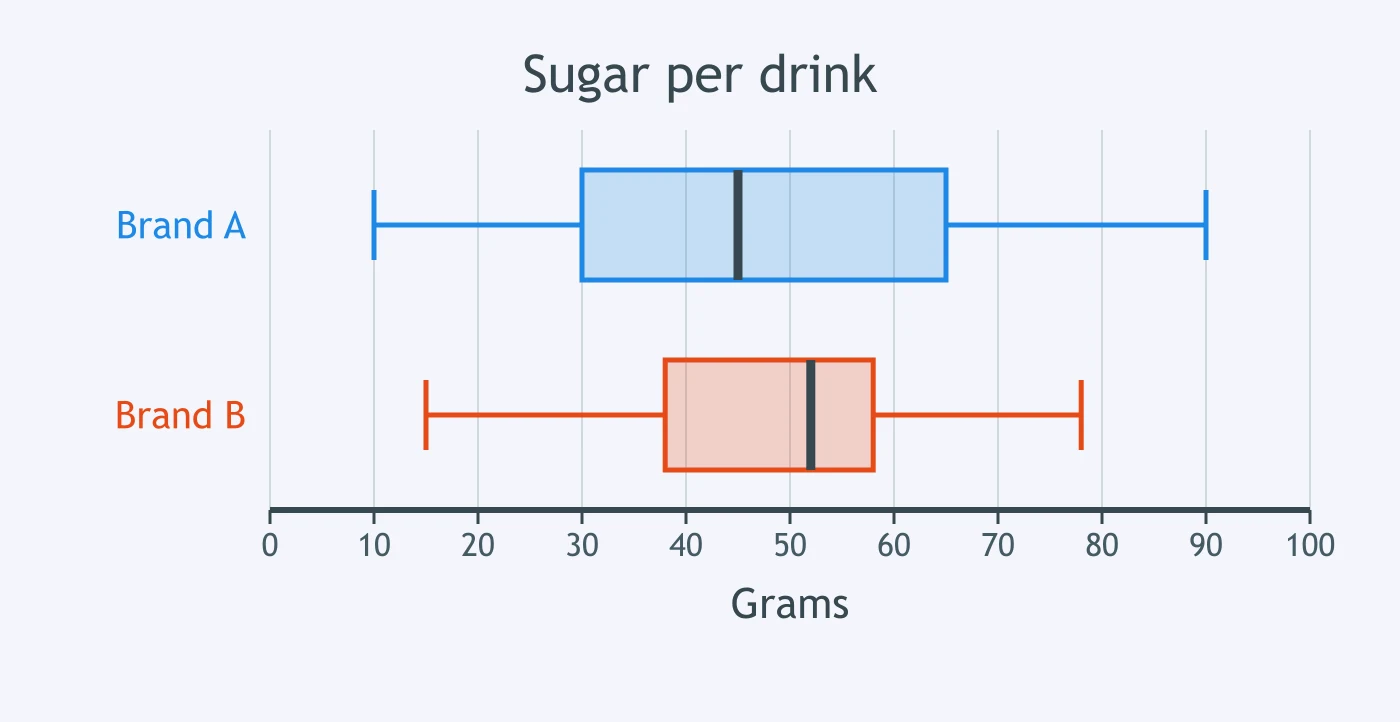
Two box plots compare daily sugar content in cafeteria drinks, in grams, on an axis from 0 to 100 grams: upper Brand A, lower Brand B. Which brand has a higher median and a smaller IQR?
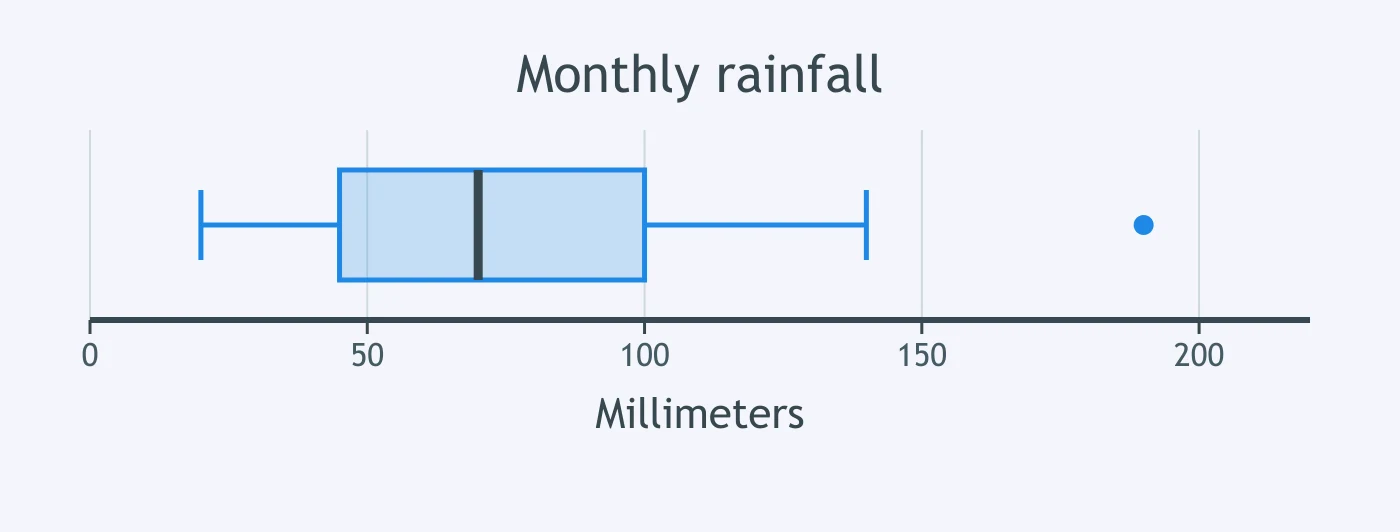
A modified box plot shows monthly rainfall for 36 months, in millimeters, on an axis from 0 to 220 mm; any outlier is drawn as a separate point. What is the upper outlier value?
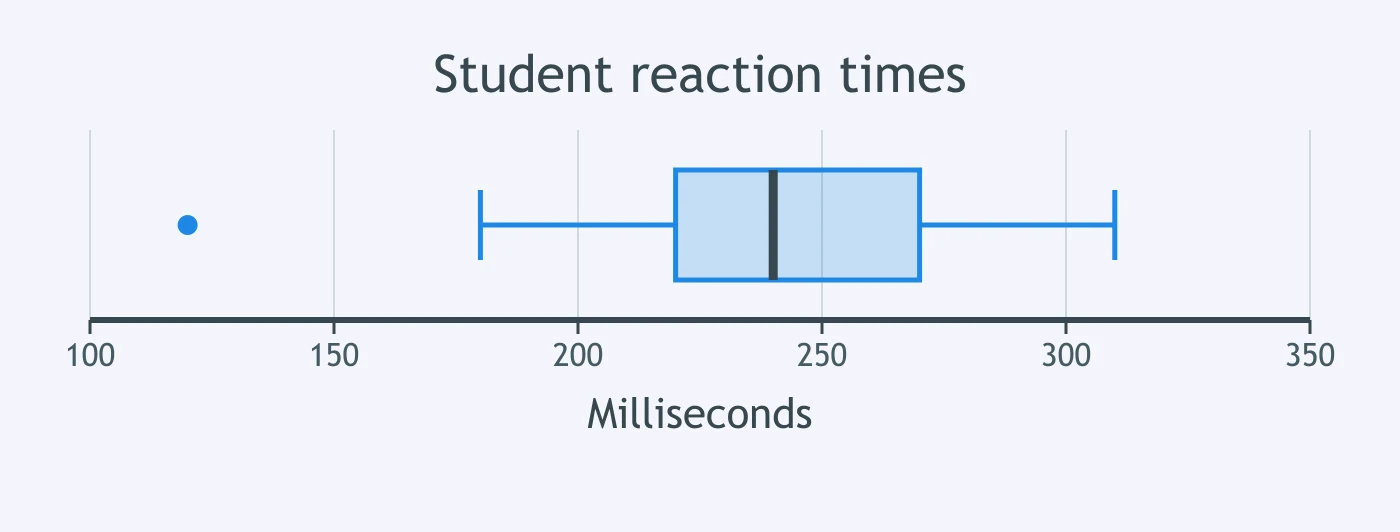
For 50 students, a modified box plot shows reaction times in milliseconds on an axis from 100 to 350 ms; any outlier is a separate point. What is the lower outlier value?
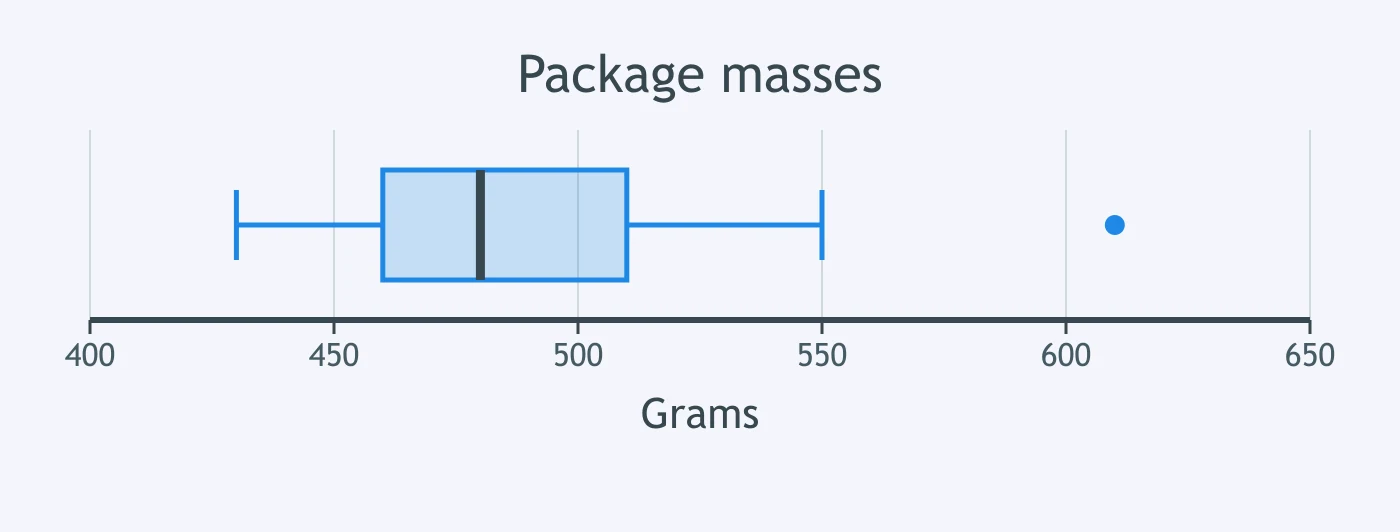
A modified box plot summarizes package masses for 42 shipments, in grams, on an axis from 400 to 650 g; separate points mark outliers. What mass is the upper outlier?
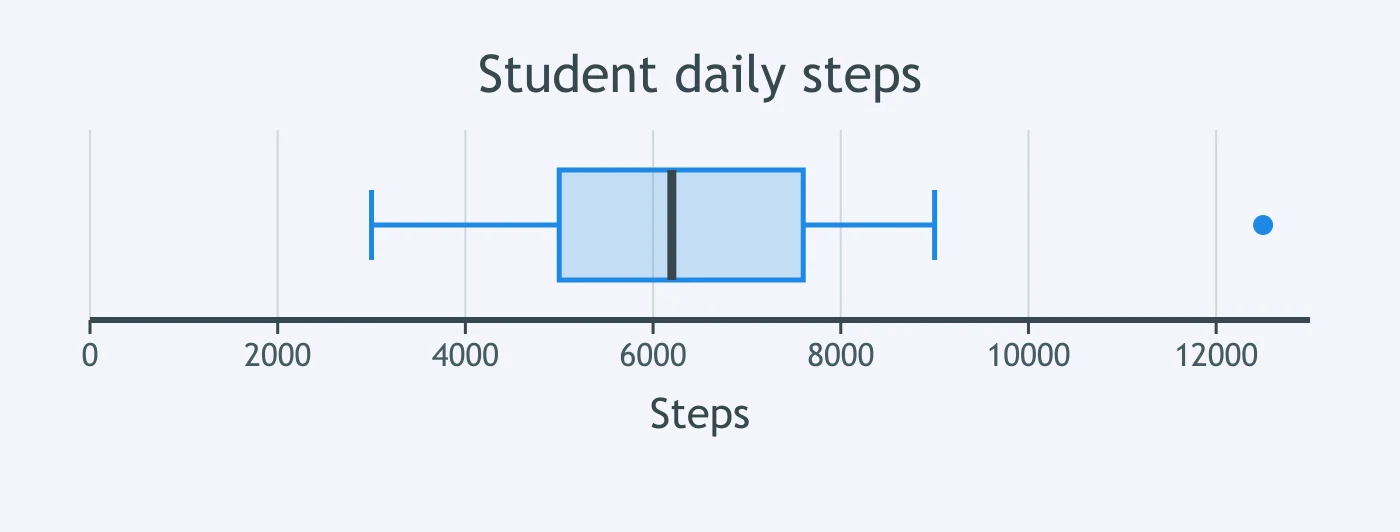
A modified box plot shows daily step counts for 60 students on an axis from 0 to 13000 steps; separate points mark outliers. What is the high outlier value?
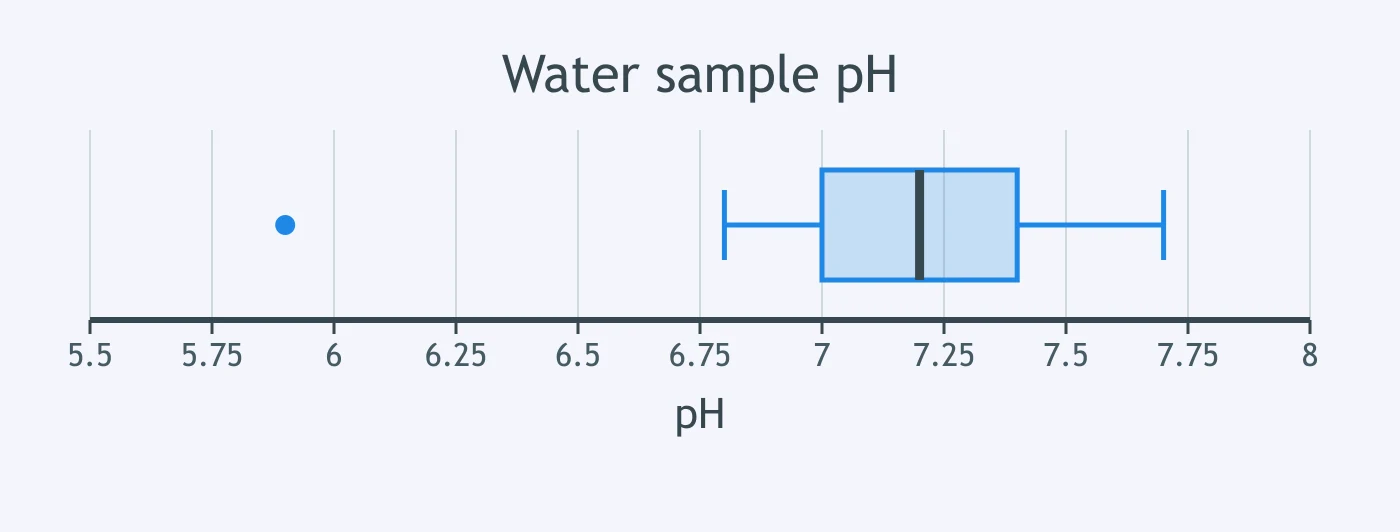
A modified box plot shows pH readings for 30 water samples on an axis from 5.5 to 8.0 pH; separate points mark outliers. What is the lower outlier value?
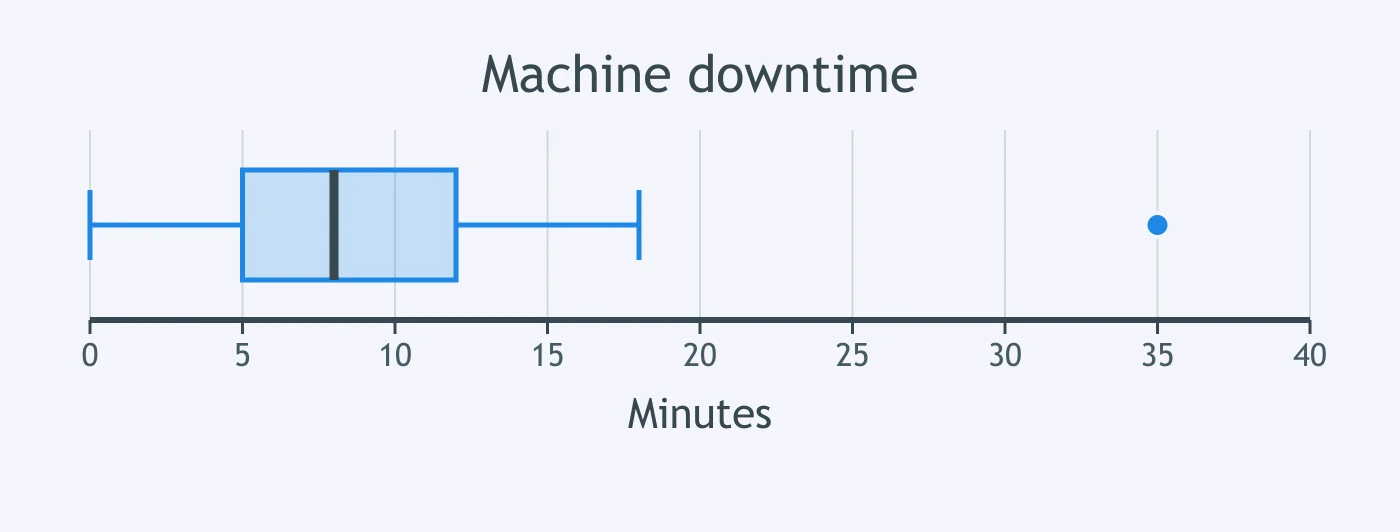
A modified box plot displays machine downtime for 40 shifts, in minutes, on an axis from 0 to 40 minutes; separate points mark outliers. What is the upper outlier value?
Nine tomato masses, in grams, are 72, 81, 75, 90, 84, 96, 78, 87, 93. A box plot is drawn. Where does the left edge of the box fall?
Ten tablet battery lives, in hours, are 5, 8, 6, 10, 12, 7, 9, 11, 13, 14. A box plot is drawn. Where does the right edge of the box fall?
Eleven plant heights, in centimeters, are 18, 24, 21, 30, 27, 33, 36, 39, 42, 45, 48. A box plot is drawn. Where does the left edge of the box fall?
Eight classroom recycling amounts, in kilograms, are 12, 18, 15, 24, 21, 27, 30, 36. A box plot is drawn. Where does the right edge of the box fall?
Nine commute distances, in kilometers, are 4, 6, 8, 10, 12, 14, 16, 18, 20. A box plot is drawn. Where does the right edge of the box fall?
Ten water samples have calcium concentrations, in mg/L, of 22, 28, 24, 30, 26, 32, 34, 36, 38, 40. A box plot is drawn. Where does the left edge of the box fall?
Crack the passcode before the zombies get in.
Answer, then swat bugs for bonus points.
Race through questions at your own speed.
Same question on every screen. Fastest wins.

Pick a tile, answer, hit bonuses and steals.
Standard Deviation and Variance
40 questions