Loading
by BlastRoom
Explore how weather changes with each season and how scientists use data to describe climate.
#weather#climate#us_grade_3_science
20 questions
One question set, multiple game modes. Tap any game to see it in action. Not sure which to pick?
Answer to place stones and capture territory.
Outrun the snow together.
Earn blasts, then hunt the other team.
Answer to earn energy, then climb.

The class blasts through walls together.
Bid on mystery lots. Most money wins.
Sell tours. Nice, standard, or a total scam.

Answer, restock, and serve the rush.
More correct answers pulls the rope your way.
Answer, then shoot down the alien wave.
Answer, then tap to leap the frozen ridge.
The bar graph shows the number of rainy days in each season in Fern Hollow. How many rainy days does winter have there?
The bar graph shows the number of sunny days in each season in Rock Springs. Which season has more sunny days there, spring or summer?
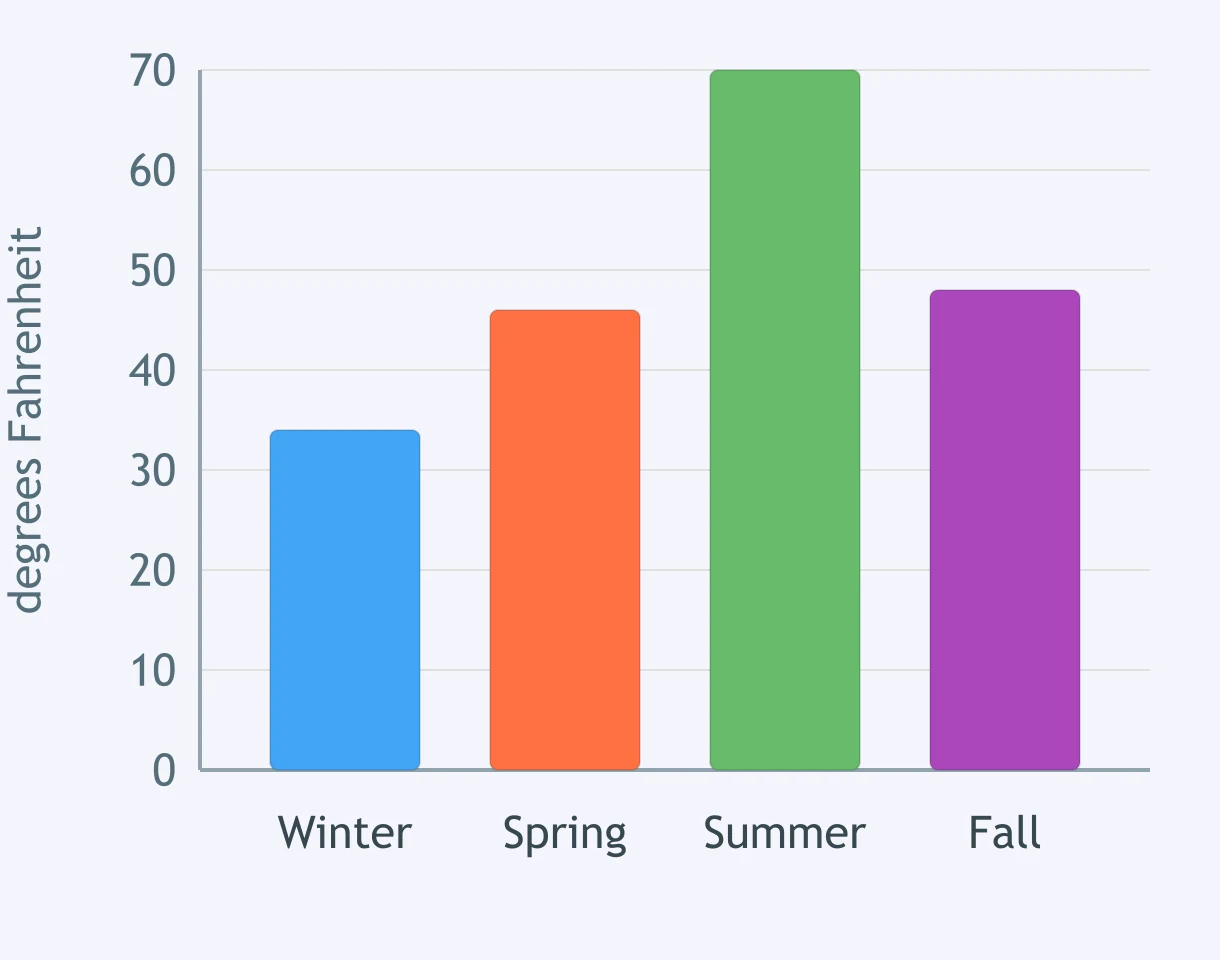
The bar graph shows the average temperature in Maple City for winter, spring, summer, and fall. Which season is the warmest there?
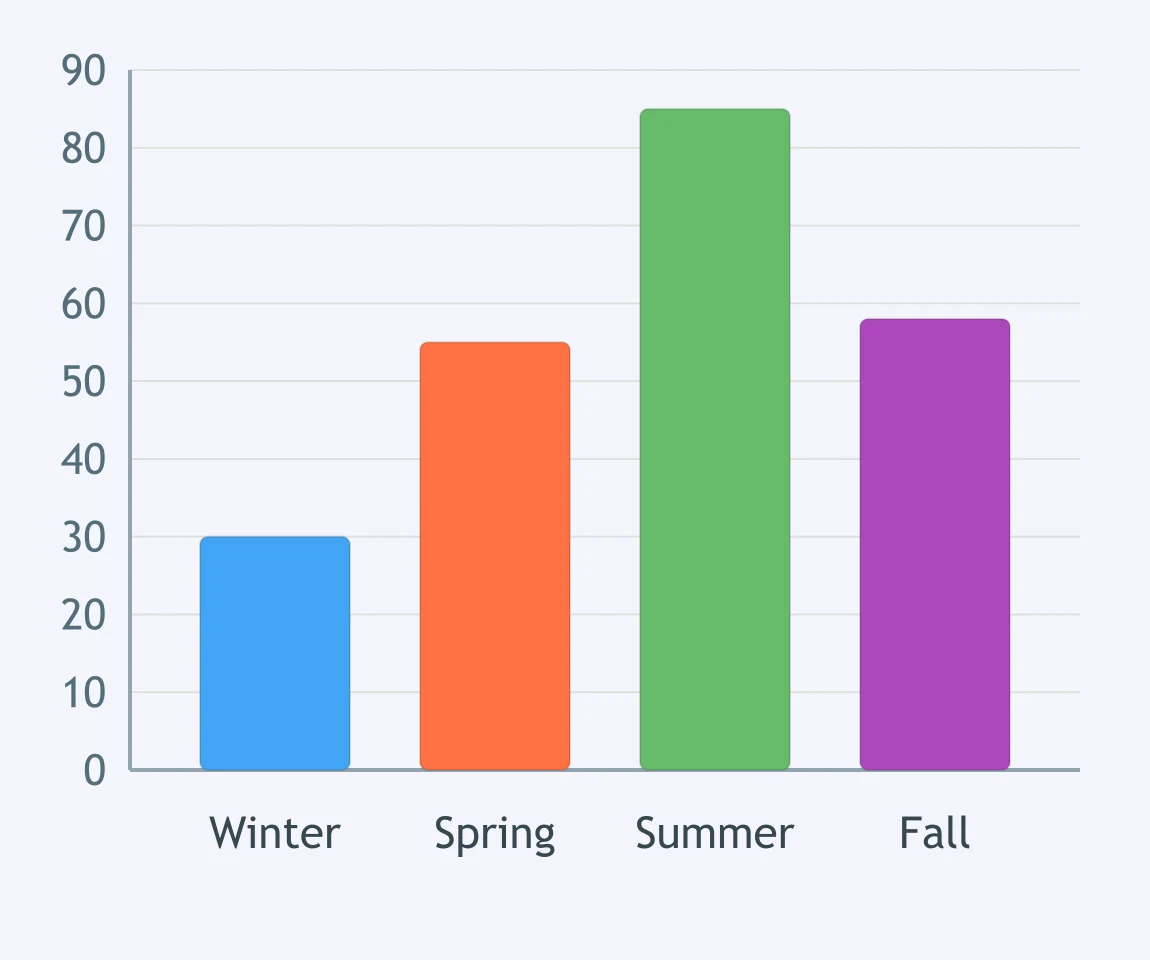
The bar graph shows the average temperature in Cedar Falls for winter, spring, summer, and fall. Which season is the coldest there?
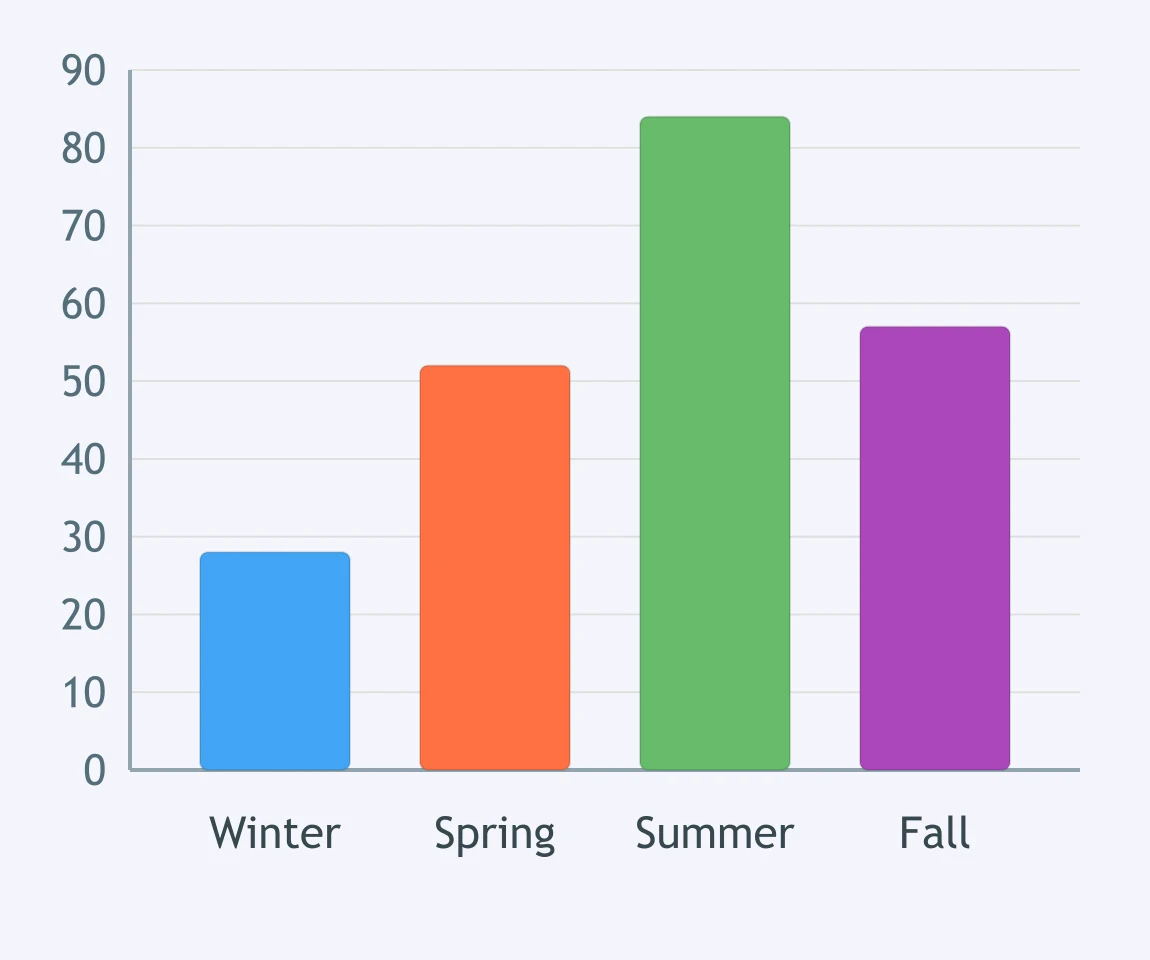
The bar graph shows the average precipitation in Riverton for each season. What does the graph tell you about spring and summer?
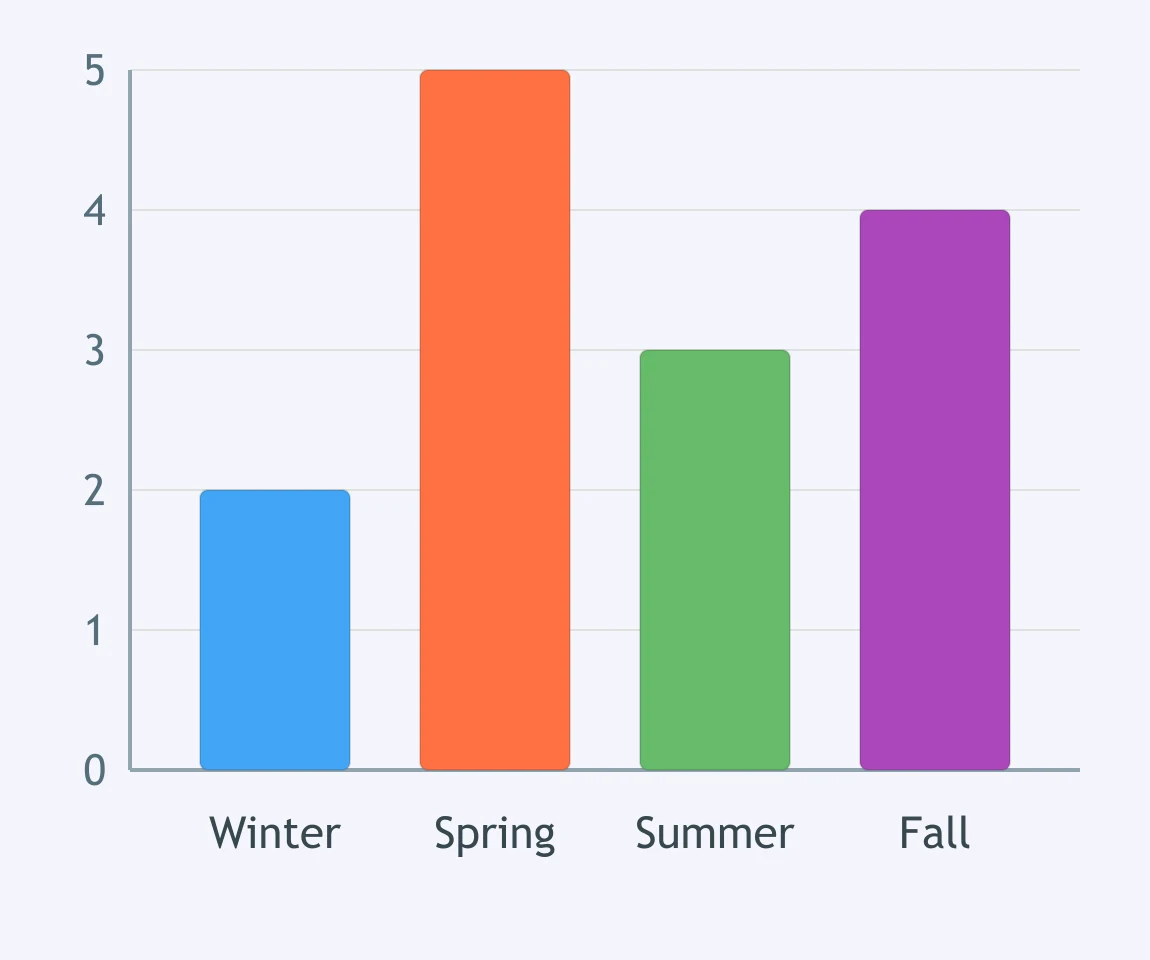
The bar graph shows the average temperature in Meadowbrook for winter, spring, summer, and fall, in degrees Fahrenheit. What is the temperature there in spring?
The bar graph shows the average temperature in Coral Bay for winter, spring, summer, and fall, in degrees Fahrenheit. What does the graph show about the temperature there?
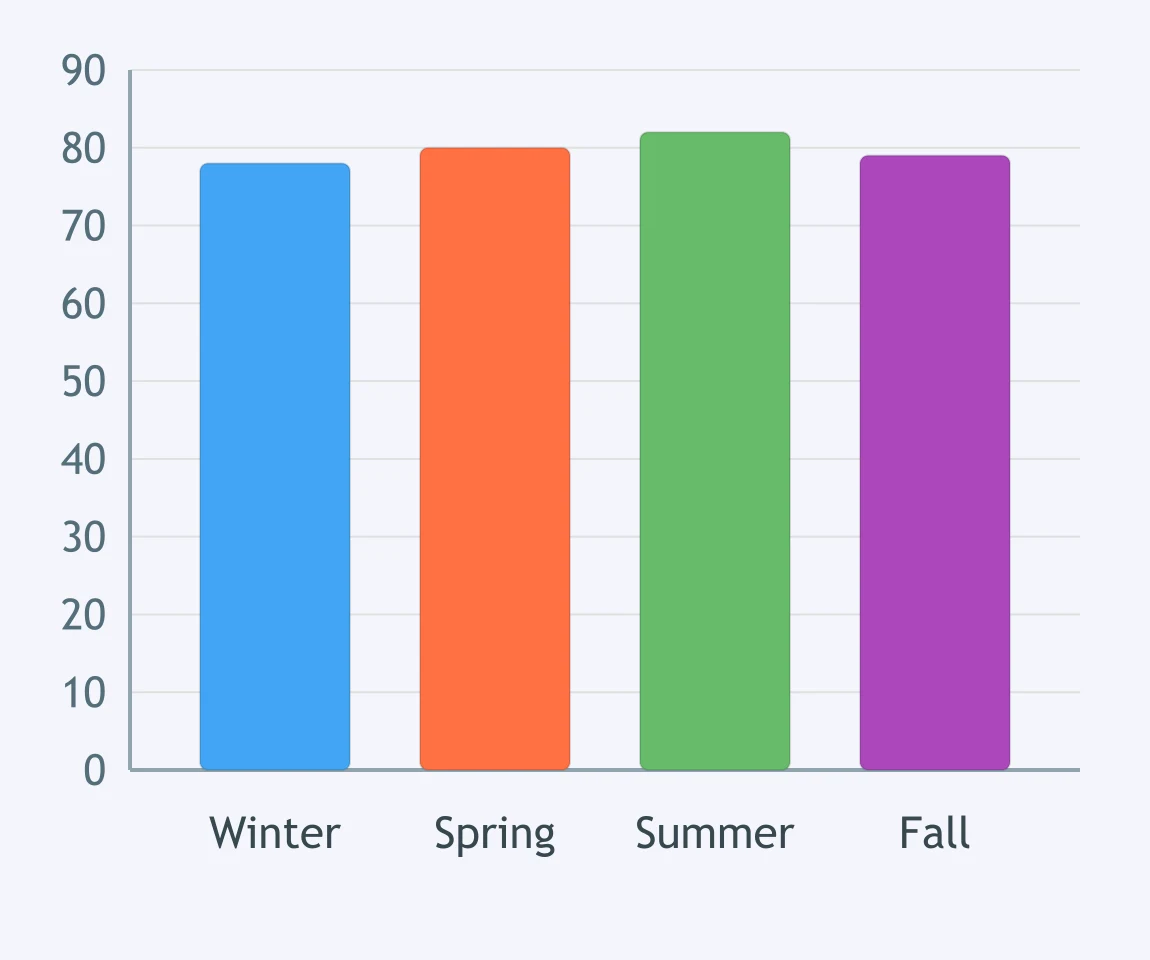
The bar graph shows the average snowfall in each season in Frost Hollow, in inches. How much snow does Frost Hollow get in winter?
The bar graph shows the average precipitation in Sandy Mesa for each season, in inches. How much precipitation does Sandy Mesa get in summer?
The bar graph shows the number of stormy days in each season in Thunder Ridge. How many more stormy days does summer have than winter?
The bar graph shows the average wind speed in each season in Gale Point, in miles per hour. Which season is the windiest there?
The bar graph shows the number of cloudy days in each season in Clearview. Which season has the fewest cloudy days there?
The bar graph shows the average precipitation for each season in Oak Harbor, in inches. Which season is the wettest there?
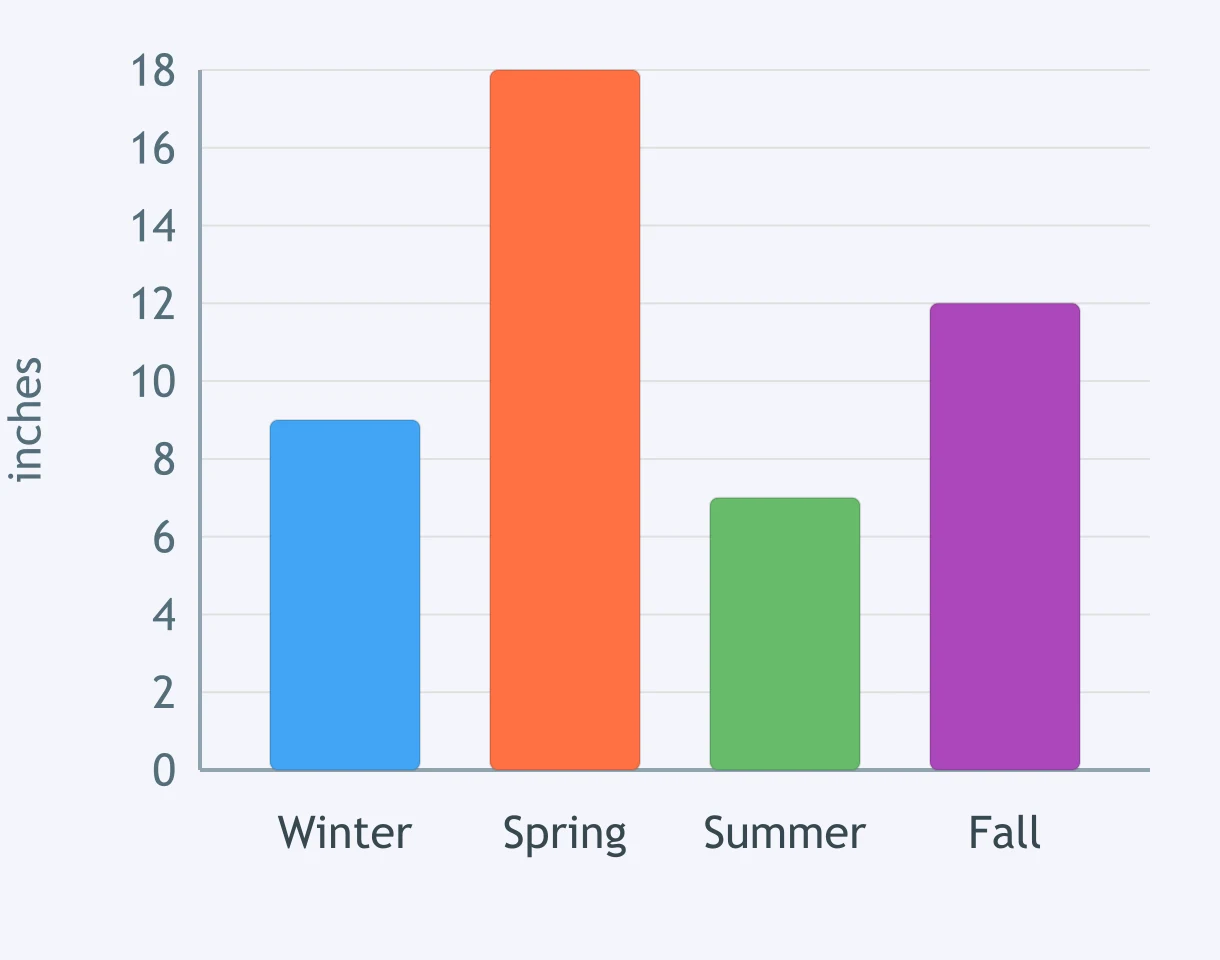
The bar graph shows the number of rainy days in each season in Willow Creek. Which season has the fewest rainy days there?
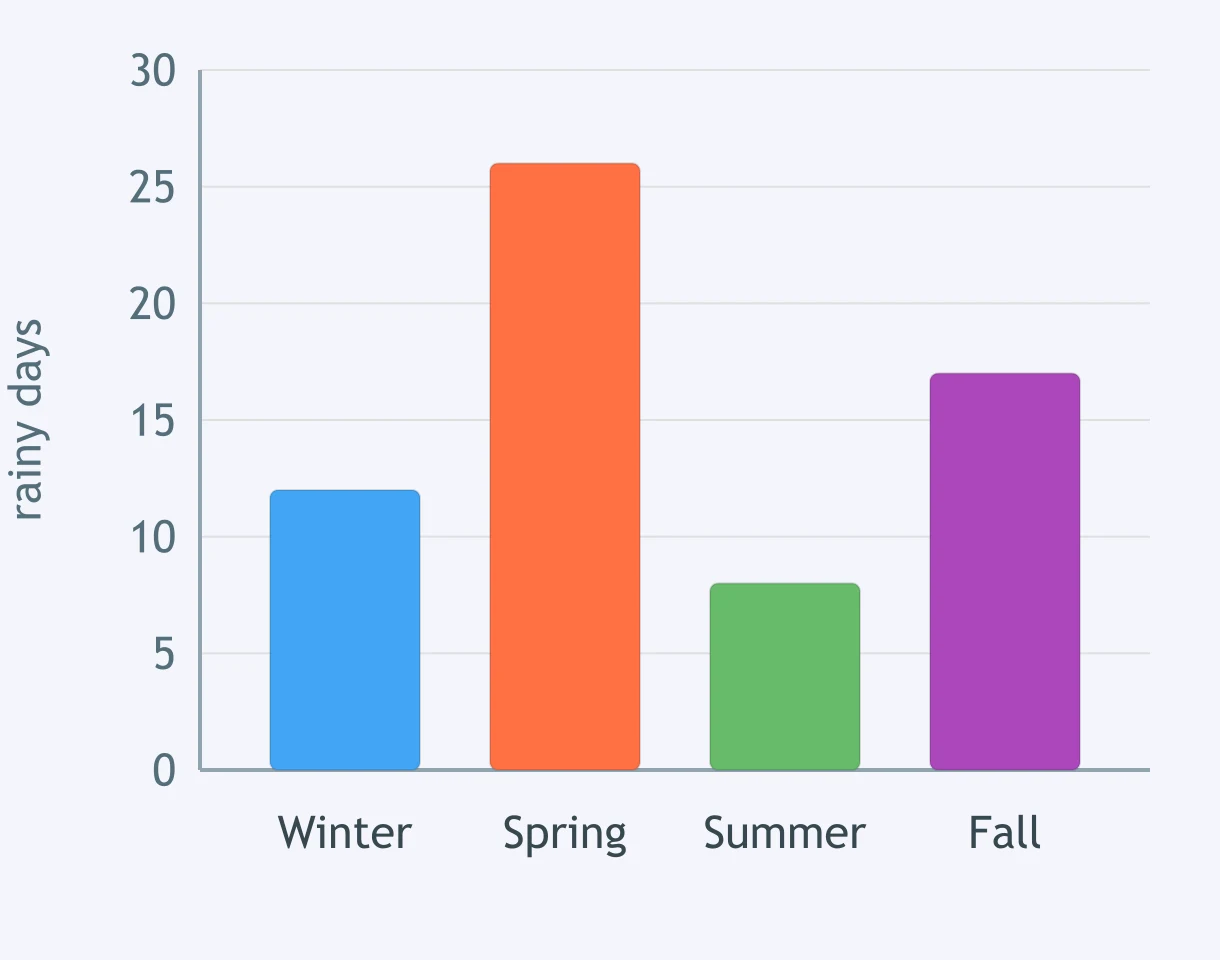
The bar graph shows the average temperature in Bayside for winter, spring, summer, and fall, in degrees Fahrenheit. Which season is the second warmest there?
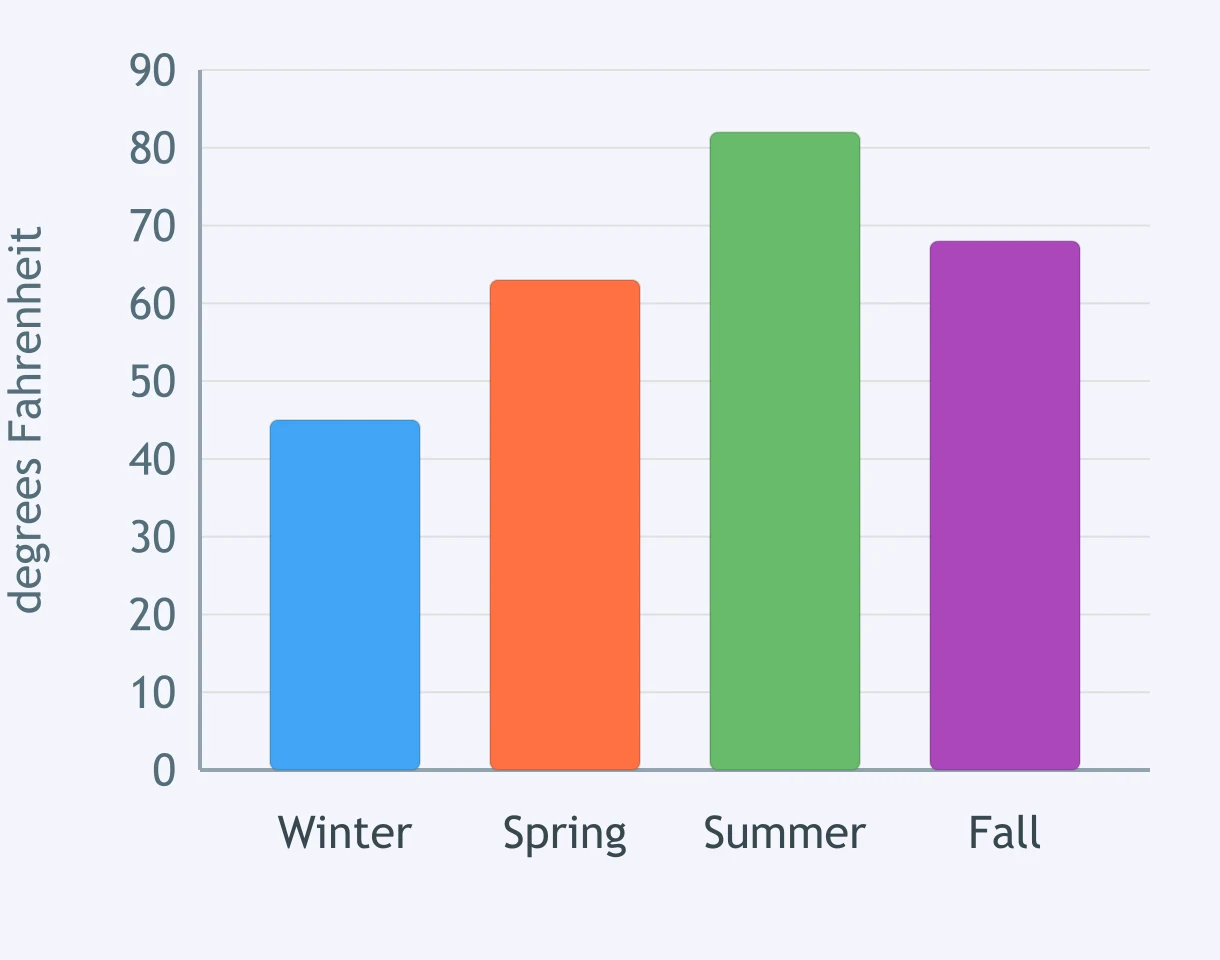
The bar graph shows the average temperature in Pine Ridge for winter, spring, summer, and fall, in degrees Fahrenheit. How do spring and fall compare there?
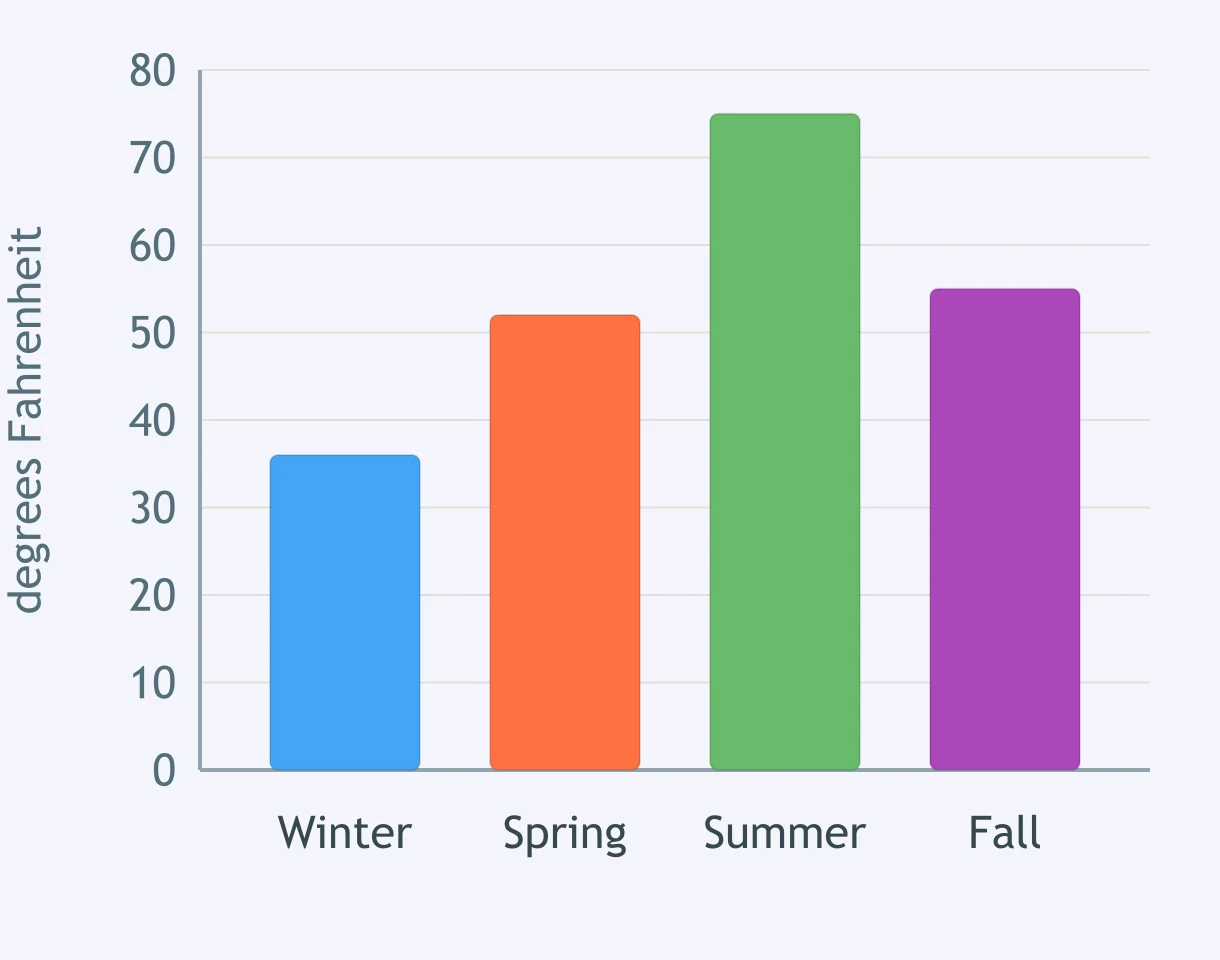
The bar graph shows the average snowfall in each season in Glenwood, in inches. What does the graph show about summer in Glenwood?
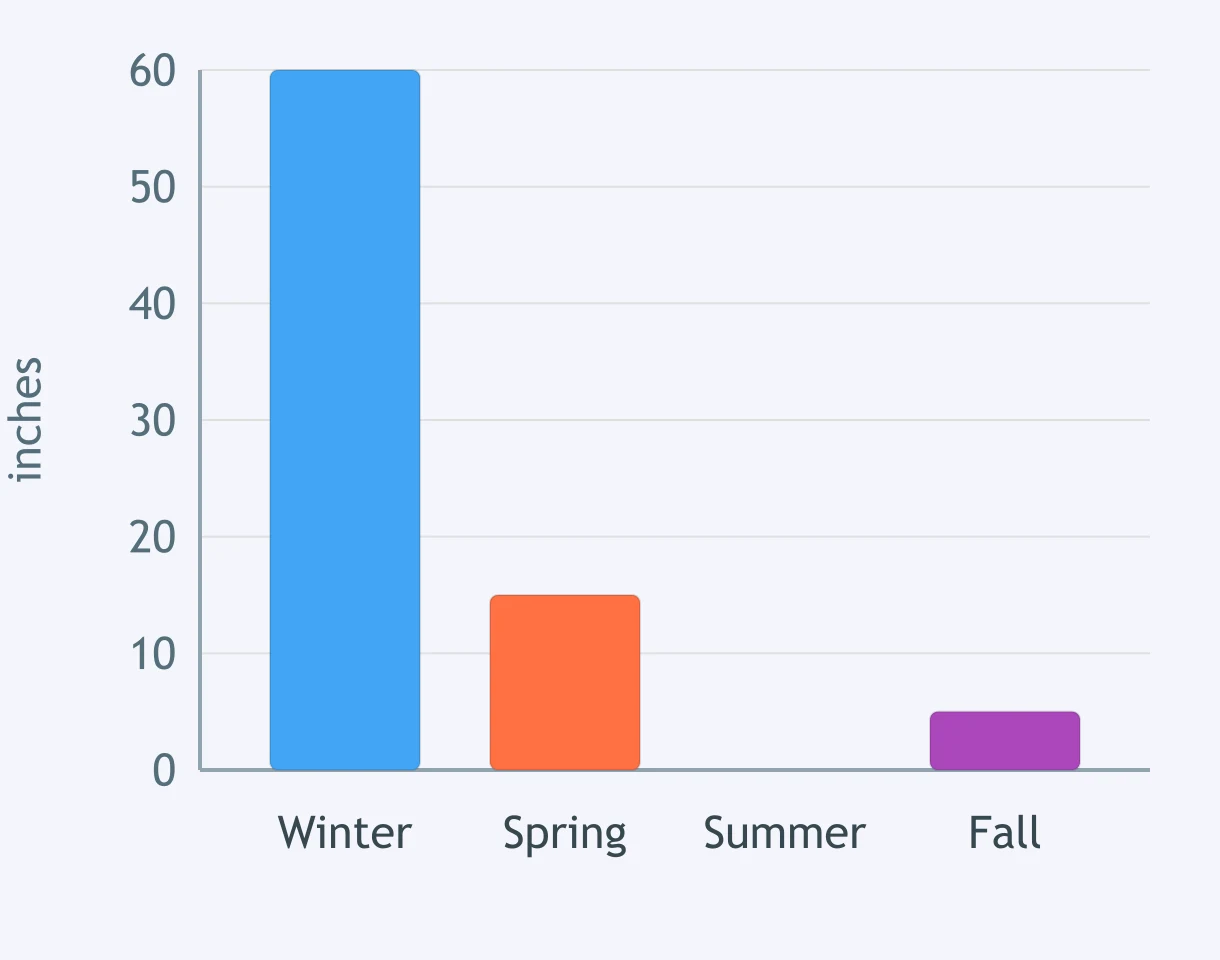
The bar graph shows the average temperature for each season in Cold Harbor, in degrees Fahrenheit. What pattern does the graph show about that town?
A chart shows the average summer temperature in Oak Harbor for the last thirty years. What does that chart describe?
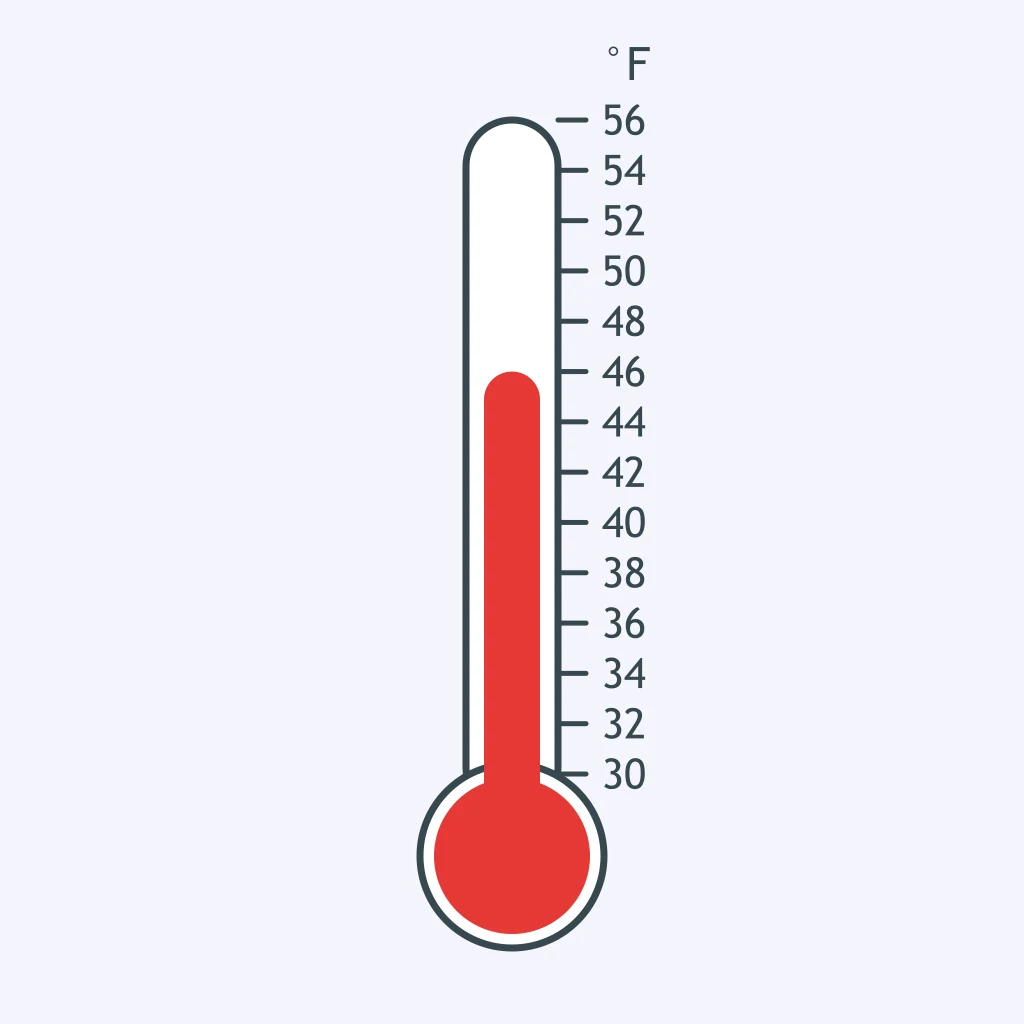
A thermometer outside a school in Bayside reads 46 degrees Fahrenheit this morning. What does that one reading describe?
Crack the passcode before the zombies get in.
Answer, then swat bugs for bonus points.
Race through questions at your own speed.
Same question on every screen. Fastest wins.

Pick a tile, answer, hit bonuses and steals.
Weather Hazards and Design Solutions
20 questions