Loading
by BlastRoom
Mixed practice across scatter plots, trend lines and two-way tables.
#us_grade_8_math

20 questions
One question set, multiple game modes. Tap any game to see it in action. Not sure which to pick?
Answer to place stones and capture territory.
Outrun the snow together.
Earn blasts, then hunt the other team.
Answer to earn energy, then climb.

The class blasts through walls together.
Bid on mystery lots. Most money wins.
Sell tours. Nice, standard, or a total scam.

Answer, restock, and serve the rush.
More correct answers pulls the rope your way.
Answer, then shoot down the alien wave.
Answer, then tap to leap the frozen ridge.
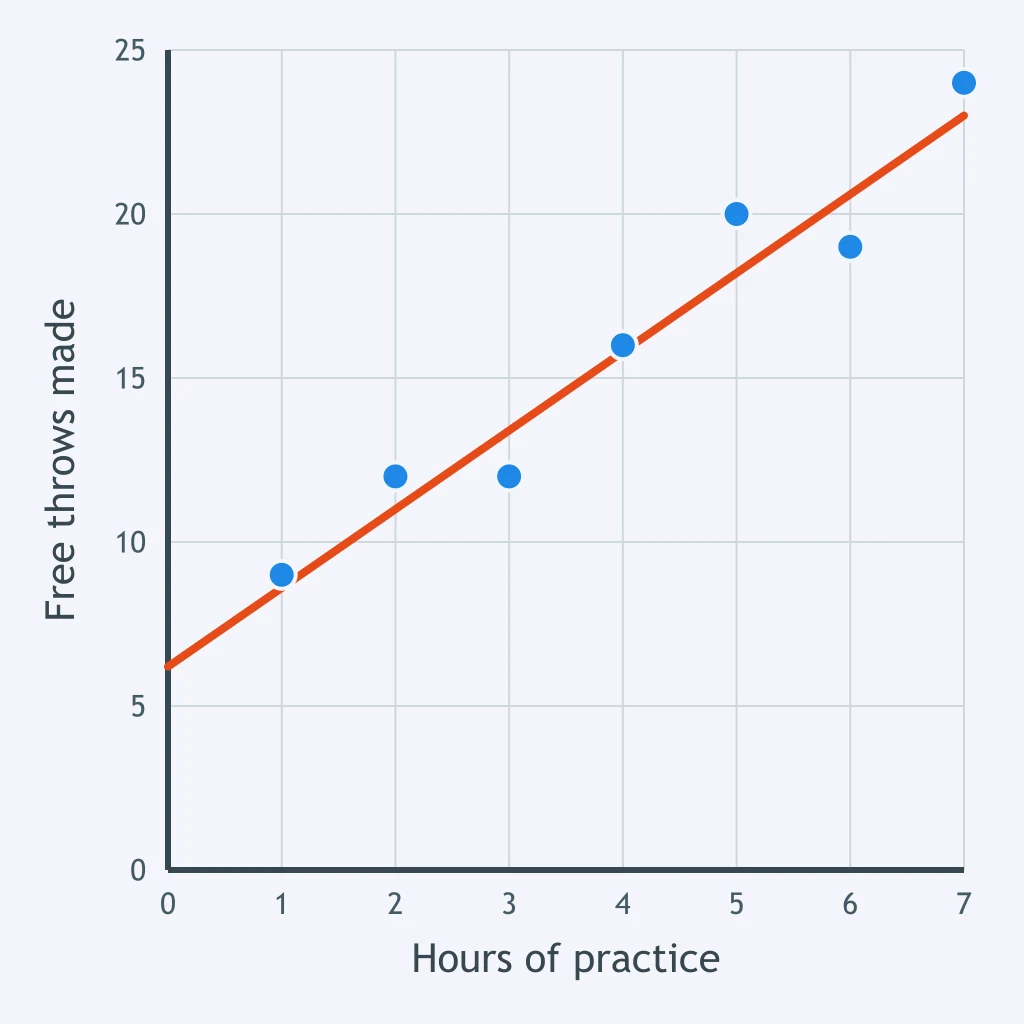
Each point on the plot gives one reading of hours of practice and the matching free throws made. How would you describe the relationship between the two?
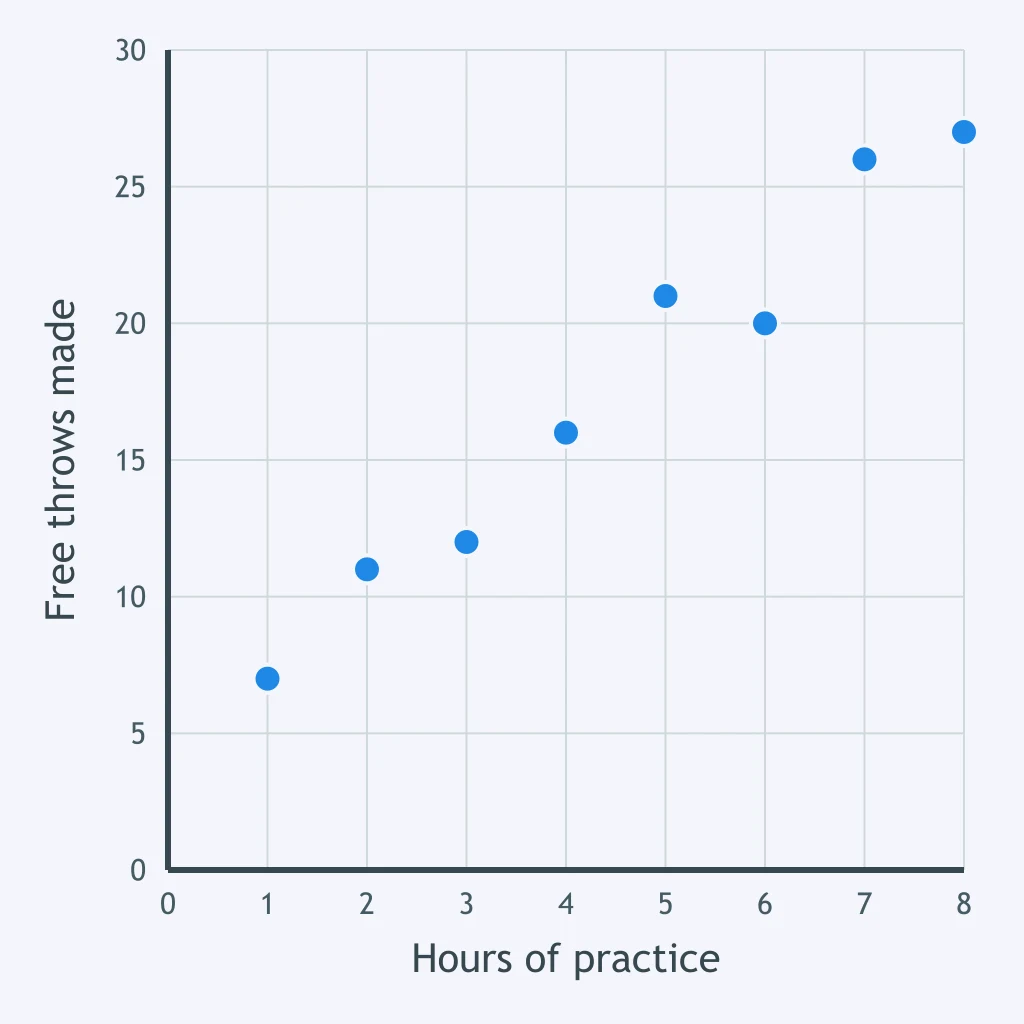
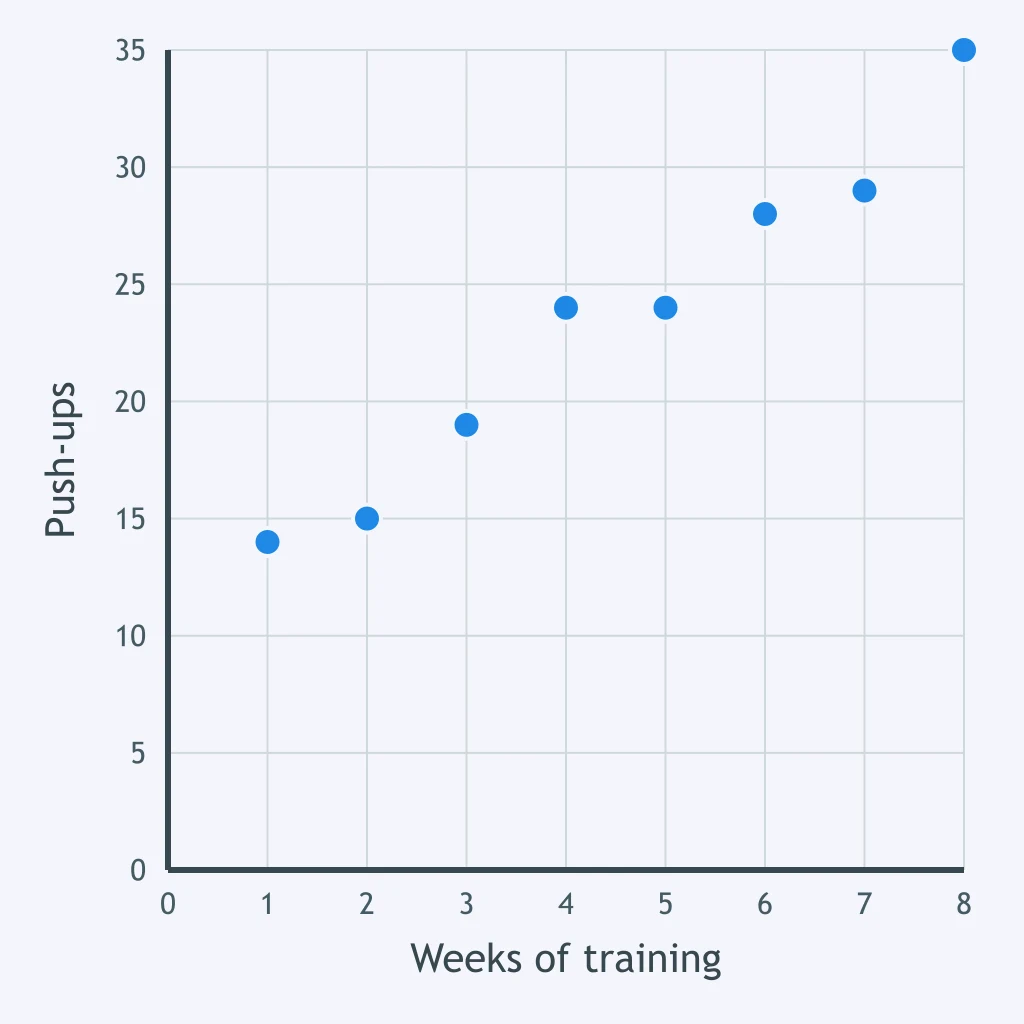
Each point on the plot gives one reading of weeks of training and the matching push-ups completed. Which plotted point sits well away from the pattern the others follow?
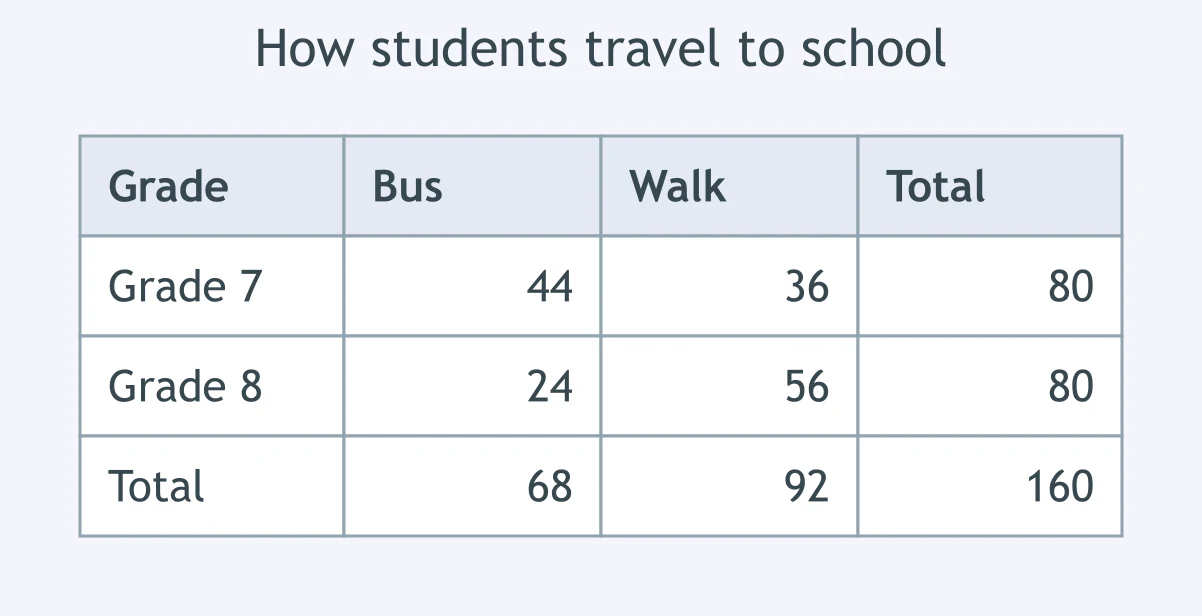
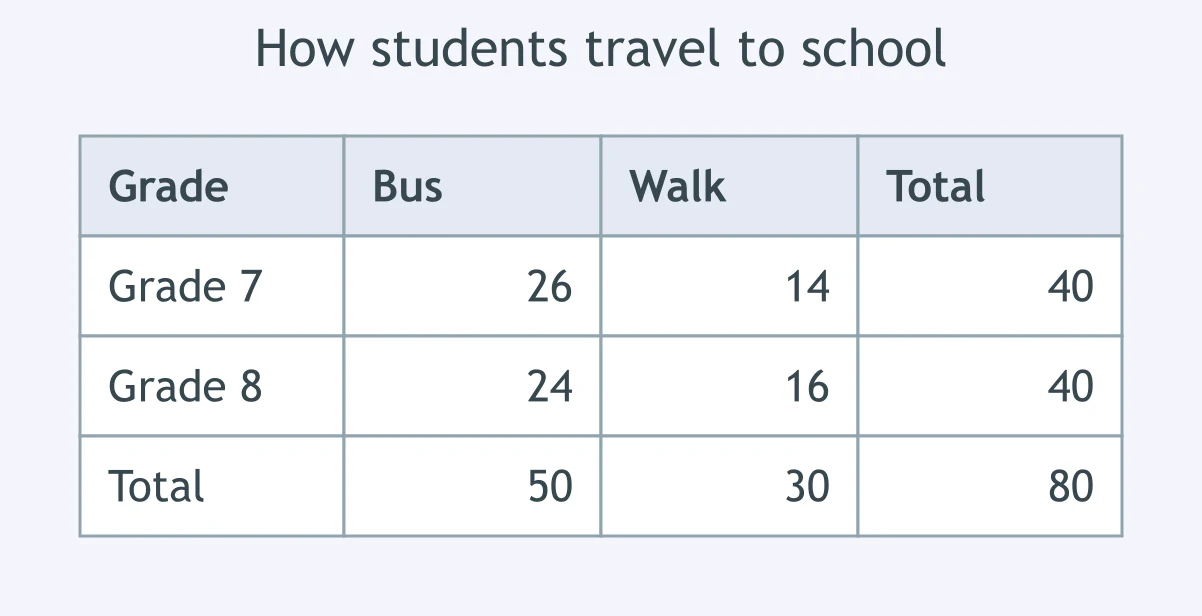
In the table, how many are counted in both the "Grade 8" row and the Bus column?
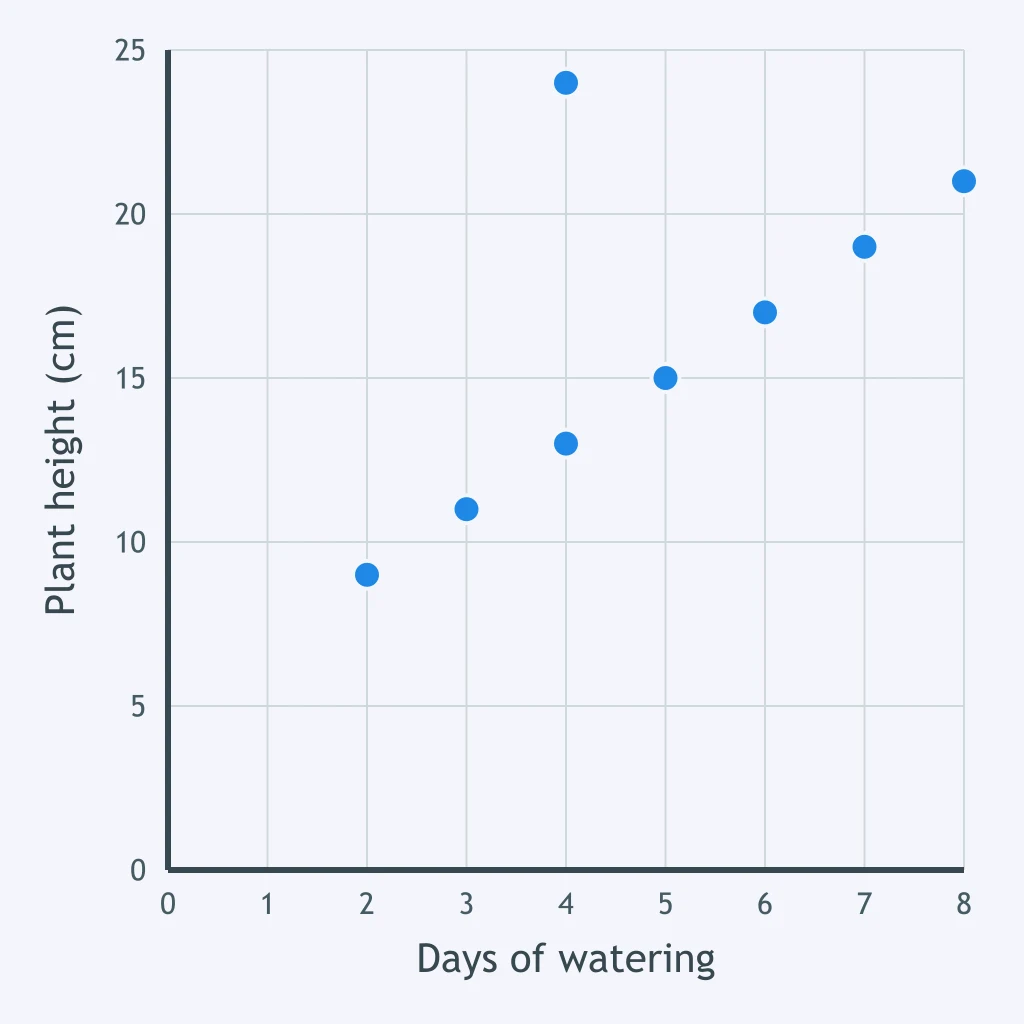
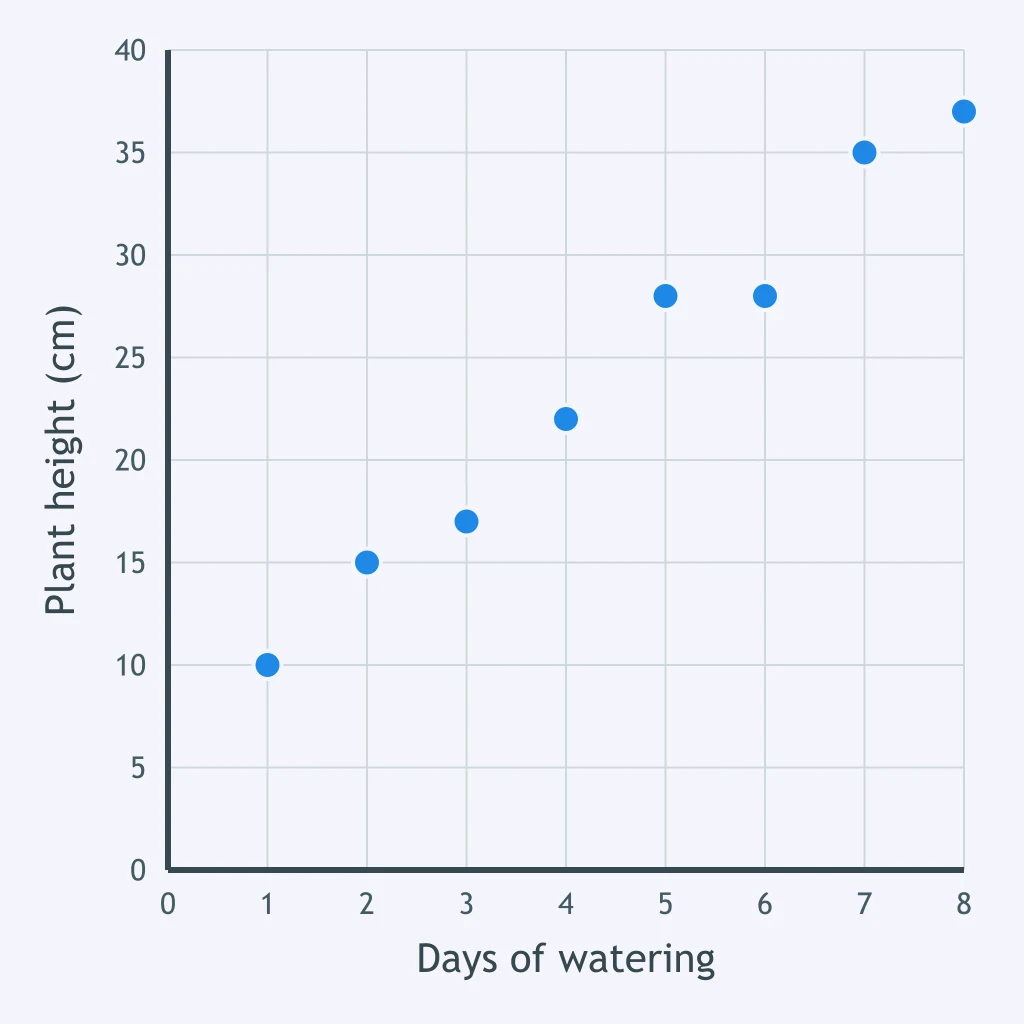
Each point on the plot gives one reading of days of watering and the matching plant height. Which plotted point sits well away from the pattern the others follow?
Each point on the plot gives one reading of weeks of training and the matching push-ups completed. How would you describe the relationship between the two?
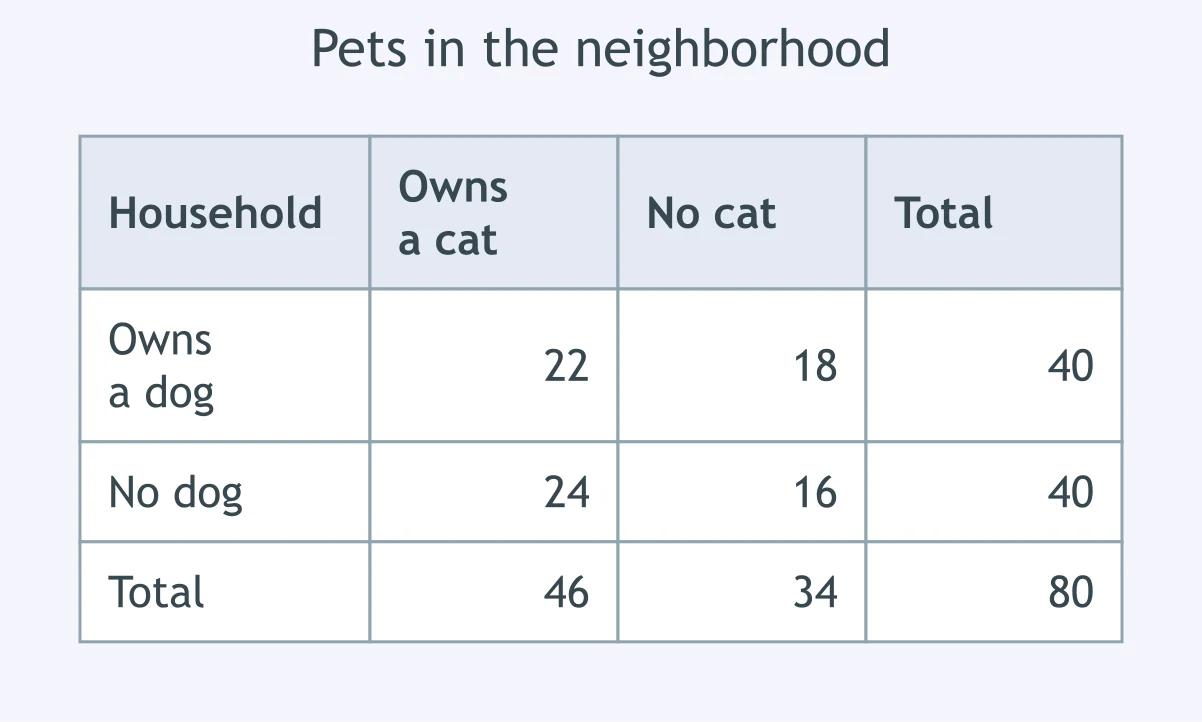
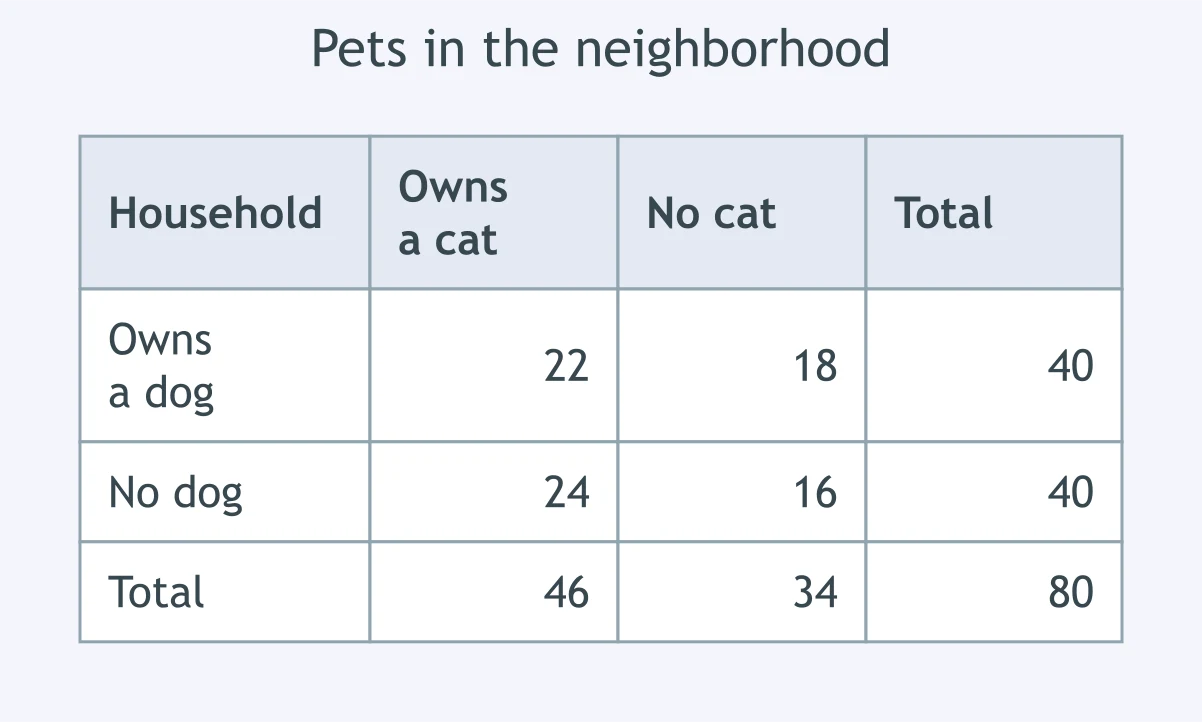
In the table, what percent of the "Owns a dog" row falls in the No cat column?
The trend line drawn through the data has the equation y = 2.4x + 6.2. Using that line, what would you predict for free throws made at 15 hours of practice?
In the table, how many are counted in both the "No dog" row and the Owns a cat column?
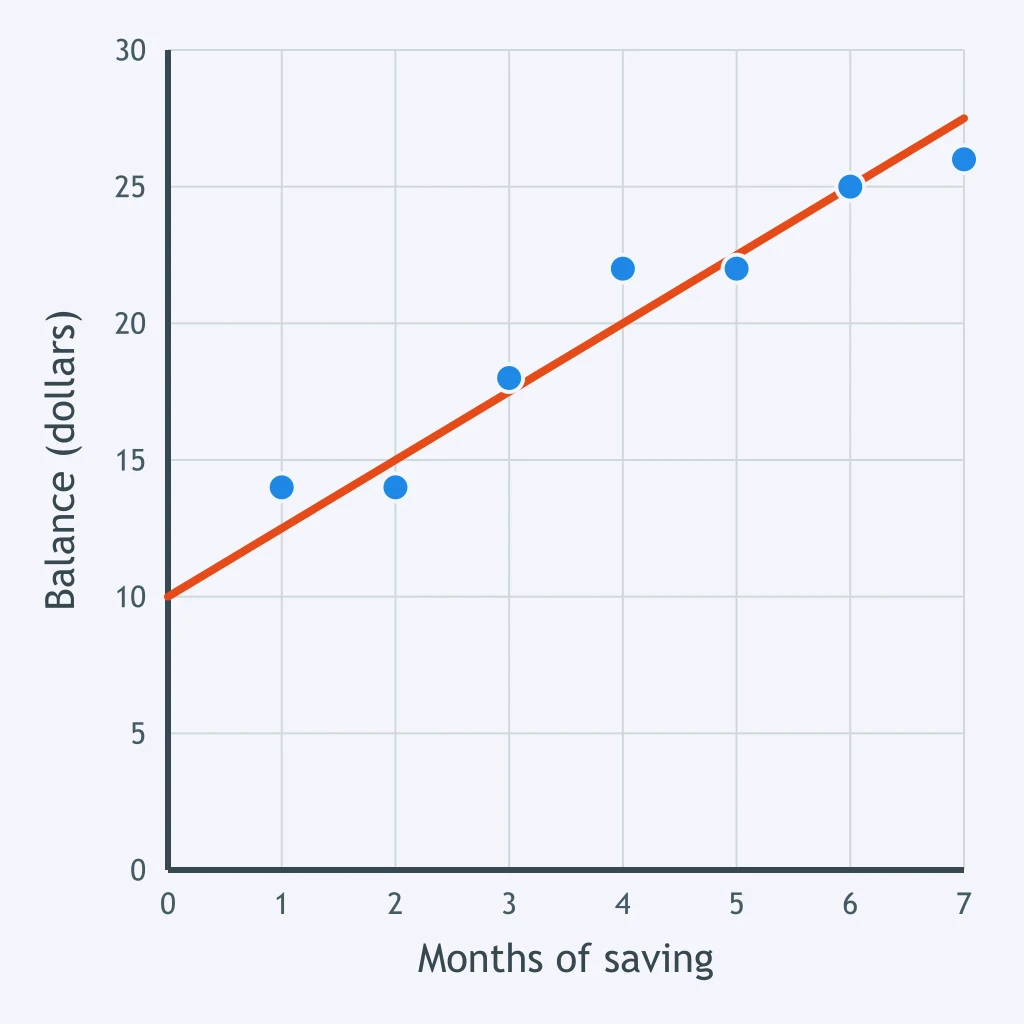
The trend line drawn through the data has the equation y = 2.5x + 10. What does the number 2.5 tell you about this data?
Each point on the plot gives one reading of days of watering and the matching plant height. How would you describe the relationship between the two?
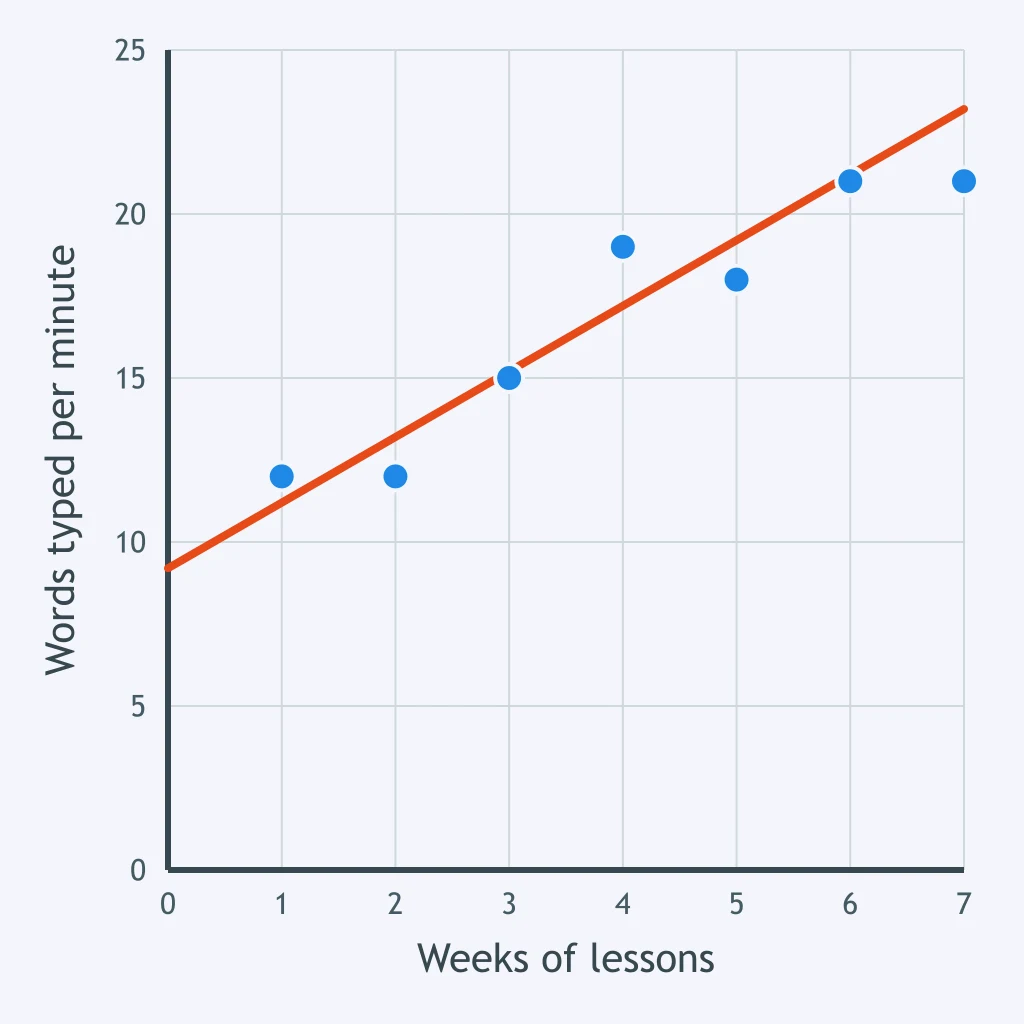
The trend line drawn through the data has the equation y = 2x + 9.2. Using that line, what would you predict for typing speed at 12 weeks of lessons?
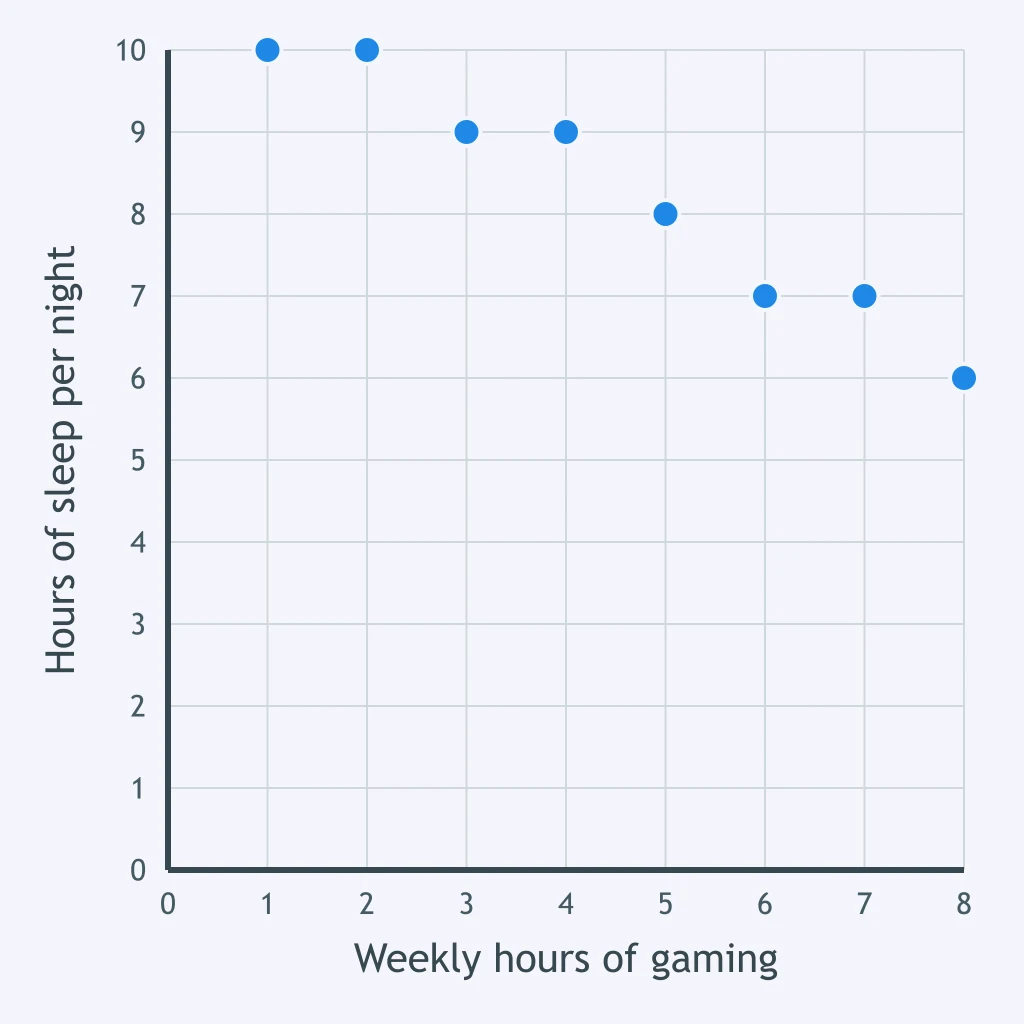
Each point on the plot gives one reading of weekly gaming hours and the matching nightly sleep. How would you describe the relationship between the two?
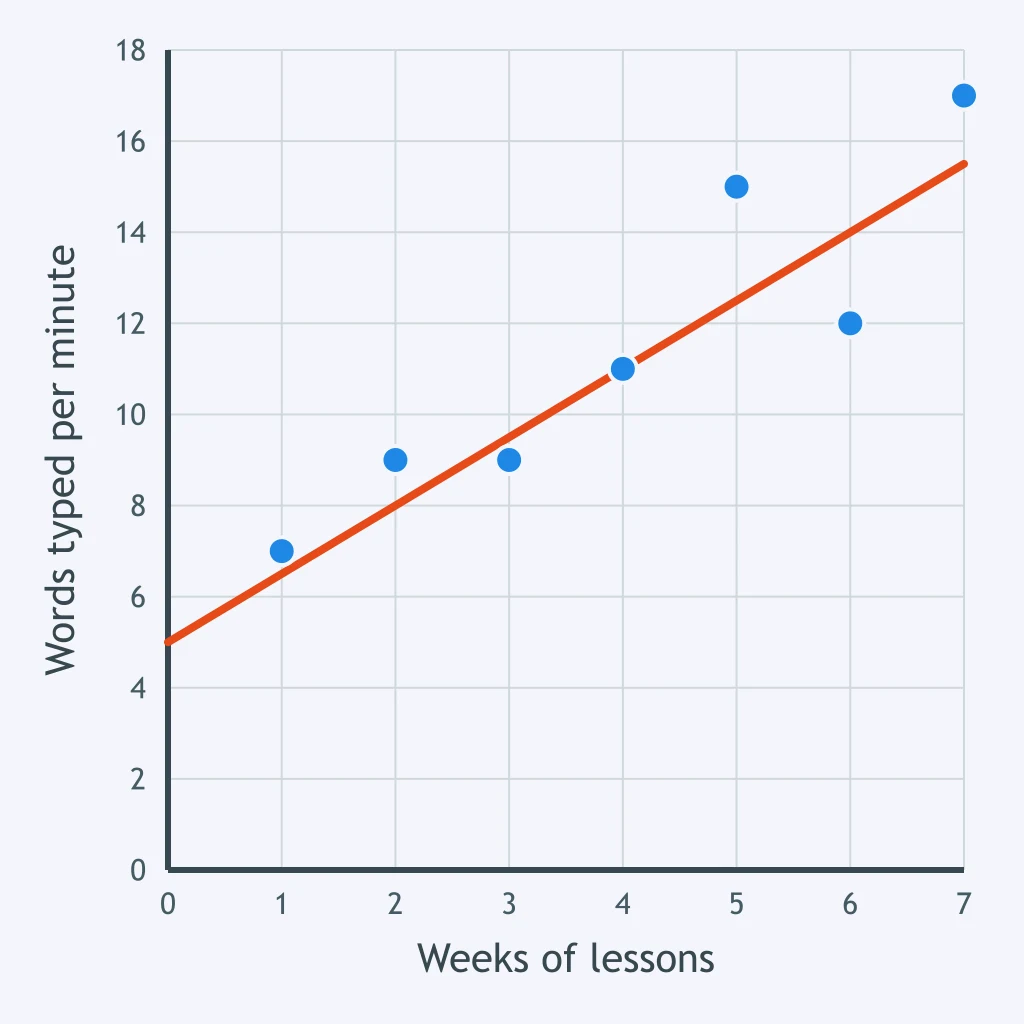
The trend line drawn through the data has the equation y = 1.5x + 5. Using that line, what would you predict for typing speed at 10 weeks of lessons?
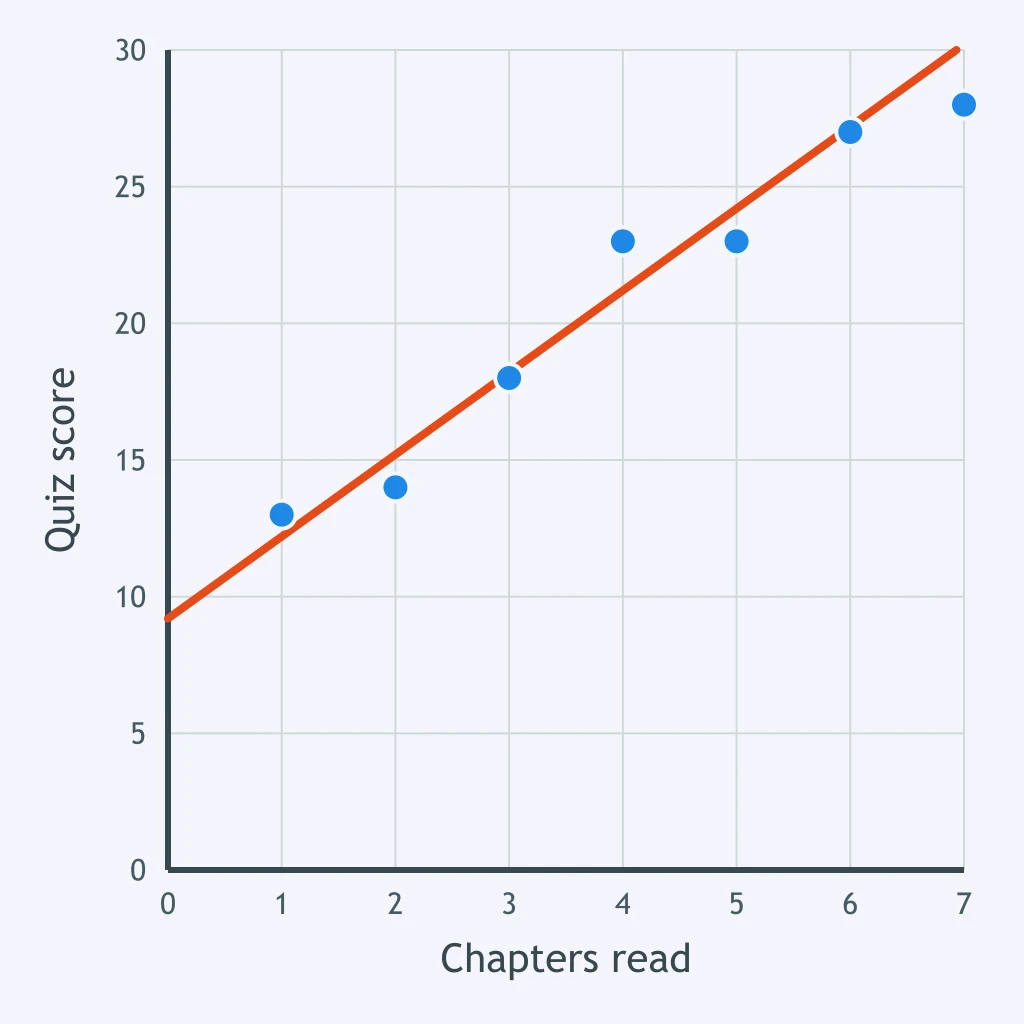
The trend line drawn through the data has the equation y = 3x + 9.2. Using that line, what would you predict for quiz score at 15 chapters read?
Each point on the plot gives one reading of months of saving and the matching account balance. Which statement best describes the shape of this data?
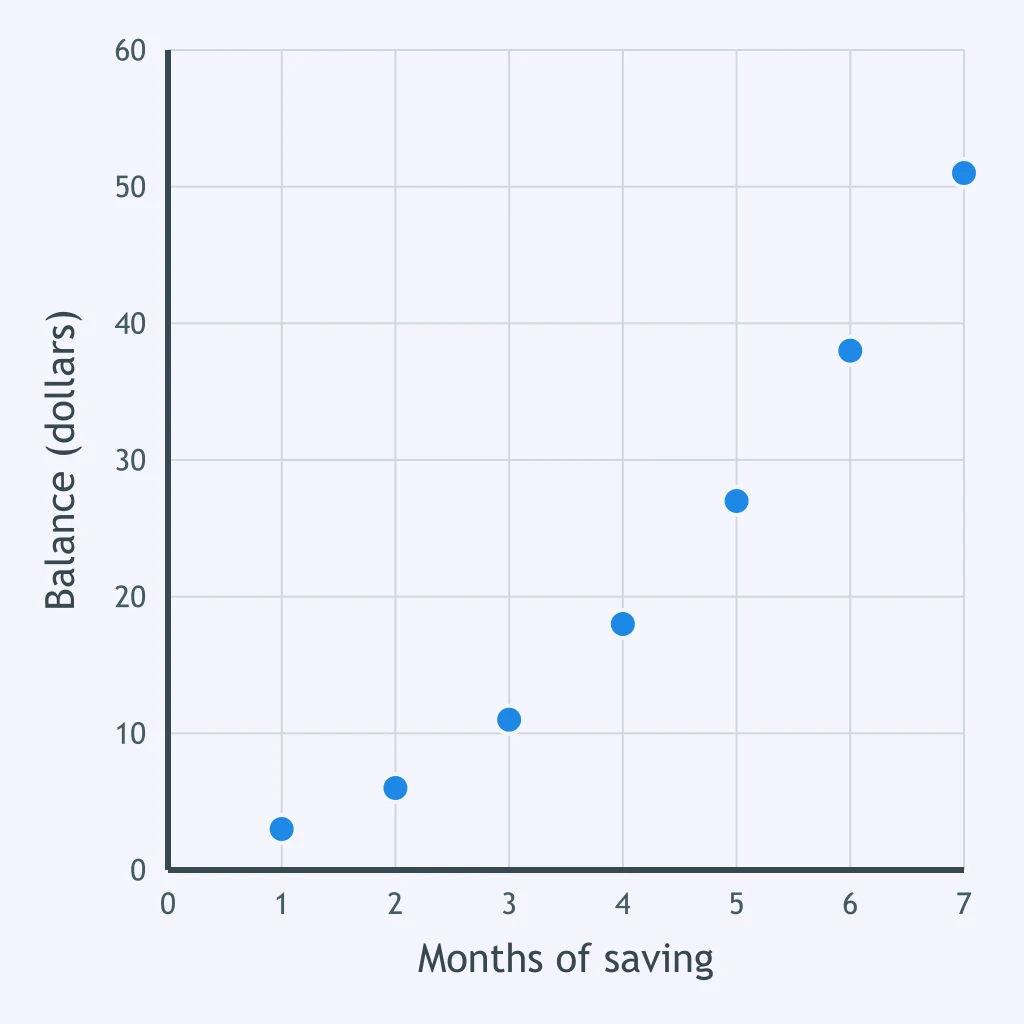
The trend line drawn through the data has the equation y = 3x + 10. Using that line, what would you predict for typing speed at 15 weeks of lessons?
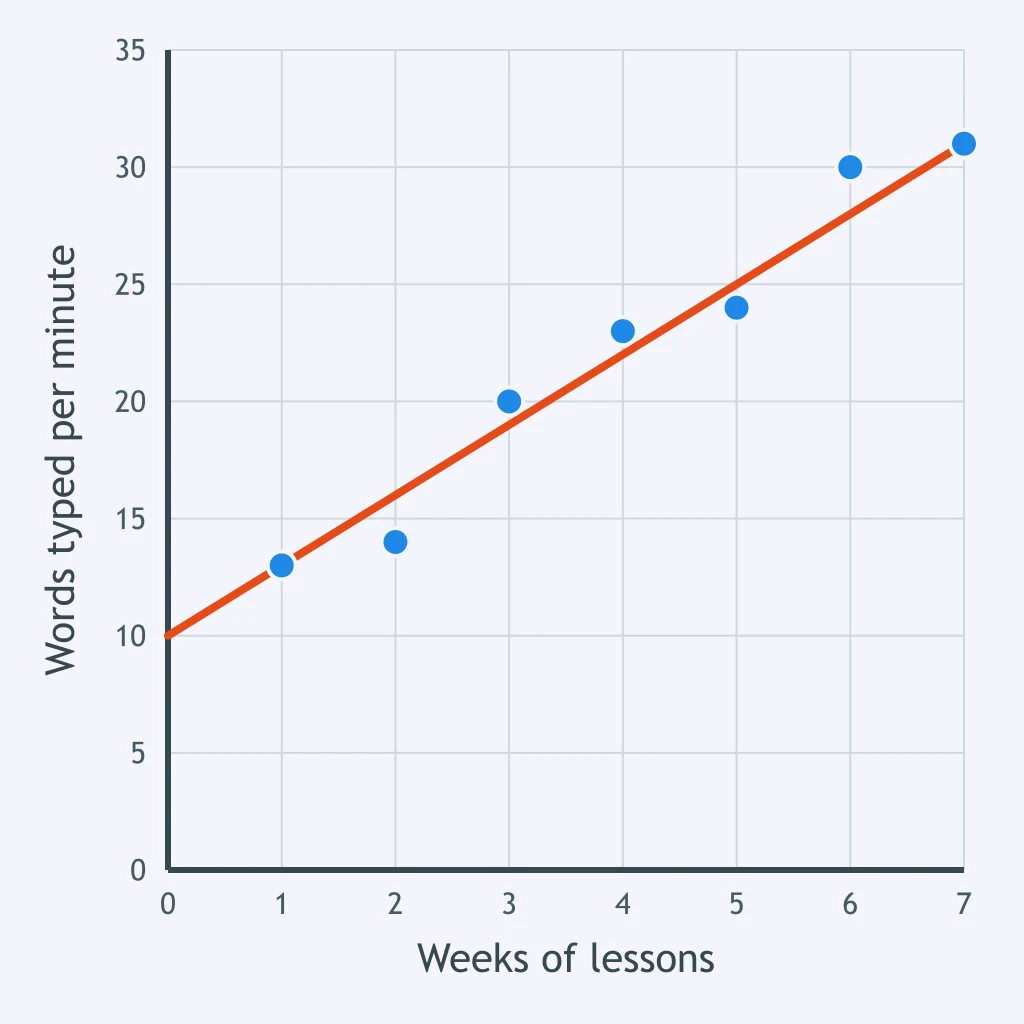
Each point on the plot gives one reading of months of saving and the matching account balance. How would you describe the relationship between the two?
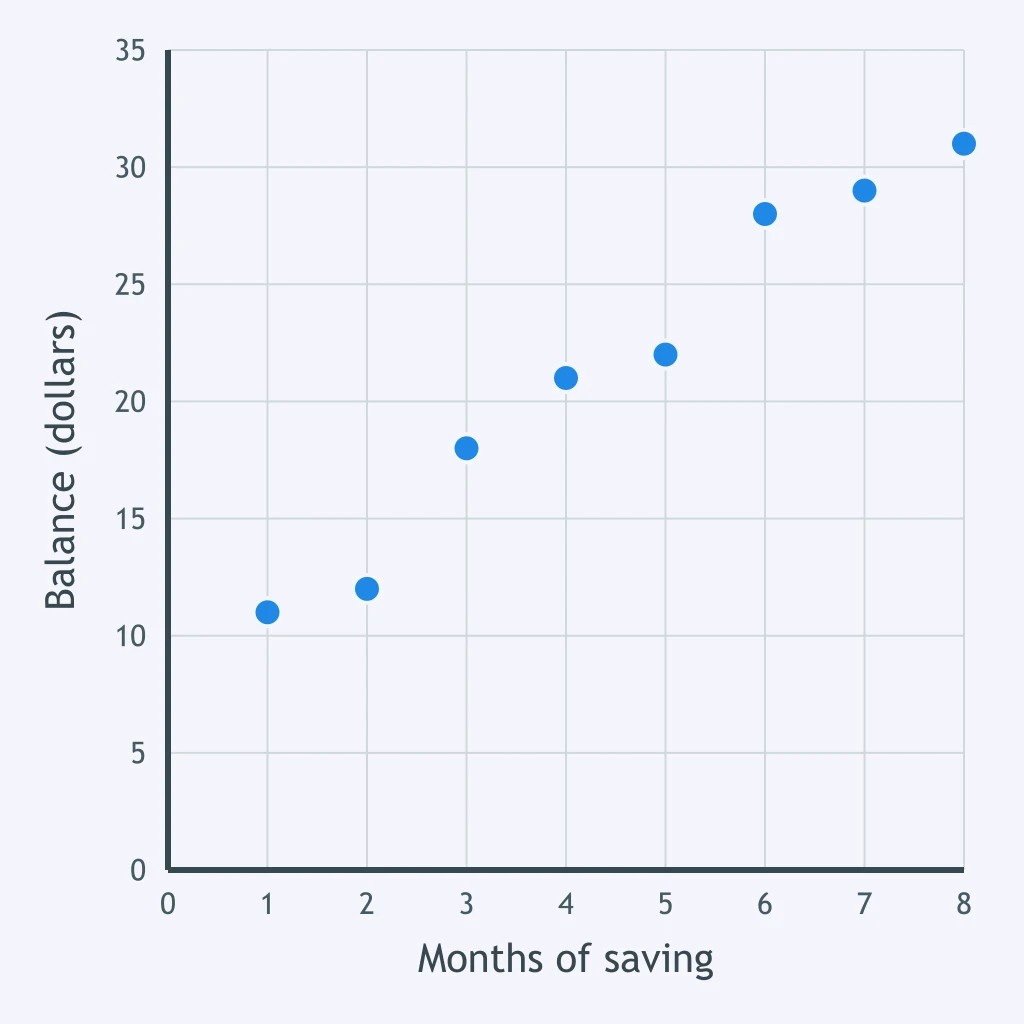
Each point on the plot gives one reading of hours of practice and the matching free throws made. Which plotted point sits well away from the pattern the others follow?
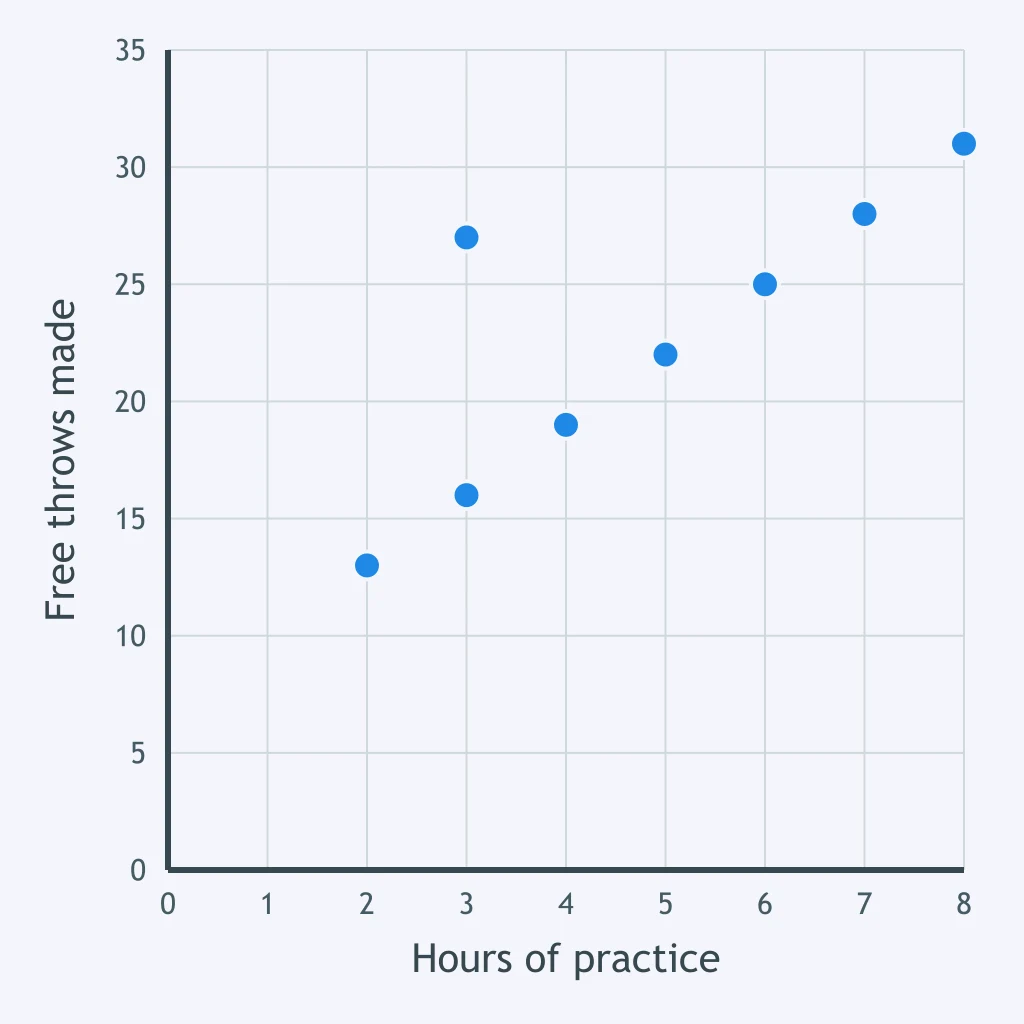
In the table, what percent of the "Grade 7" row falls in the Walk column?
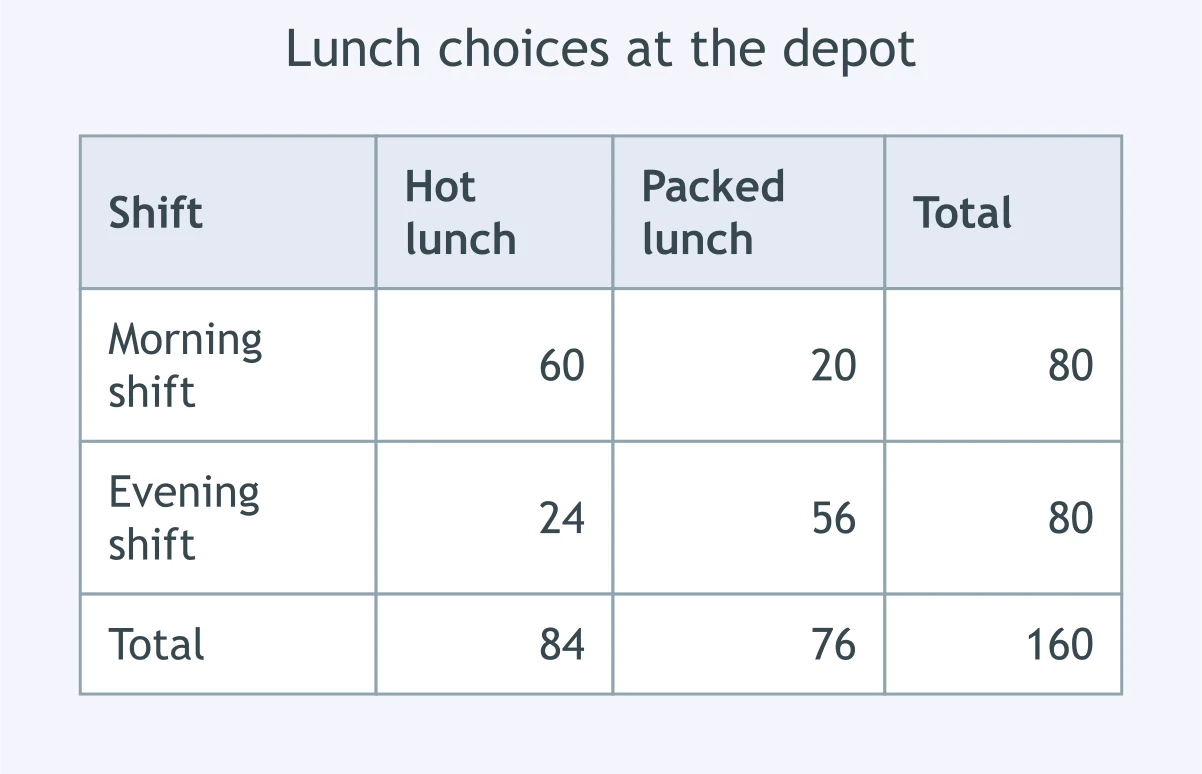
In the table, how many are counted in both the "Evening shift" row and the Hot lunch column?
Crack the passcode before the zombies get in.
Answer, then swat bugs for bonus points.
Race through questions at your own speed.
Same question on every screen. Fastest wins.

Pick a tile, answer, hit bonuses and steals.
Mixed Review: Pythagoras, Angles and Volume
40 questions