Loading
by BlastRoom
Mixed practice across the first half of the course: variable types, every display, center and spread, the normal model and regression.
#probability_and_statistics
60 questions
One question set, multiple game modes. Tap any game to see it in action. Not sure which to pick?
Answer to place stones and capture territory.
Outrun the snow together.
Earn blasts, then hunt the other team.
Answer to earn energy, then climb.

The class blasts through walls together.
Bid on mystery lots. Most money wins.
Sell tours. Nice, standard, or a total scam.

Answer, restock, and serve the rush.
More correct answers pulls the rope your way.
Answer, then shoot down the alien wave.
Answer, then tap to leap the frozen ridge.
A researcher records study minutes for each student in a random class of 28 and reports the average, 42 minutes. What is 42 minutes?
A school records the height of every ninth grader and finds the average height is 163 centimeters. What is 163 centimeters?
A survey asks each student to name a favorite lunch entree. What type of variable is favorite lunch entree?
A clinic samples 80 patients and records the number of visits each patient made last year. What is number of visits?
A factory checks a random sample of 50 bolts and reports that 6 percent are defective. What is the 6 percent?
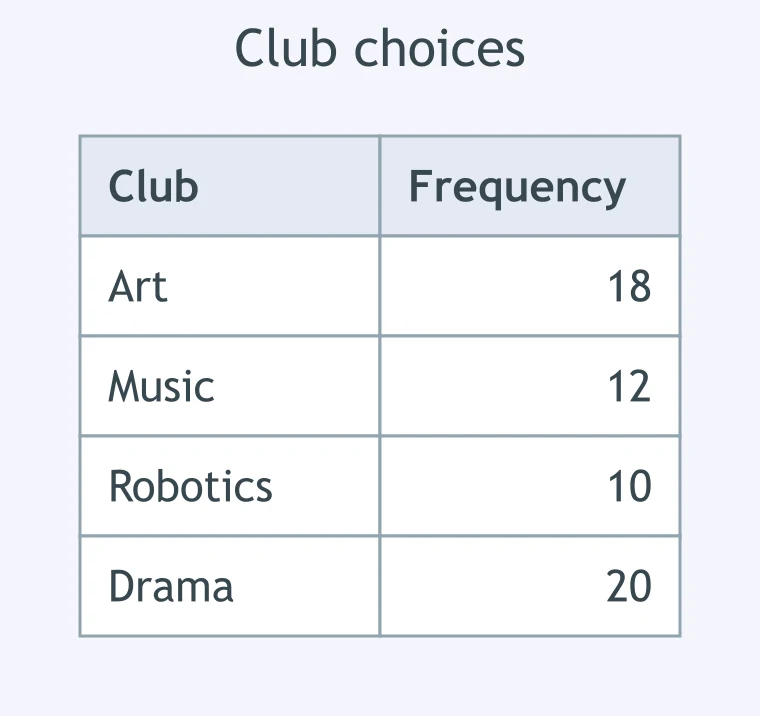
Use the frequency table of 60 club choices. What relative frequency chose Robotics? Round to the nearest tenth of a percent.
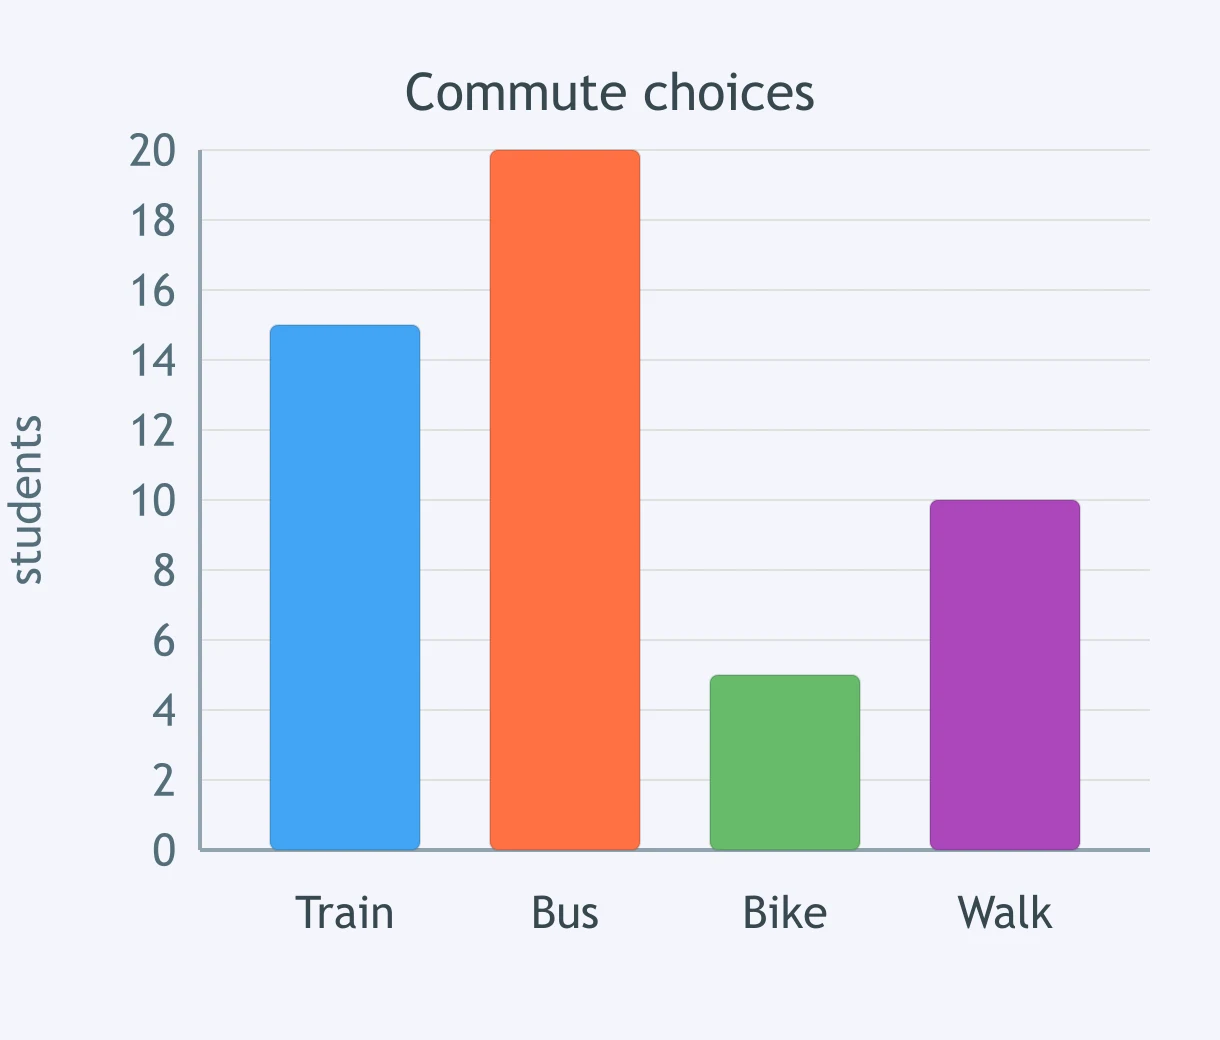
Use the bar graph of 50 students' commute choices. What percent traveled by bus?
A survey of 80 students lists after-school plans: sports 32, job 12, clubs 20, and home 16. What angle should represent clubs in a pie chart?
A lunch table has 90 orders: vegetarian 27 and nonvegetarian 63. What is the relative frequency of nonvegetarian orders as a decimal to three places?
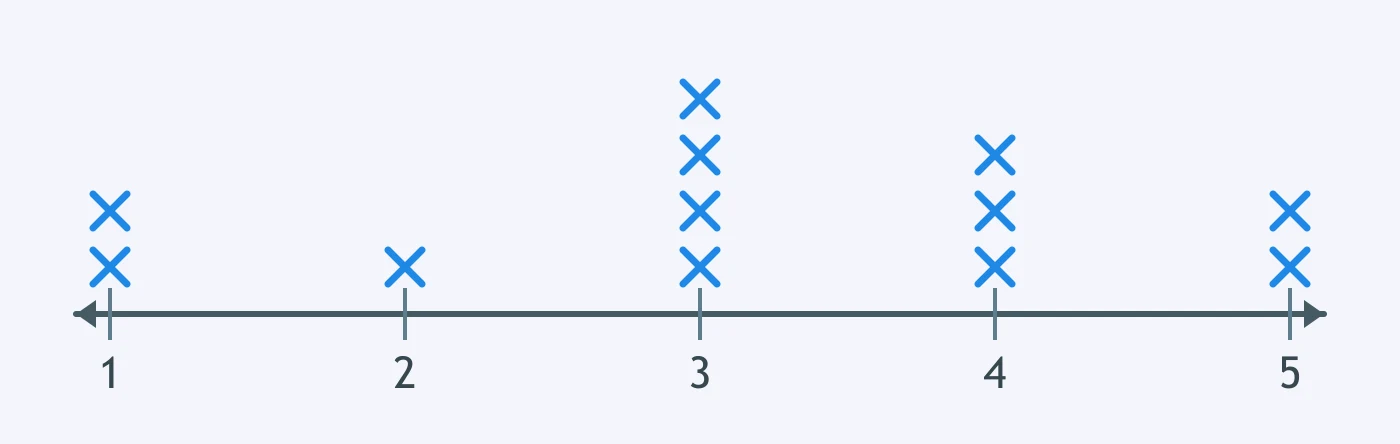
Use the dot plot of books read last month. How many students are represented?
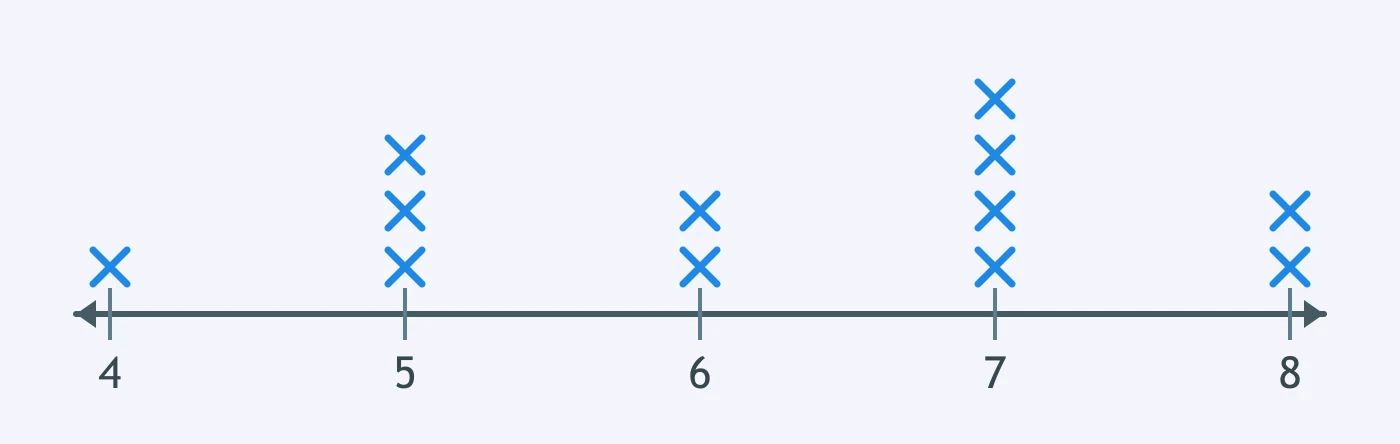
Use the dot plot of weekly exercise hours. What is the median number of hours?
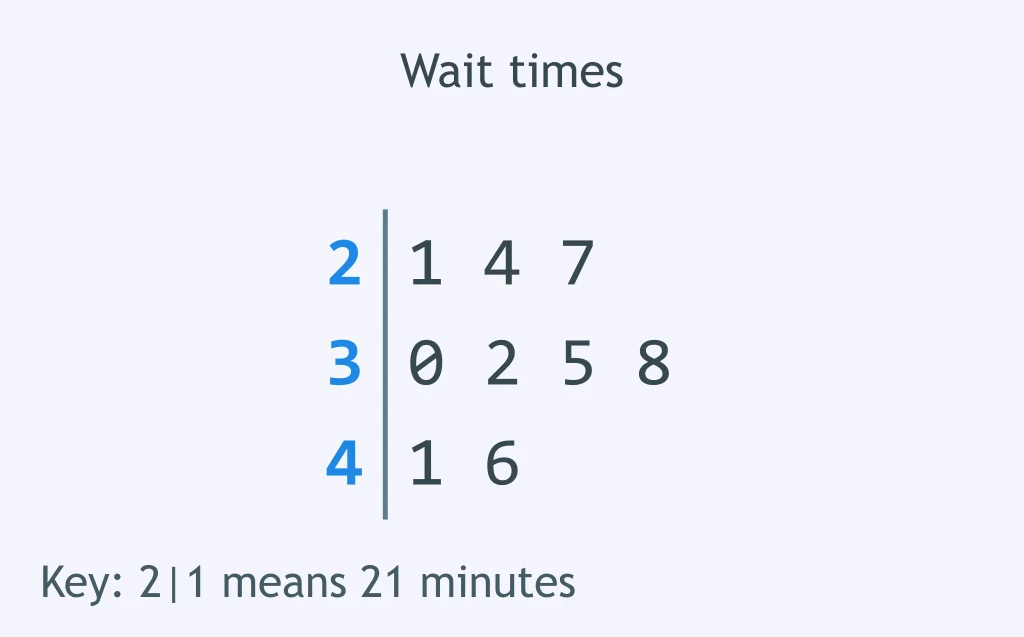
Use the stem-and-leaf plot of wait times. What is the range?
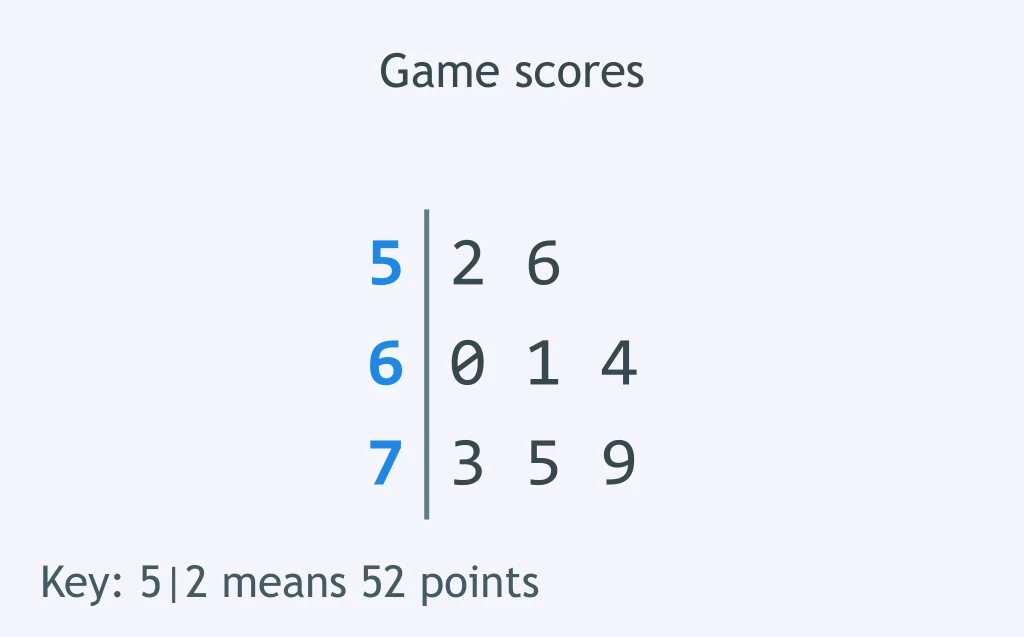
Use the stem-and-leaf plot of game scores. What is the third smallest score?
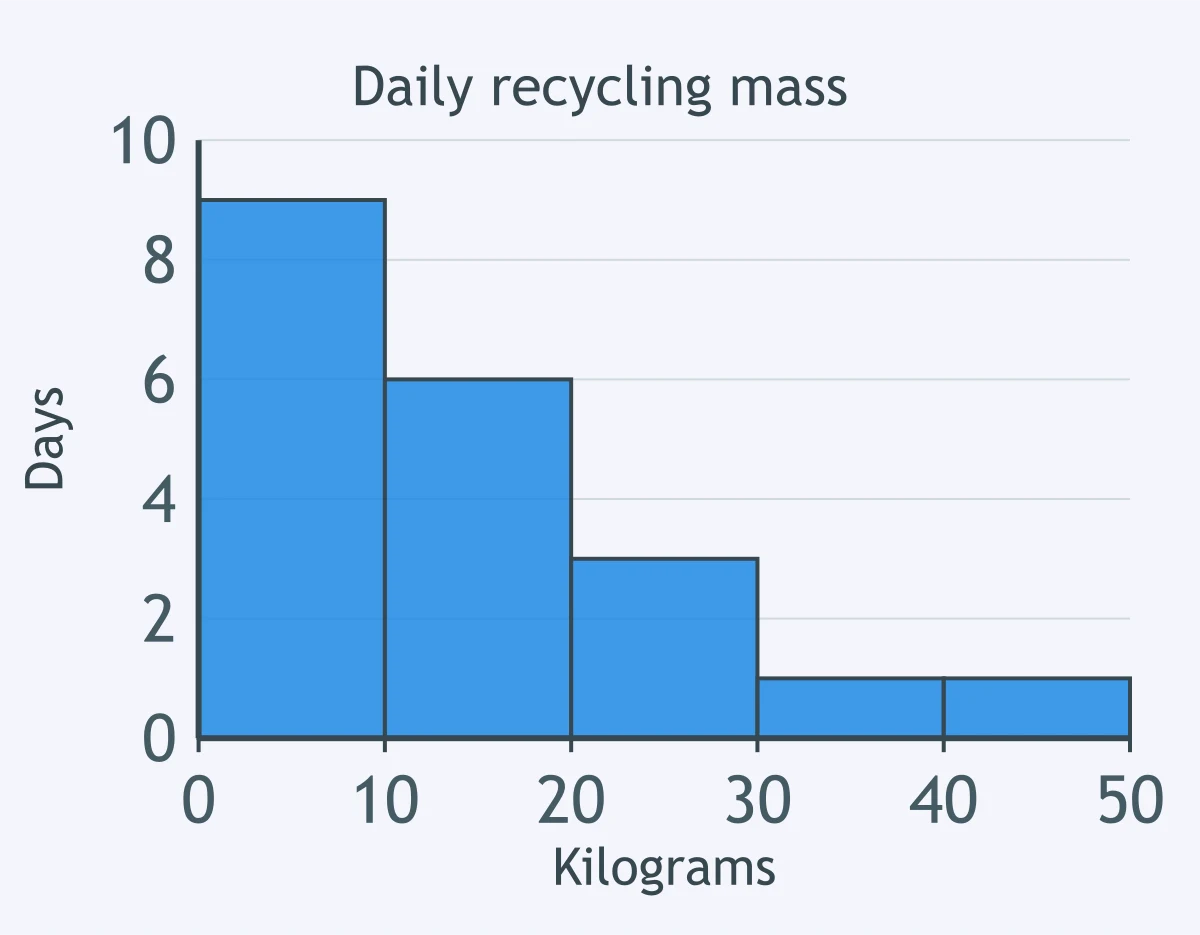
Look at the histogram of daily recycling masses. What is the distribution's shape?
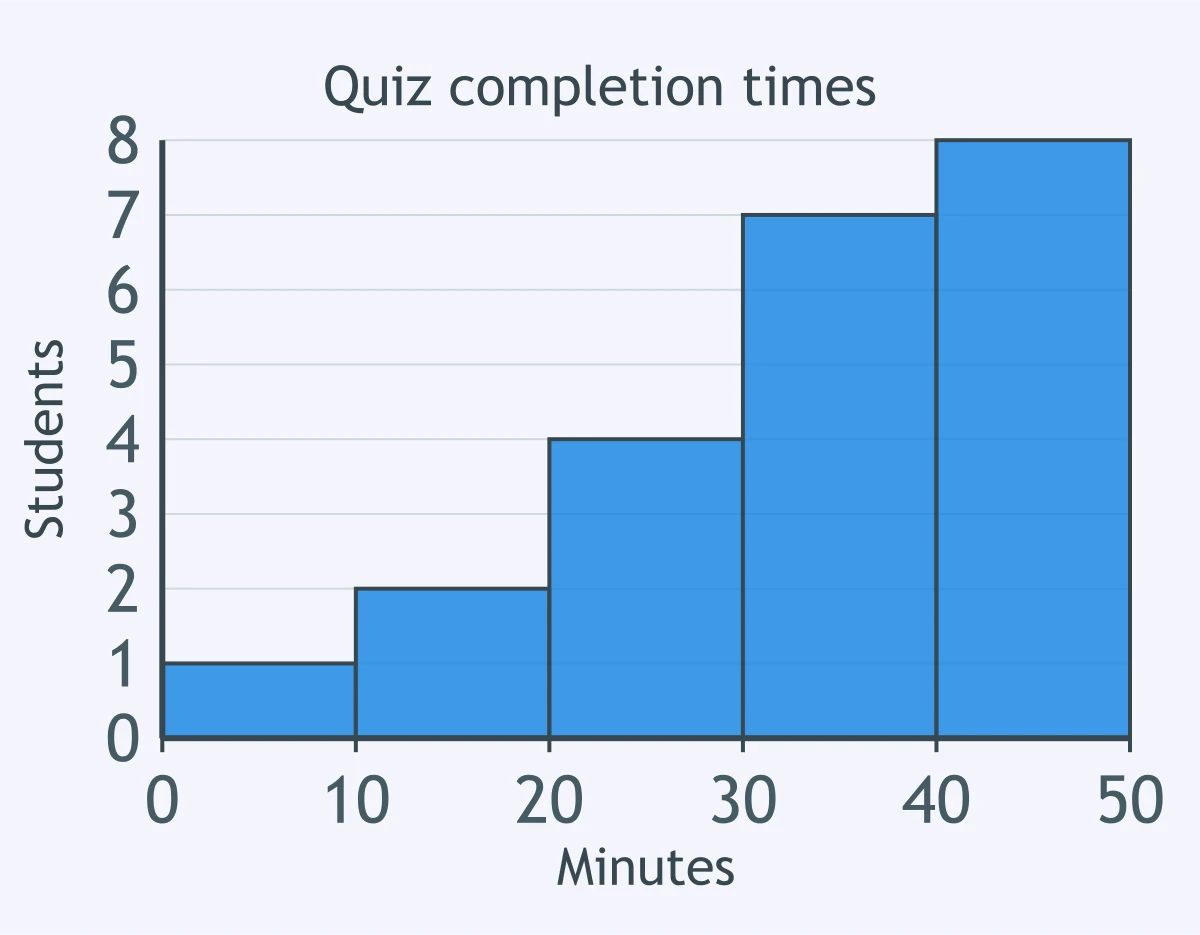
Look at the histogram of quiz completion times. What is the distribution's shape?
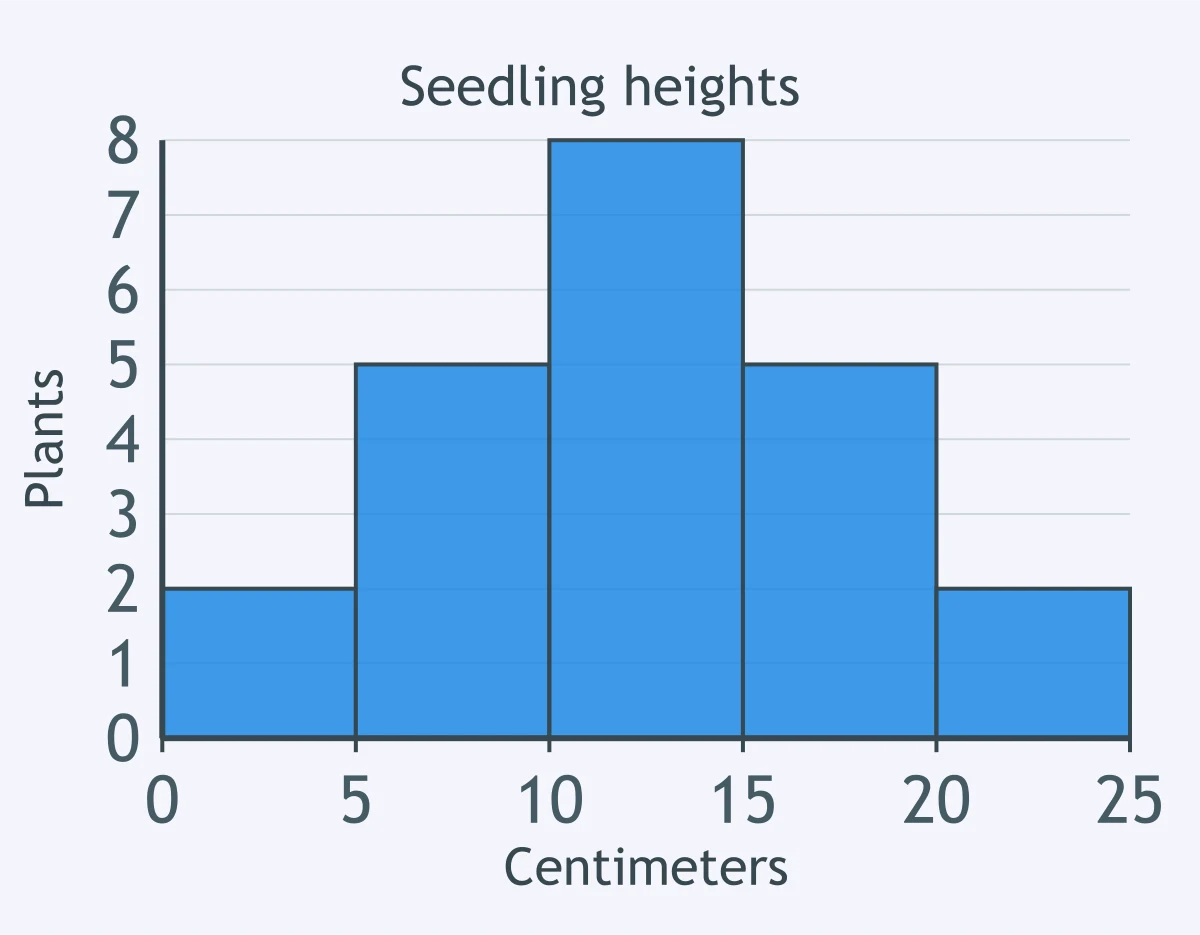
Look at the histogram of seedling heights. What is the distribution's shape?
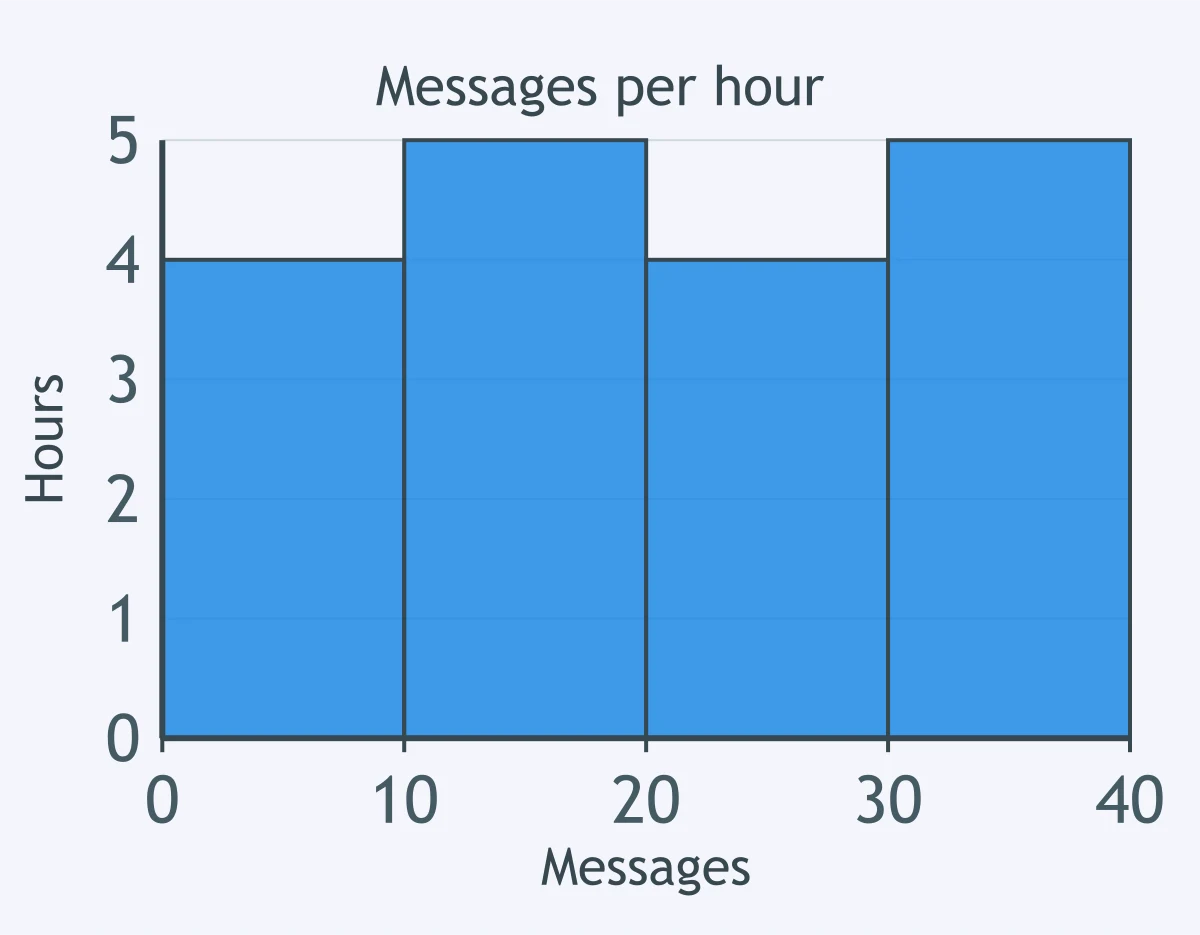
Look at the histogram of text messages sent per hour. What is the distribution's shape?
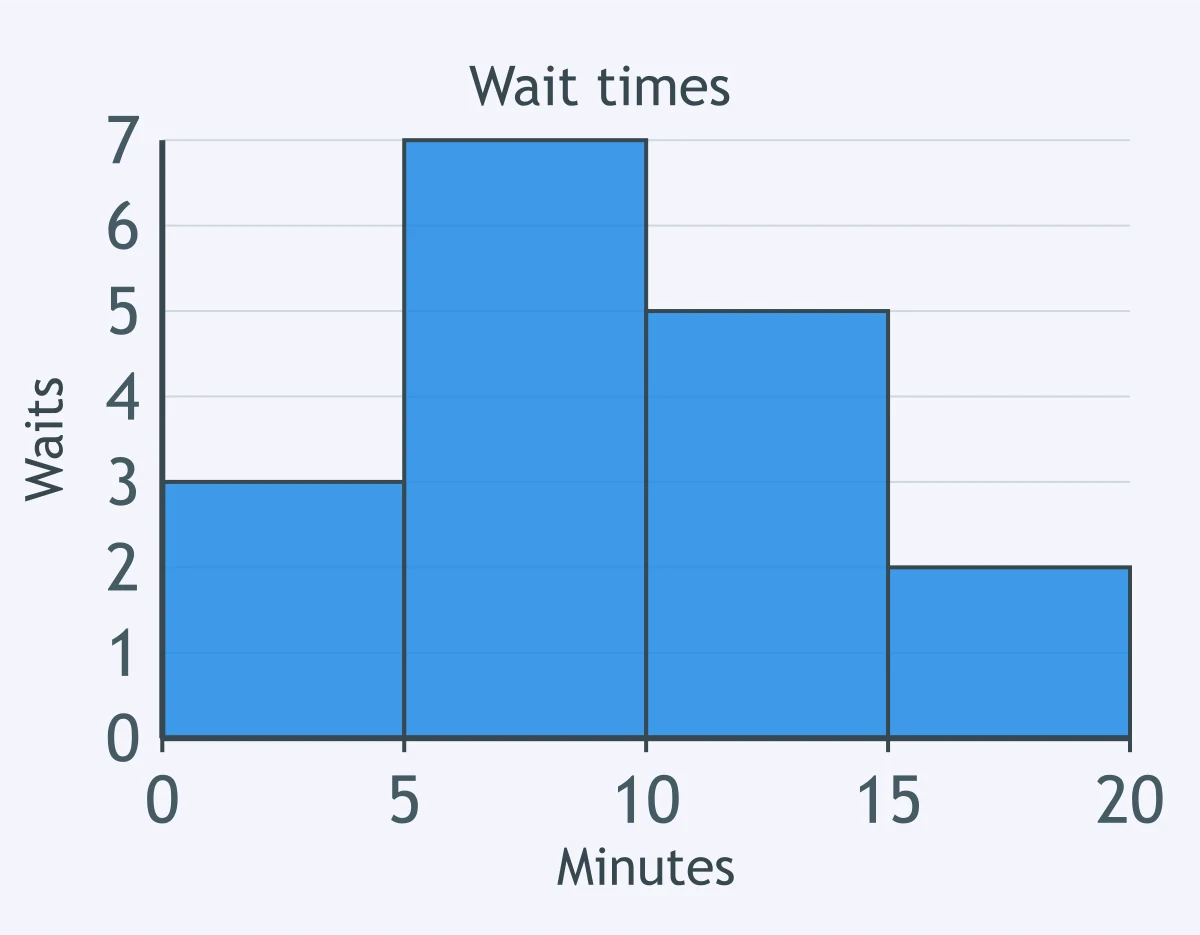
Use the histogram of wait times. How many waits were at least 5 minutes but less than 10 minutes?
The daily late-bus counts are 4, 5, 6, 6, 8, 9, 10, 11, and 20. What is the median count?
A garden records rainfall amounts of 2, 0, 5, 7, 1, and 3 millimeters over six days. What is the mean rainfall?
A class has quiz scores 80, 85, 85, 90, 92, 92, 92, and 98. What is the mode?
Home prices in thousands of dollars are 180, 190, 195, 205, 210, and 760. Should the report use mean or median as the more resistant center?
A team scored 12, 14, 18, 16, and 20 goals over five months. If it scores 22 goals next month, what is the new mean?
The daily high temperatures are 18, 20, 21, 24, 24, 27, and 29 degrees Celsius. What is the range?
The ordered service times are 3, 5, 6, 8, 10, 12, 13, and 17 minutes. What is the interquartile range?
The battery lives are 4, 6, 7, 10, and 18 hours. What is the five-number summary?
Defects per shift are 2, 4, 4, and 6, with mean 4. What is the sample standard deviation, rounded to one decimal?
Team A scores are 10, 12, 14, 16, and 18. Team B scores are 9, 9, 14, 19, and 19. Which team has the larger range, and by how much?
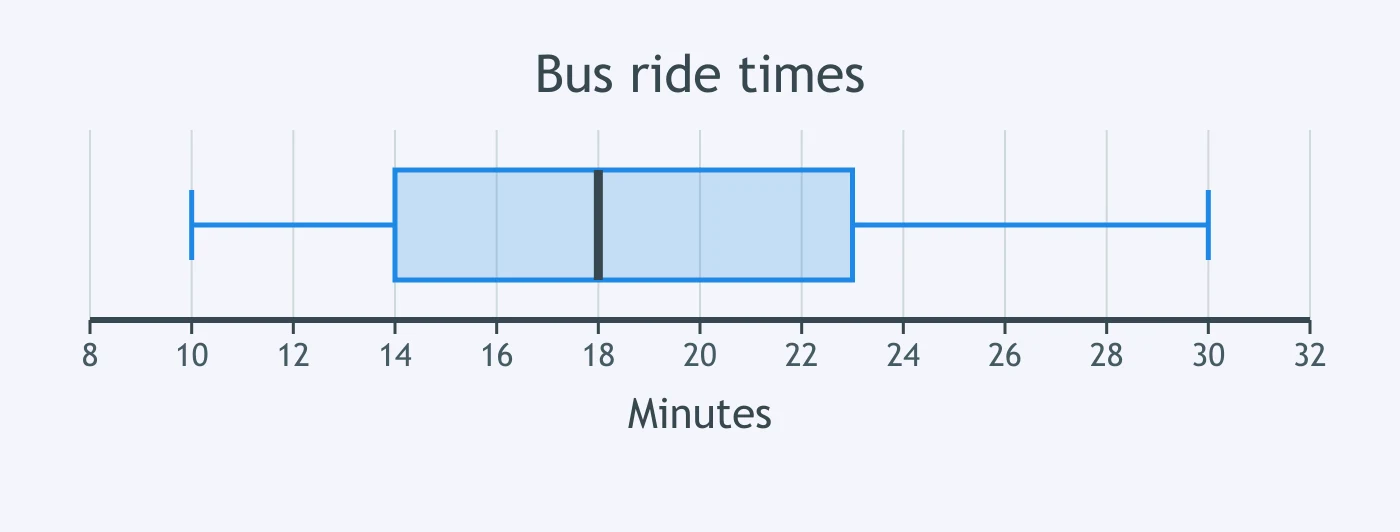
Use the box plot of bus ride times. What is the median ride time?
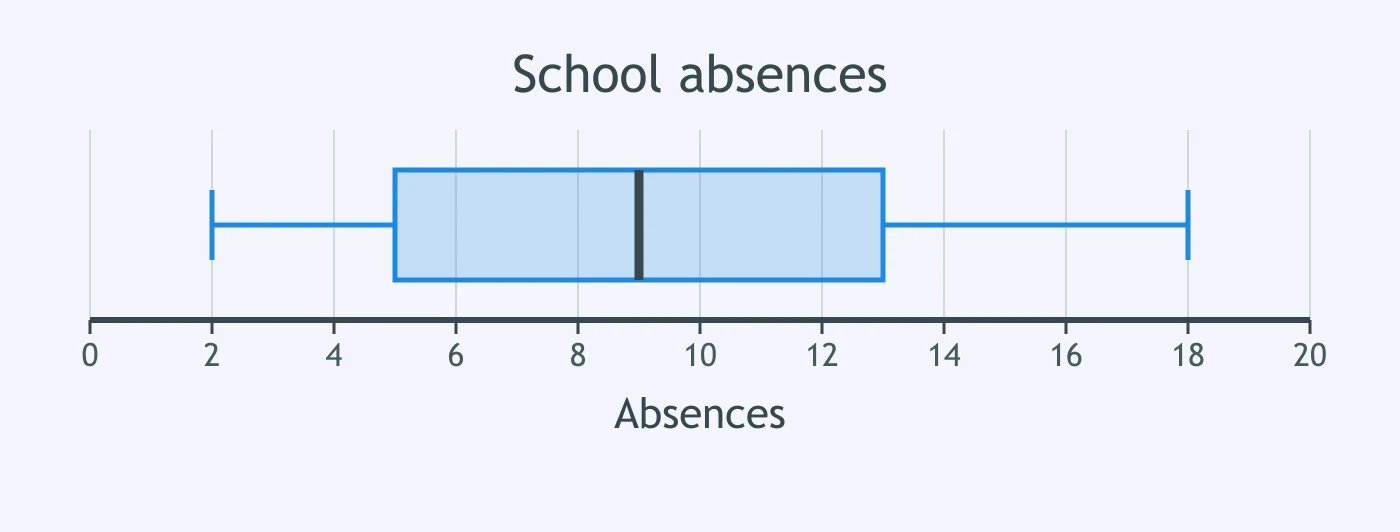
Use the box plot of school absences. What is the interquartile range?
For daily sales, Q1 = 40 and Q3 = 52. Using the 1.5 times IQR rule, which of 19, 68, and 74 are outliers?
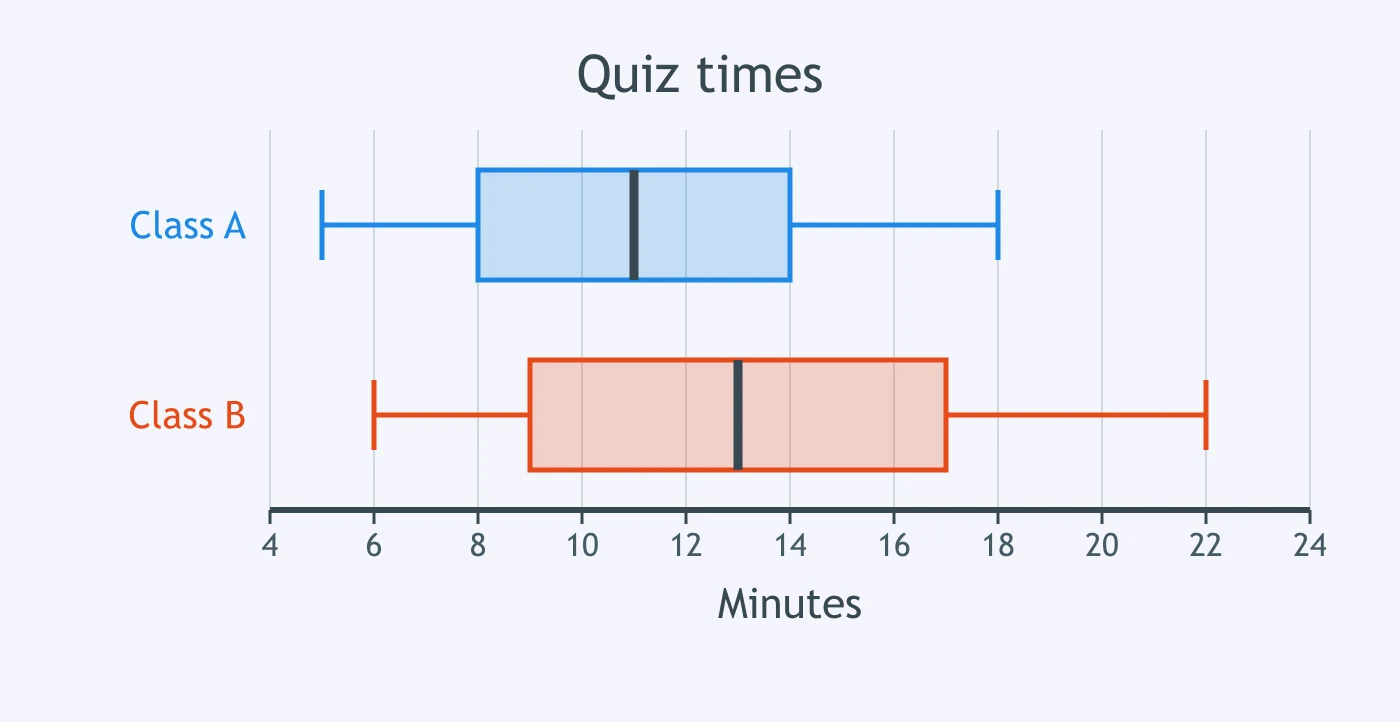
Use the two box plots of quiz times. Which class has the larger IQR, and by how much?
On a national math exam, Lia's score is at the 72nd percentile among test takers. What does that mean?
Battery lives in hours are 9, 10, 12, 14, 15, 16, 17, 18, 20, 22, 24, and 26. Using percent below, what percentile is 18 hours?
A course counts homework 20 percent, quizzes 30 percent, and the exam 50 percent. A student scores 85, 90, and 78 in those categories. What is the weighted mean?
Apple masses are roughly normal with mu = 135 grams and sigma = 10 grams. What is the z-score for an apple with mass 150 grams?
Scores are roughly normal with mu = 50 and sigma = 4. By the empirical rule, about what percent of scores are between 46 and 54?
Resting pulse rates are roughly normal with mu = 72 and sigma = 8 beats per minute. About what percent are between 64 and 88?
A test has scores with mu = 80 and sigma = 6. What is the z-score for a score of 72, rounded to the nearest hundredth?
Delivery times are roughly normal with mu = 30 minutes and sigma = 5 minutes. What delivery time has z-score 1.2?
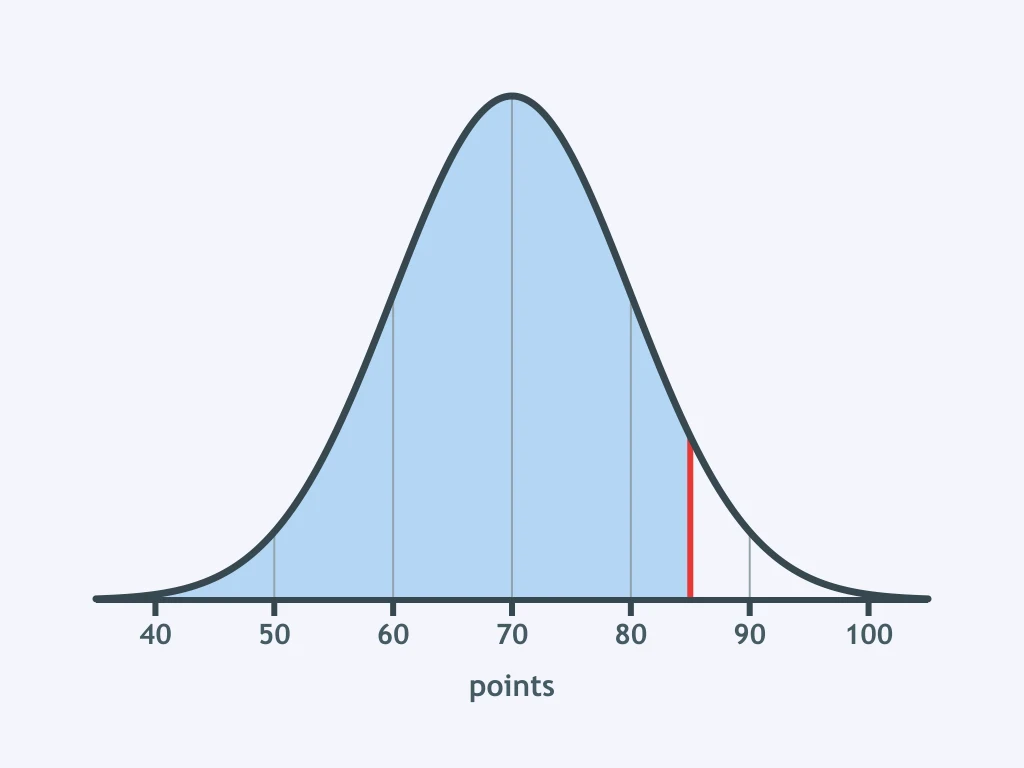
Test scores, measured in points, are modeled by the normal curve shown. A z-table gives area left of z = 1.50 as 0.933. What is P(score below the cutoff marked by the red line)?
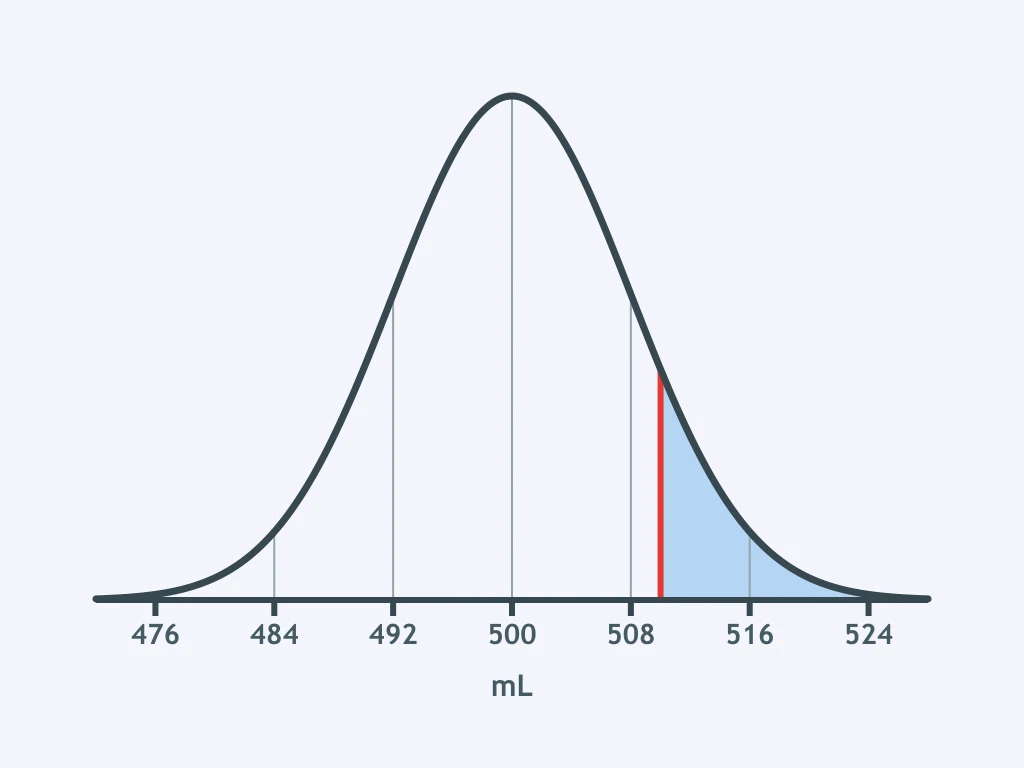
Bottle volumes, measured in mL, are modeled by the normal curve shown. A z-table gives area left of z = 1.25 as 0.894. What is P(volume above the cutoff marked by the red line)?
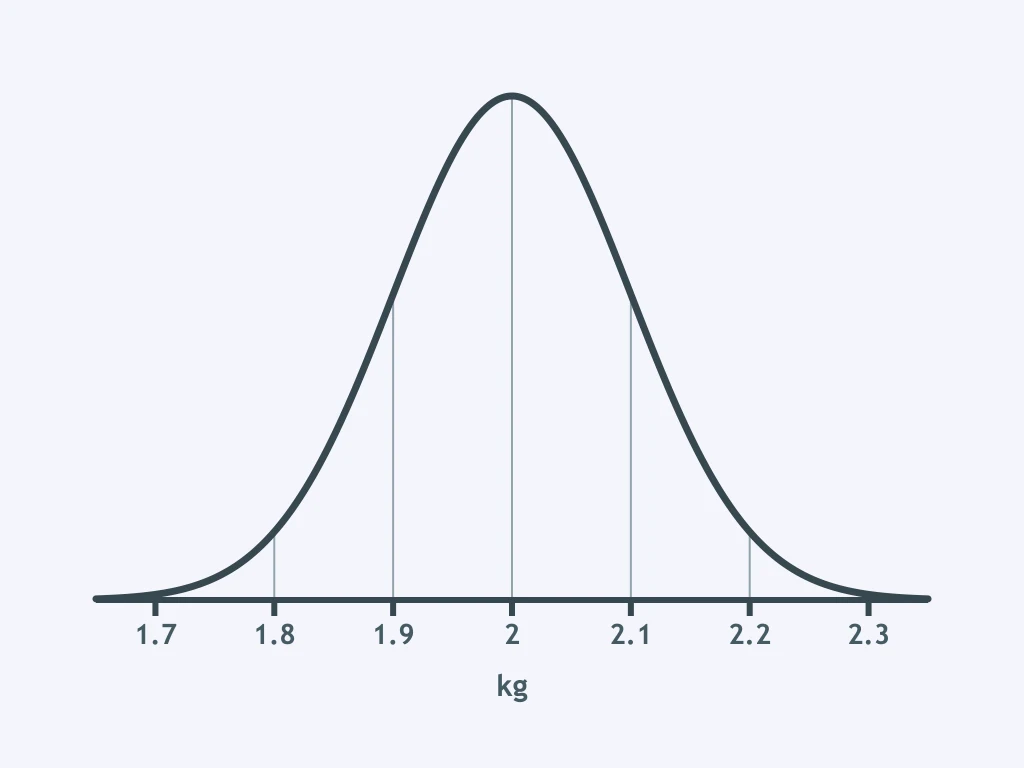
Bag masses are normal with mu = 2.0 kg and sigma = 0.1 kg. Use z = 1.28 for the 90th percentile. What mass marks the 90th percentile?
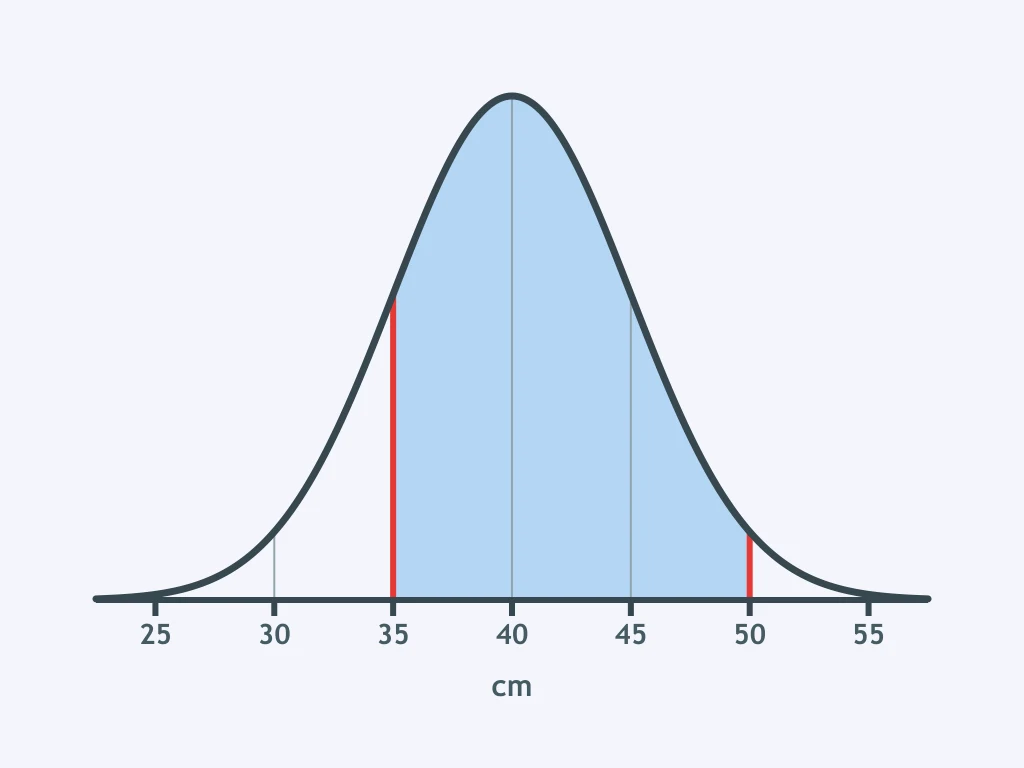
Plant heights, measured in cm, are shown on the labeled normal curve. The left areas for z = -1 and z = 2 are 0.159 and 0.977. What is P(height in the shaded interval)?
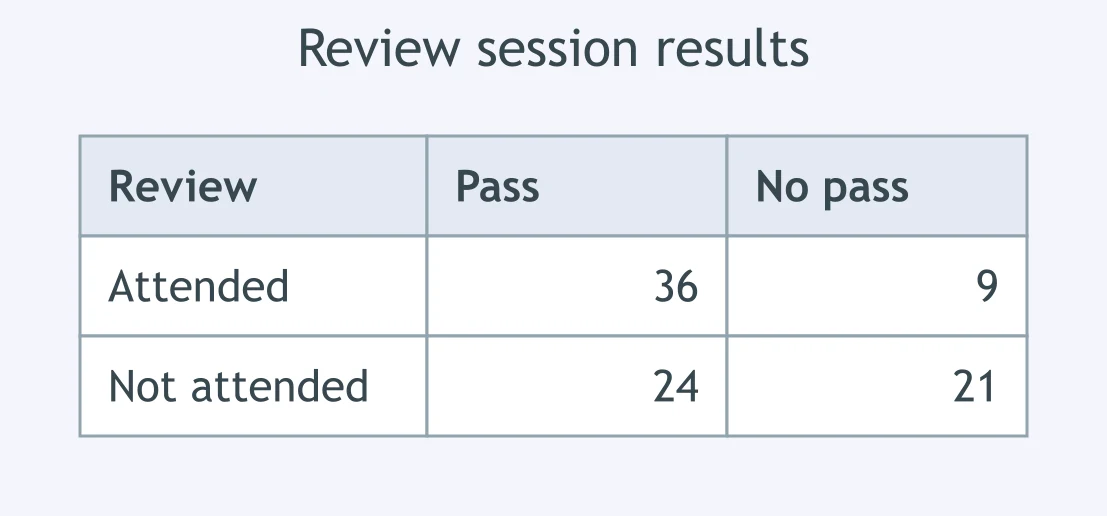
Use the two-way table of review attendance and exam result. Among students who attended review, what percent passed?
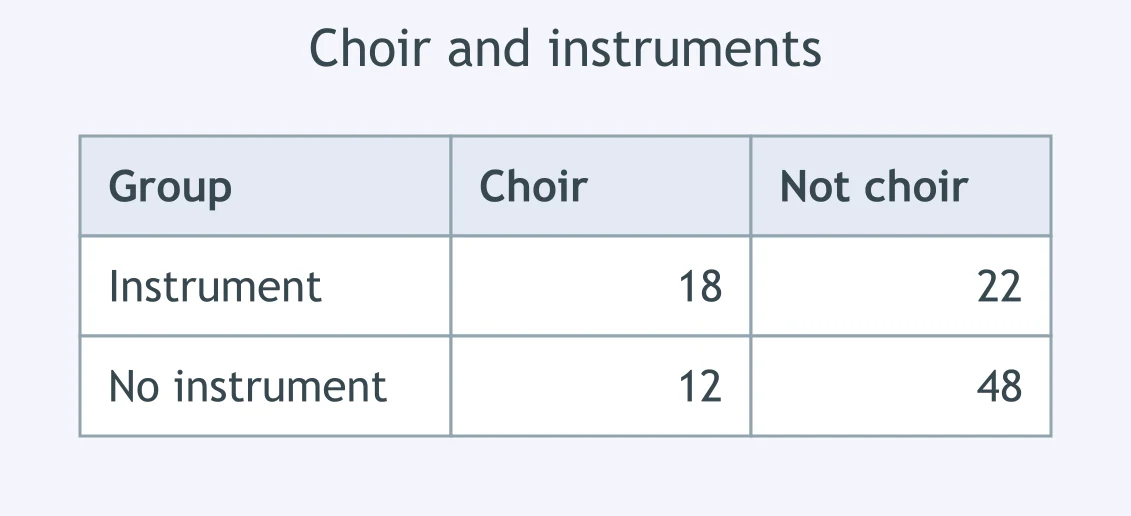
Use the two-way table about choir and instruments. Among choir members, what percent play an instrument?
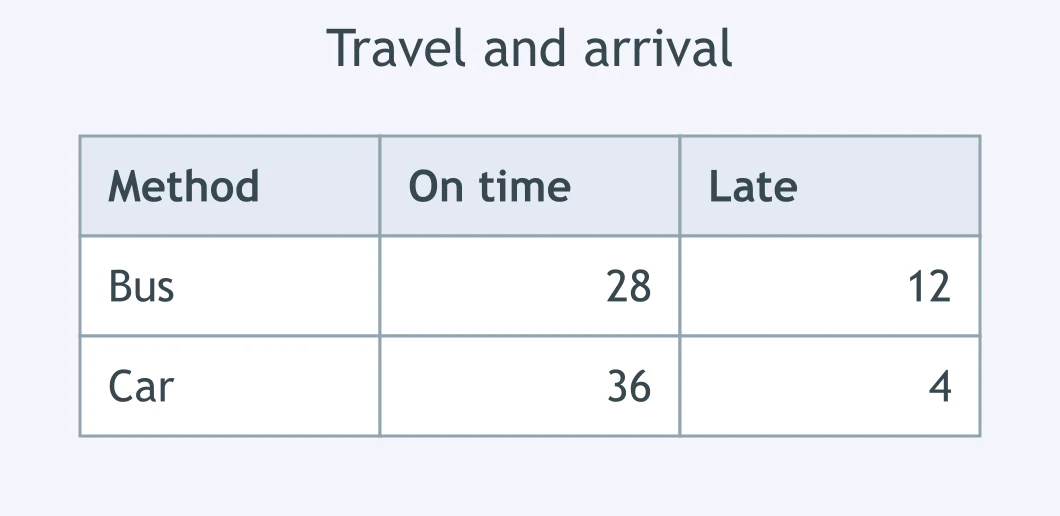
Use the two-way table of travel method and arrival. Which method had the higher late rate, and what was that rate?
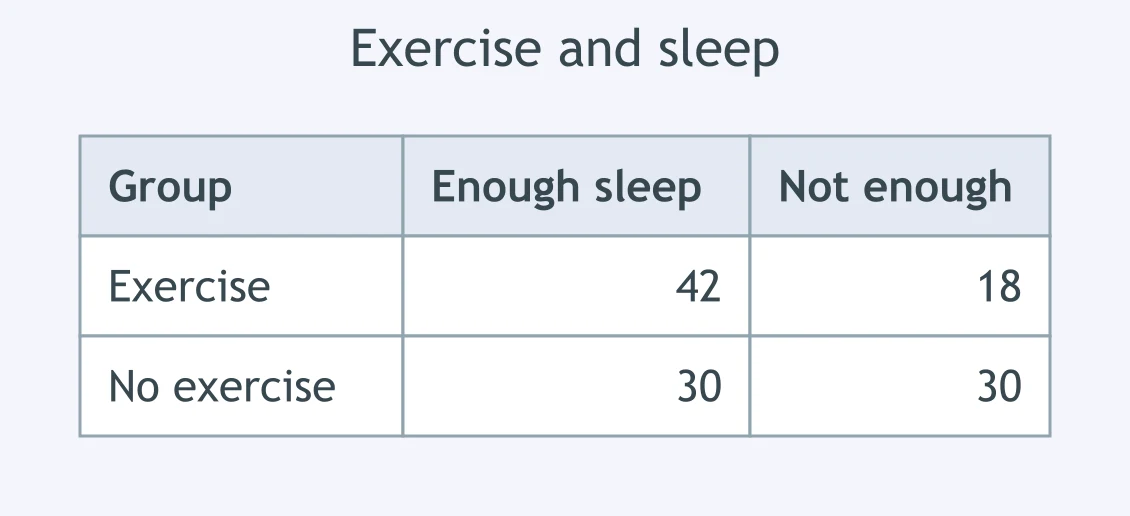
Use the two-way table about exercise and enough sleep. Does it show an association based on conditional percentages of enough sleep?
Use the scatterplot of hours studied and exam score. What sign should the correlation have?
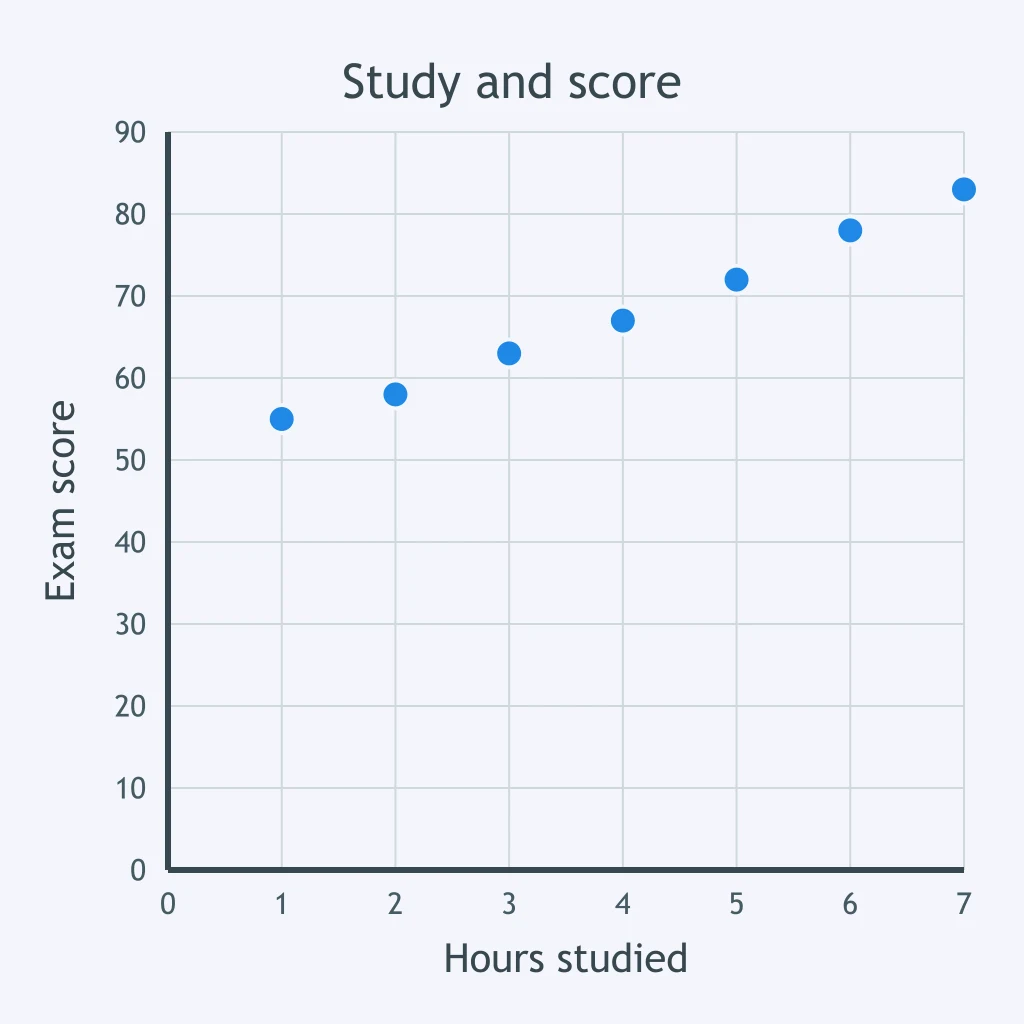
For 9 used cars, the correlation between age and resale price is r = -0.82. What description fits this relationship?
For 8 plants, the correlation between height in centimeters and mass in grams is r = 0.76. If height is converted to meters, what is the new r?
A scatterplot for 10 parks has r = 0.05 between number of benches and bird species. What does r show about the linear association?
A line predicts plant height y in centimeters from age x in weeks: . What height is predicted at 10 weeks?
For bikes, predicts maintenance cost y in dollars from age x in months. What does the slope 4.50 mean?
For seedlings, predicts height y in centimeters from age x in weeks. What does the intercept 6 mean?
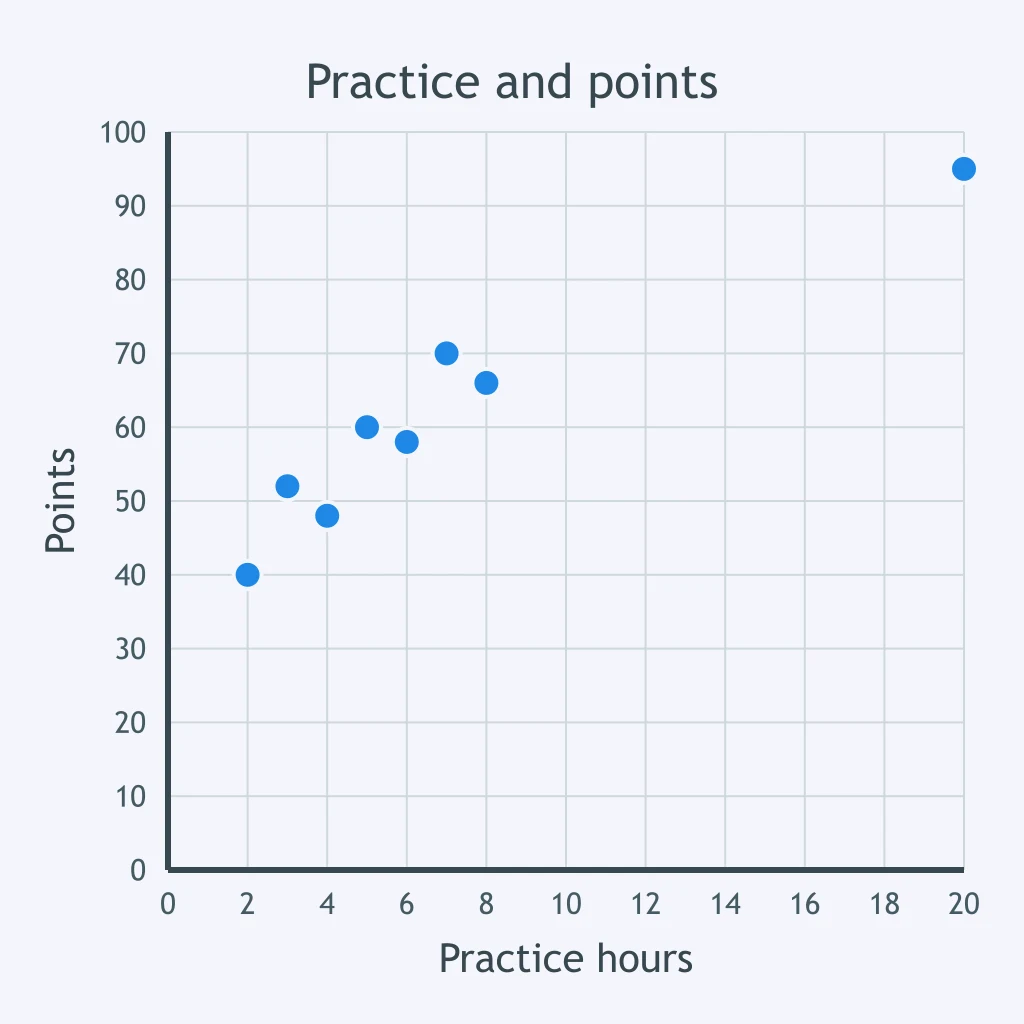
A regression model uses data from 1 to 8 hours of practice to predict score. Using it to predict for 20 hours of practice is what?
A model predicts 76 points for a student who actually scores 82 points. What is the residual, and what does it show?
For regression predicting plant mass from light hours, . What does this value mean?
An observational study of 80 students finds more screen time is associated with less sleep. What explanation is most defensible?
The scatterplot shows practice hours and points for 8 athletes. Removing the athlete at 20 hours greatly changes the slope of the regression line. What is that point called?
Crack the passcode before the zombies get in.
Answer, then swat bugs for bonus points.
Race through questions at your own speed.
Same question on every screen. Fastest wins.

Pick a tile, answer, hit bonuses and steals.
Inference Review: Sampling Distributions, Intervals and Tests
60 questions