Loading
by BlastRoom
Read demand schedules and downward-sloping demand curves to identify quantities and spending.
#us_hs_economics
20 questions
One question set, multiple game modes. Tap any game to see it in action. Not sure which to pick?
Answer to place stones and capture territory.
Outrun the snow together.
Earn blasts, then hunt the other team.
Answer to earn energy, then climb.

The class blasts through walls together.
Bid on mystery lots. Most money wins.
Sell tours. Nice, standard, or a total scam.

Answer, restock, and serve the rush.
More correct answers pulls the rope your way.
Answer, then shoot down the alien wave.
Answer, then tap to leap the frozen ridge.
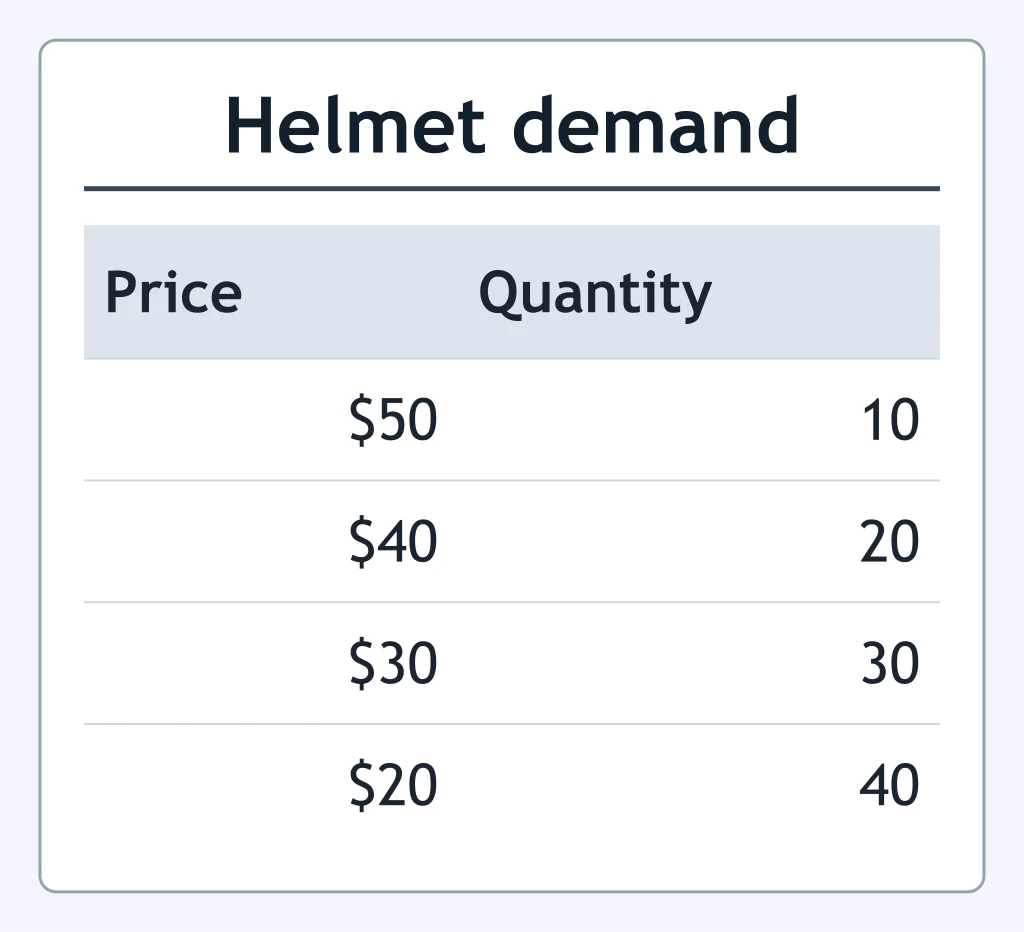
Use the demand schedule shown. At a price of $40 per helmet, how many helmets are demanded?
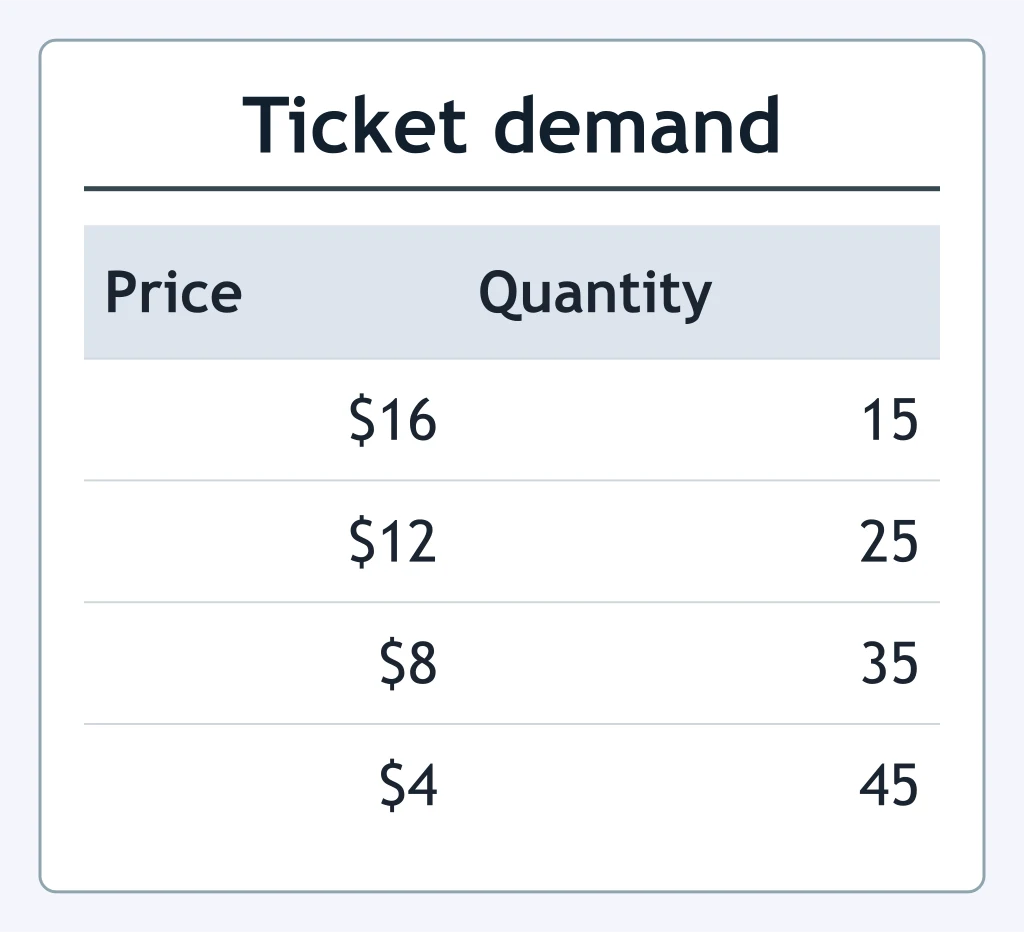
Refer to the demand schedule shown. If concert tickets cost $12, what quantity do buyers demand?
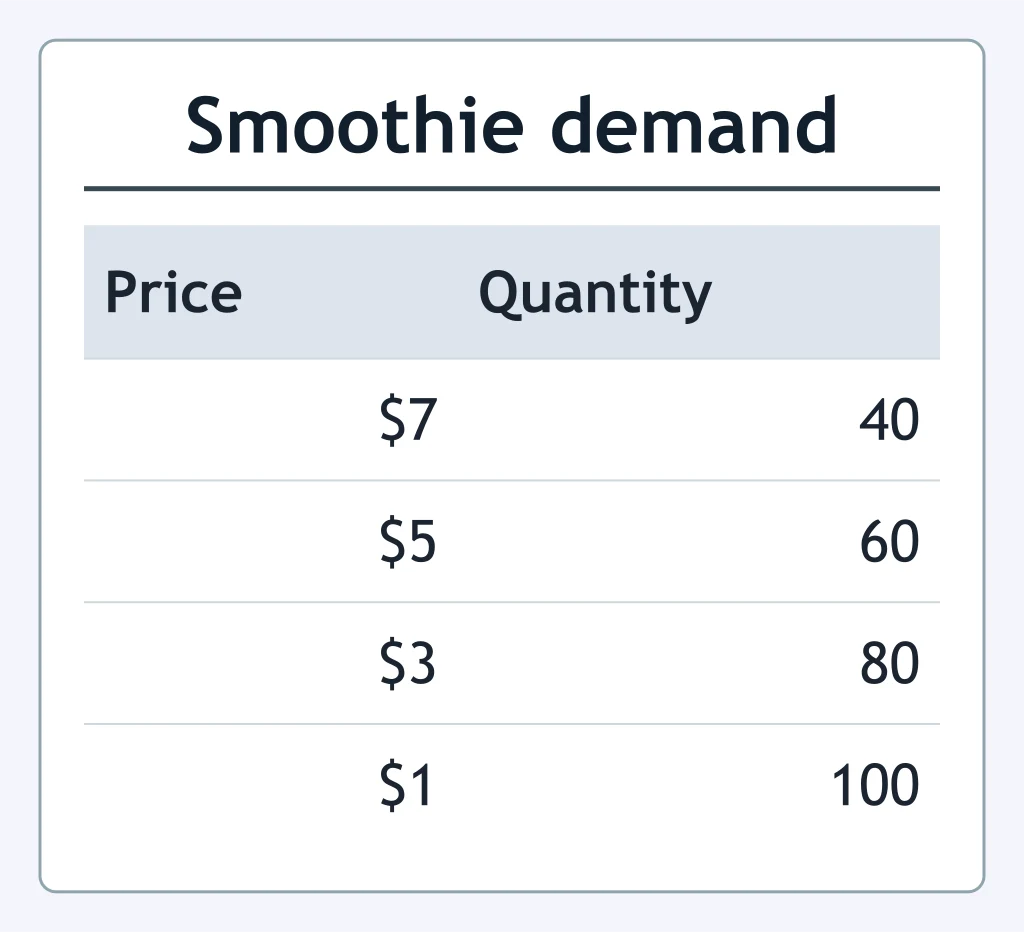
From the demand schedule shown, what quantity of smoothies is demanded at $5 each?
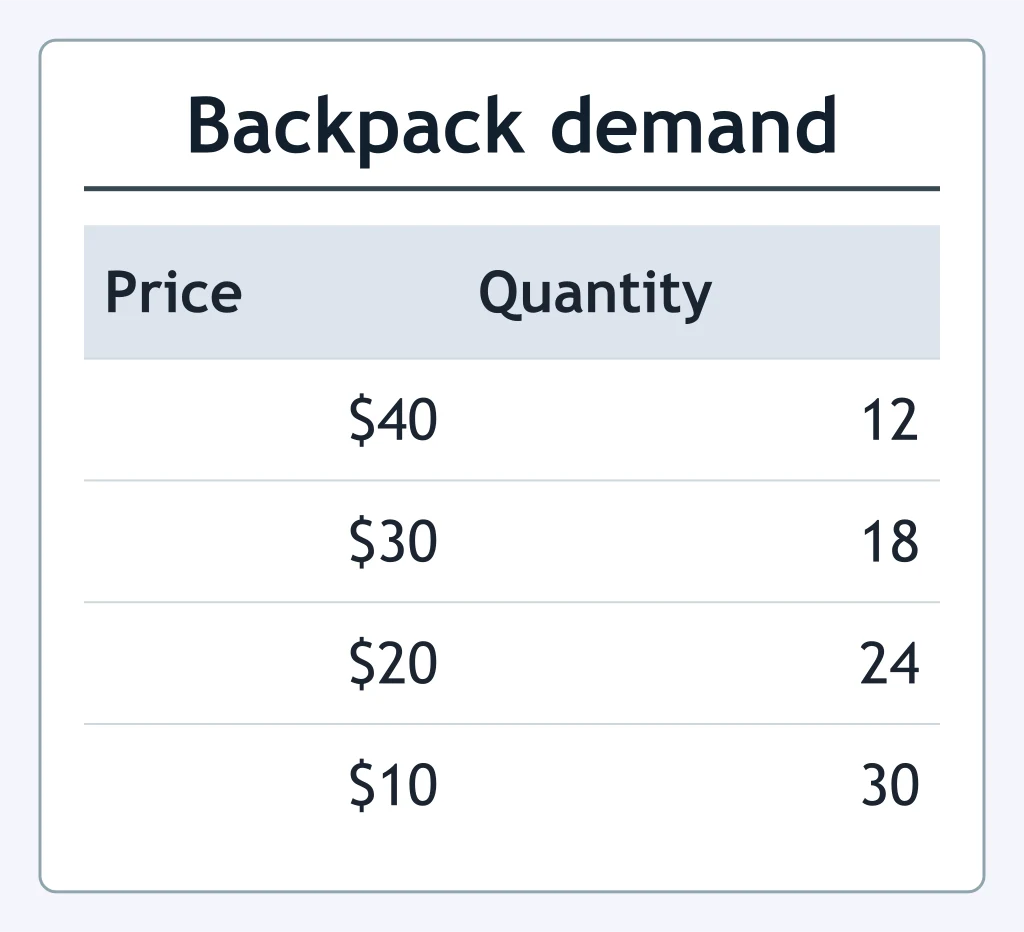
Use the demand schedule shown. When the price of a backpack is $30, what quantity is demanded?
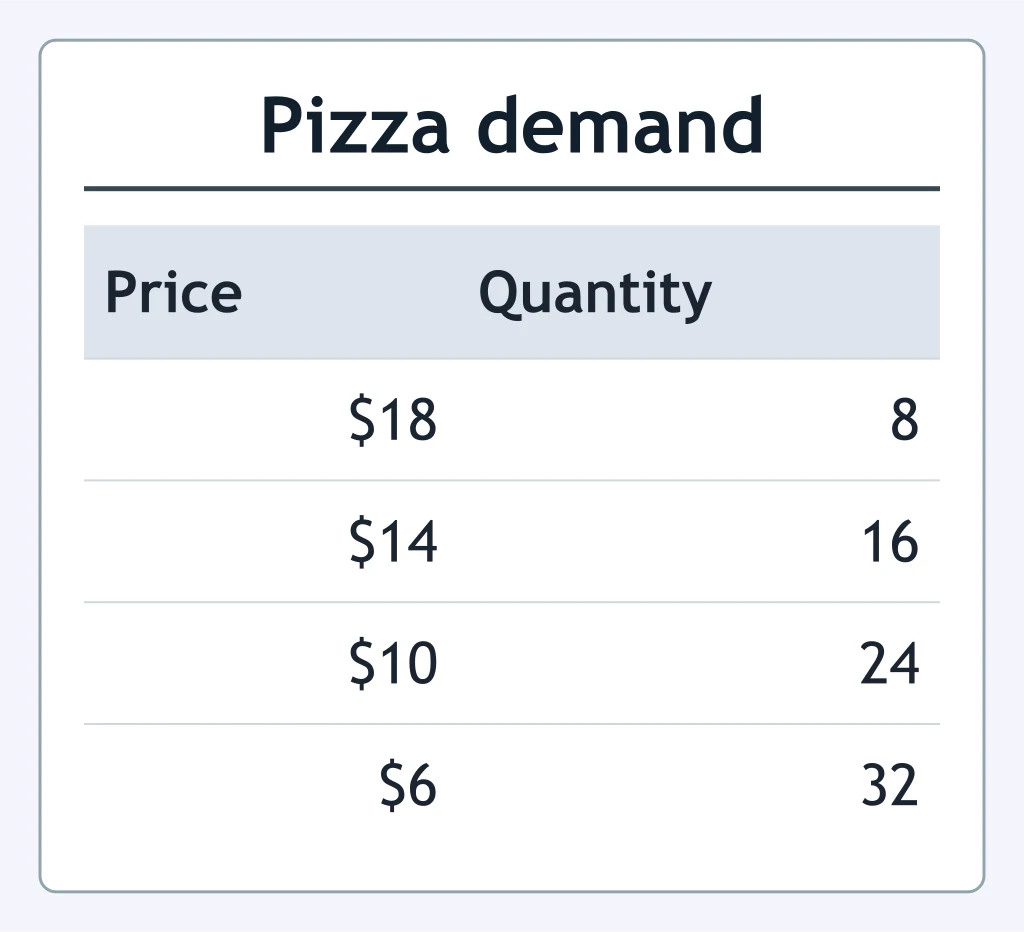
The table shows demand for pizzas. At a price of $14 per pizza, buyers want how many pizzas?
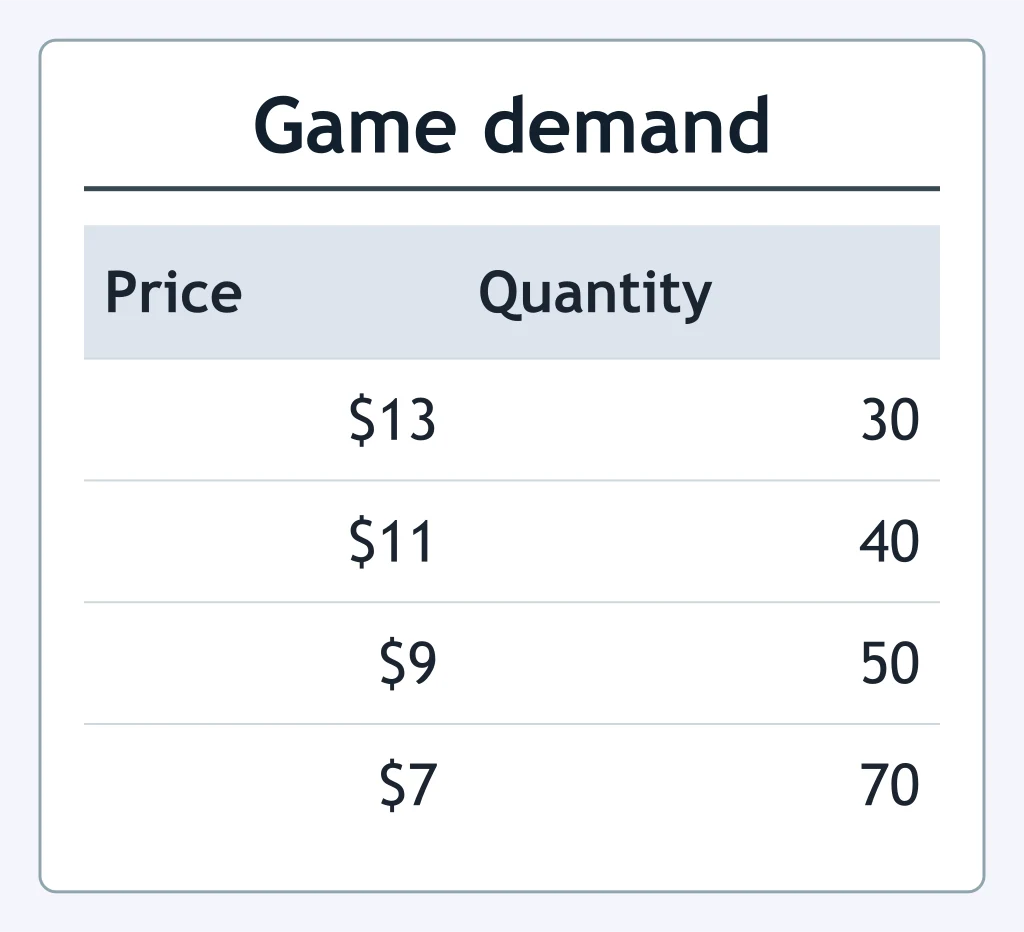
Look at the demand schedule shown. At $9 per game, what quantity of games is demanded?
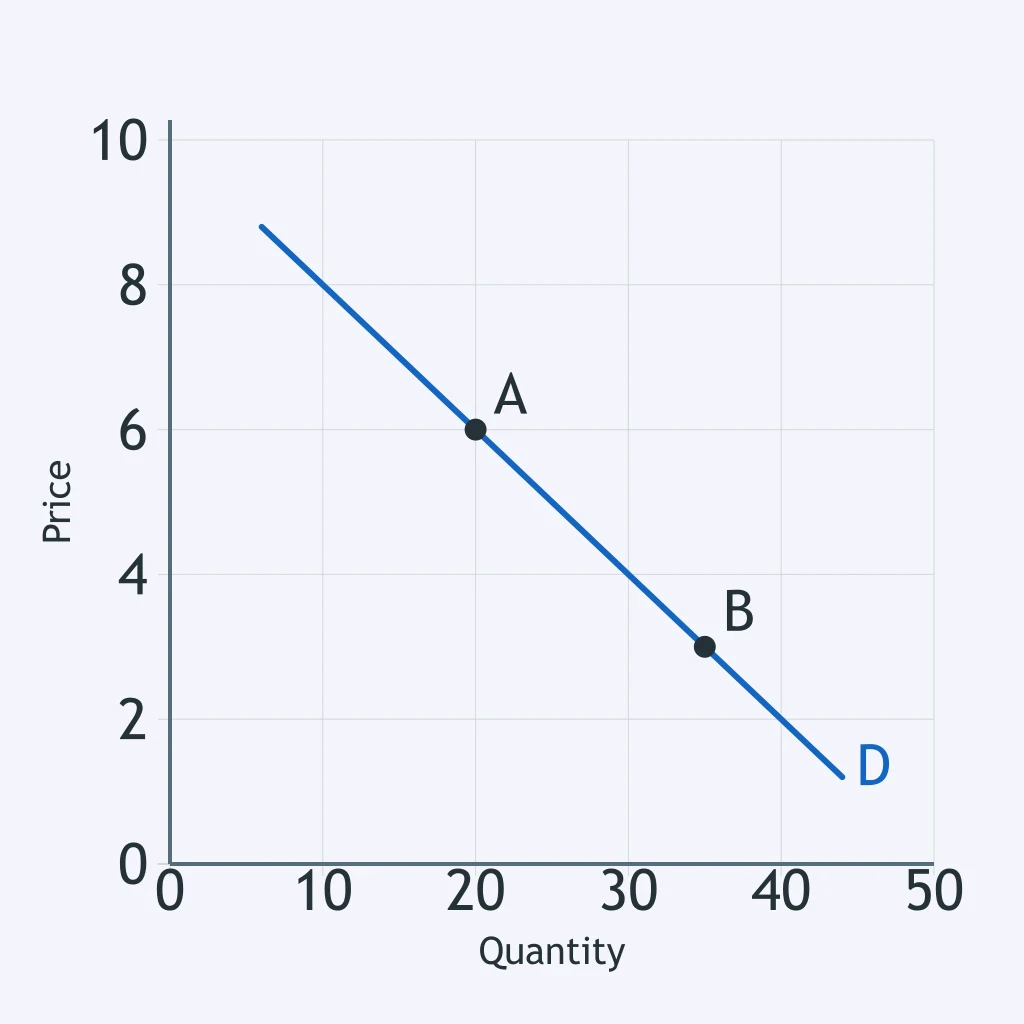
The graph shows a demand curve for crates with two labeled points, A and B. What quantity is demanded at point B?
The graph gives a demand curve for bicycles and labels points A and B. What quantity is demanded at point A?
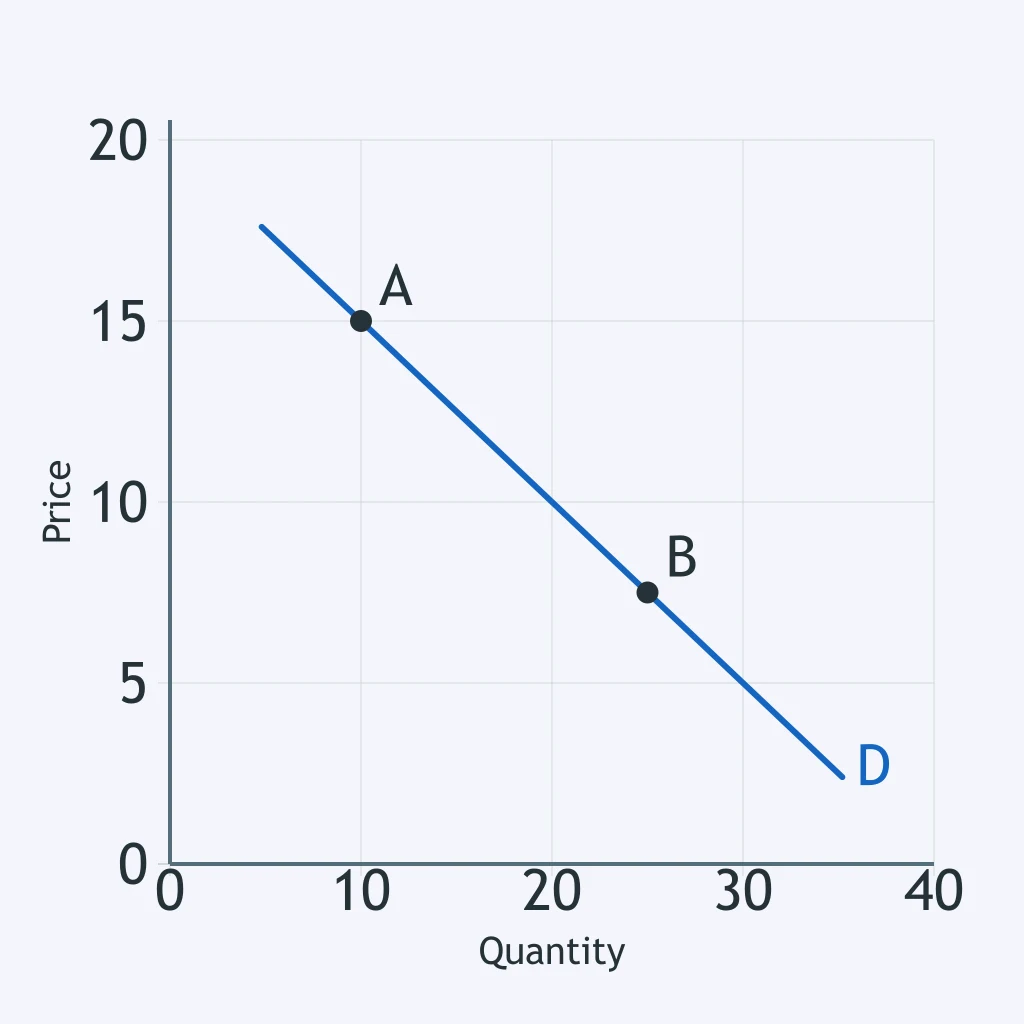
A demand curve for notebooks is shown with points A and B labeled. What quantity is demanded at point B?
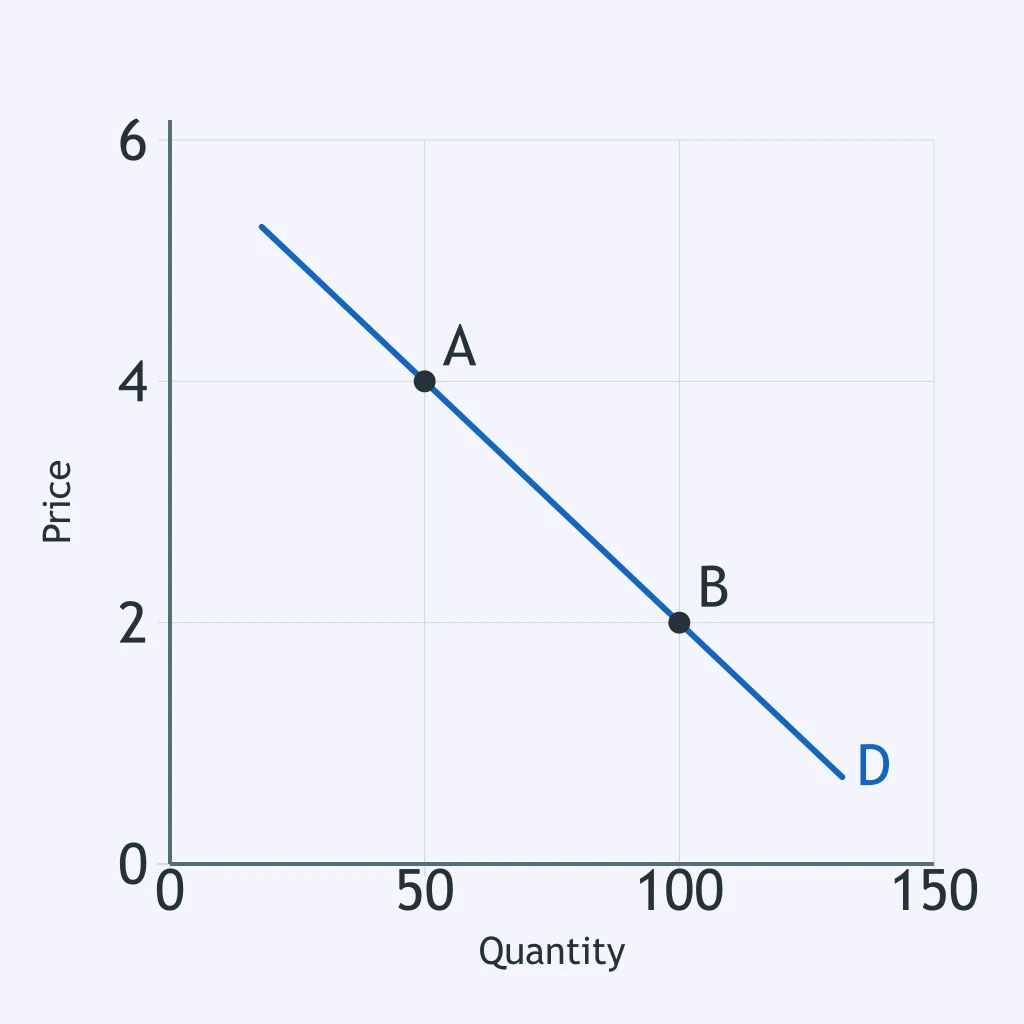
Use the demand curve for lamps, which shows labeled points A and B. What quantity is demanded at point A?
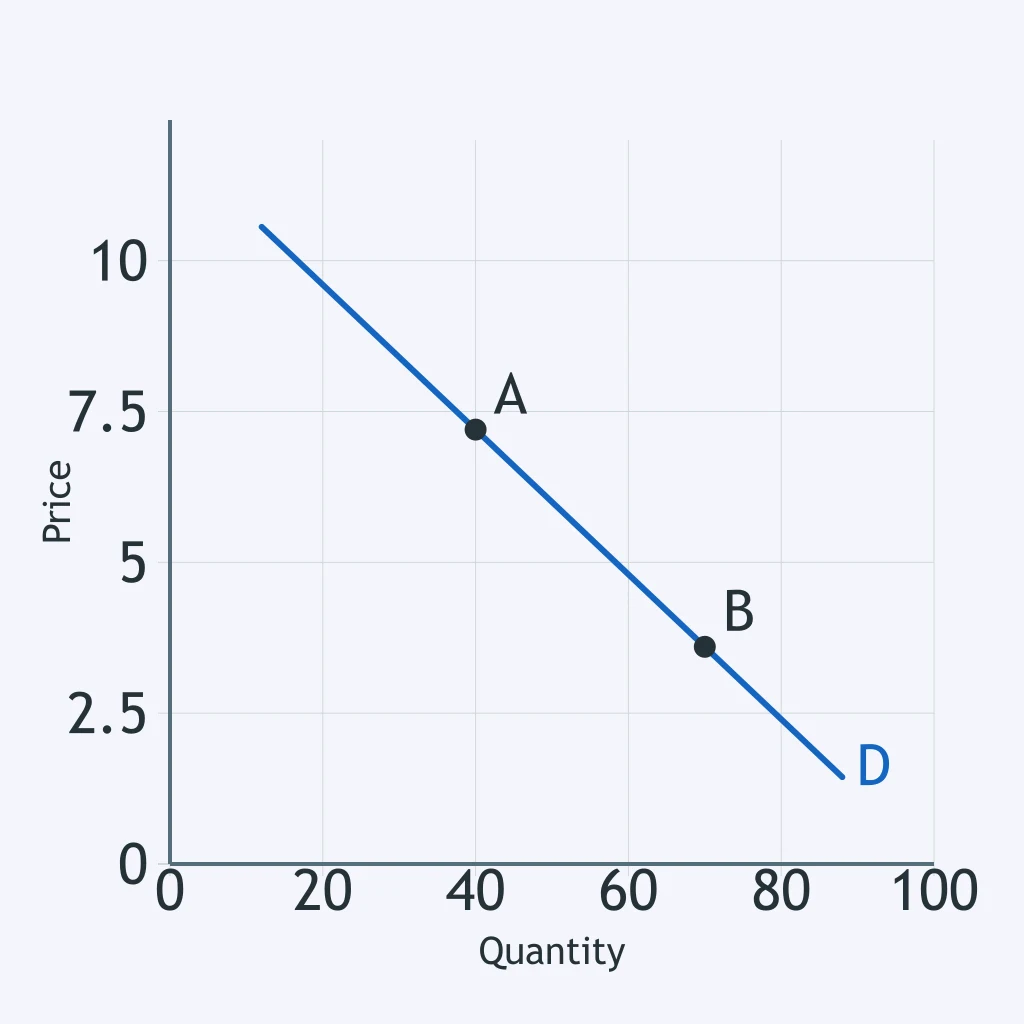
The figure shows a demand curve for jackets with points A and B marked. What quantity is demanded at point B?
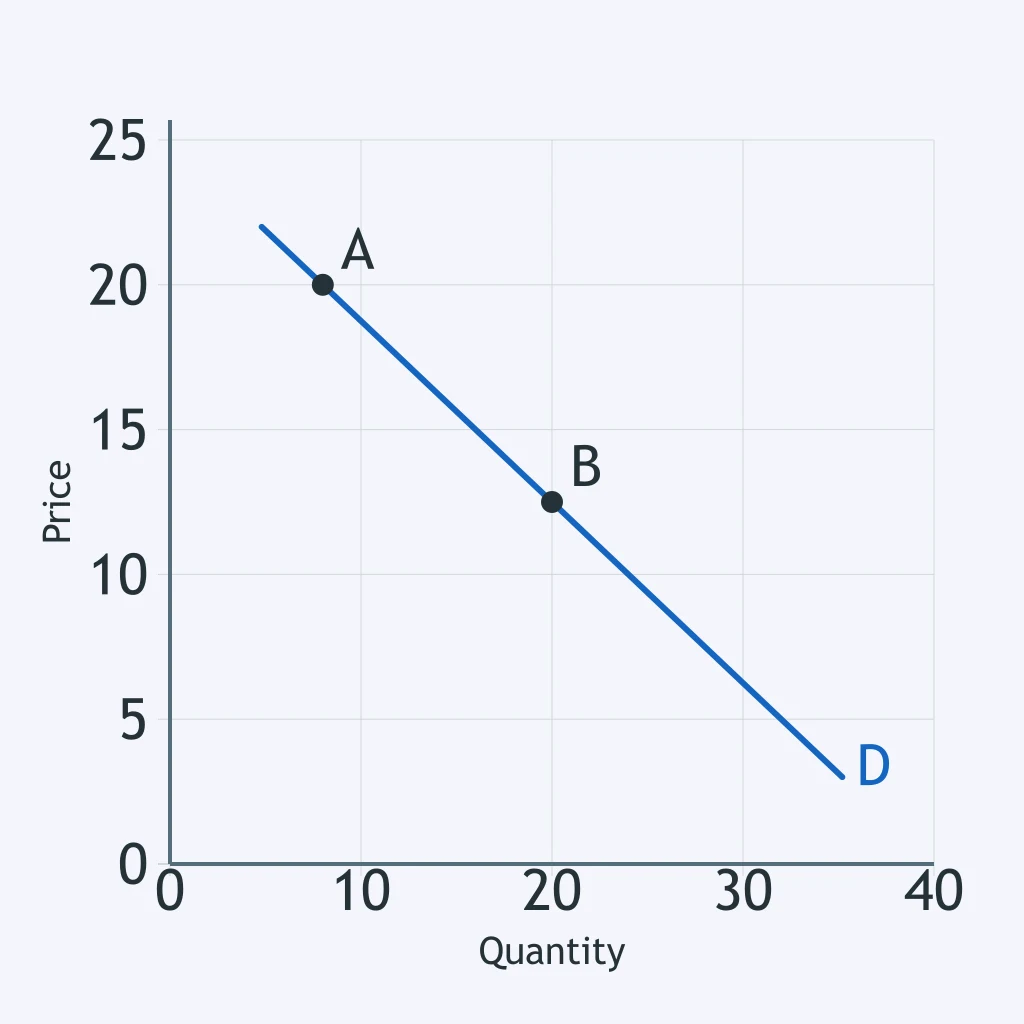
Use the schedule shown. Which curve on price-quantity axes matches the listed price and quantity pairs?
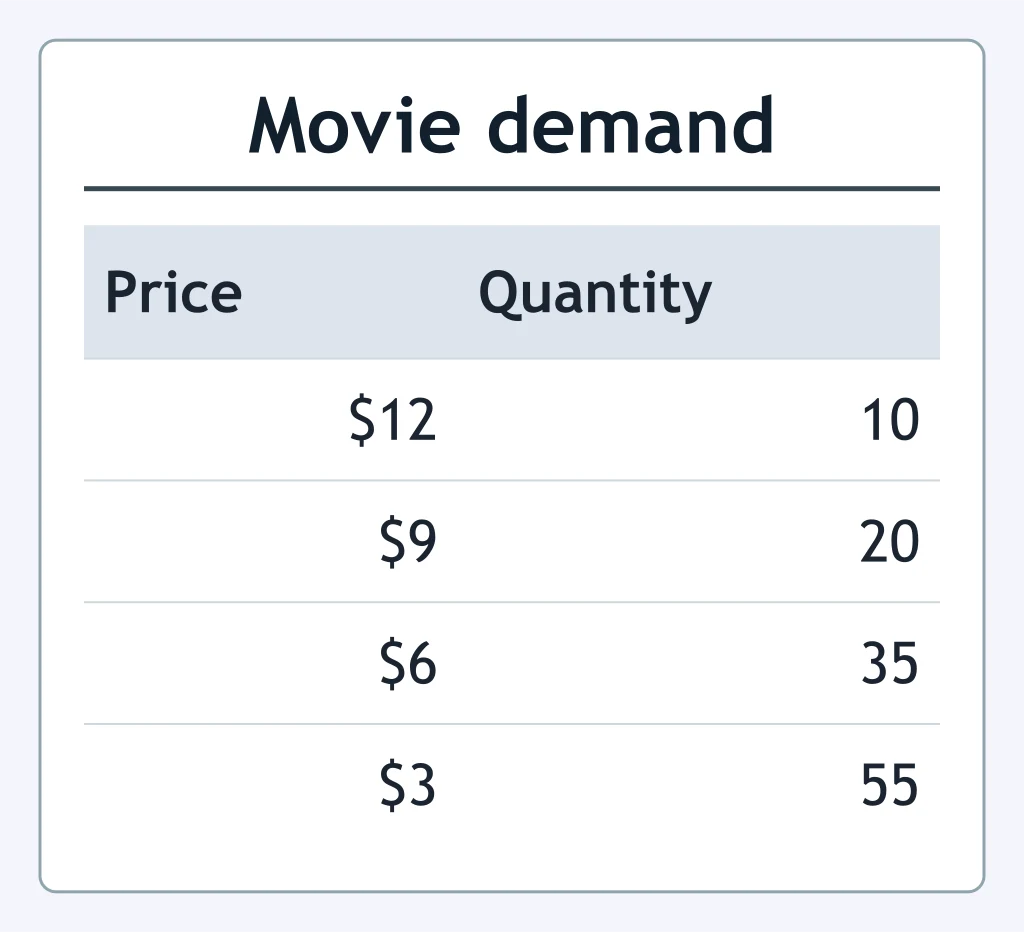
The demand schedule shown is plotted with price vertically and quantity horizontally. What curve should result?
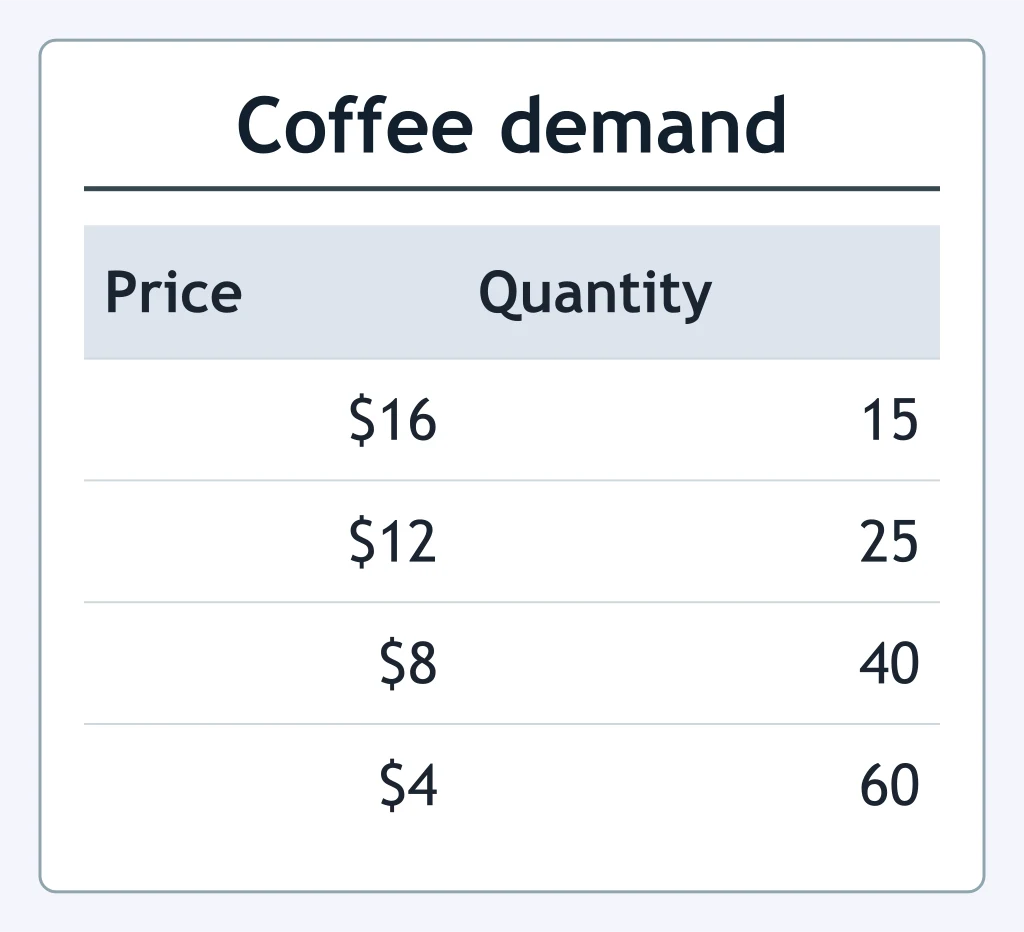
Which graph matches the demand schedule shown for soccer balls?
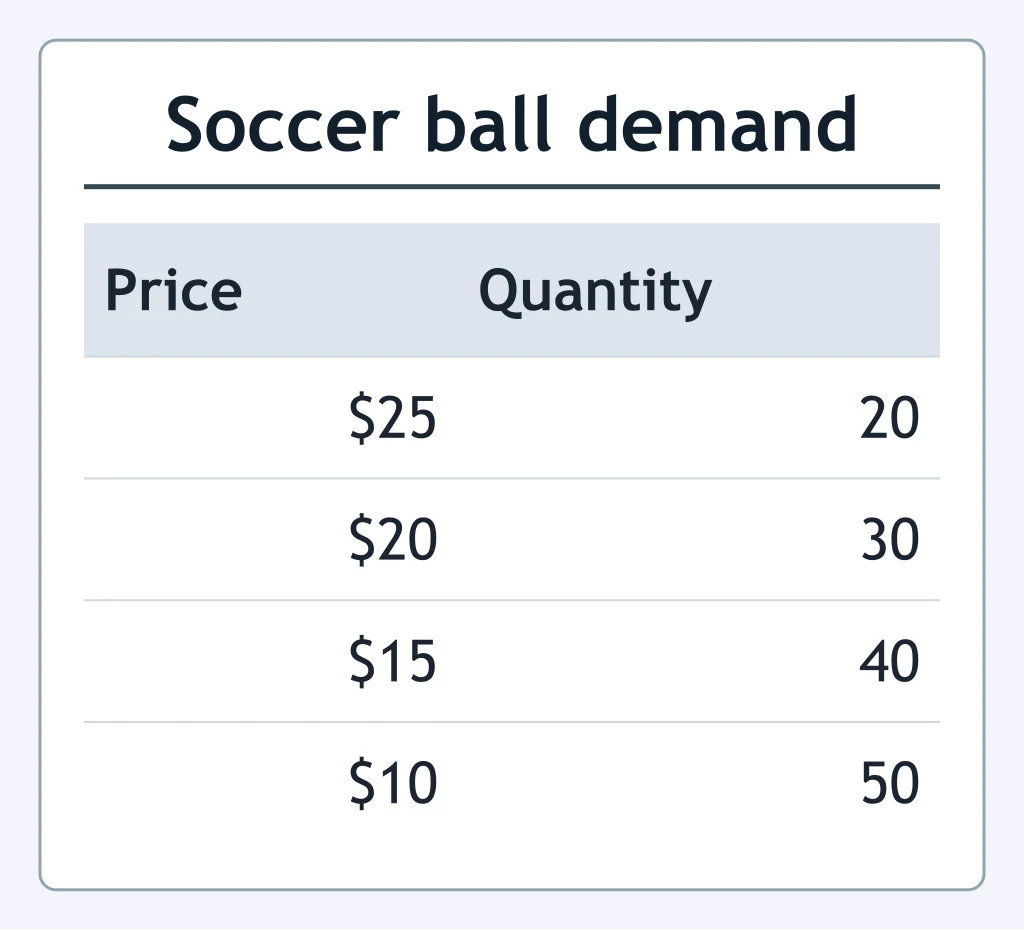
A student graphs the schedule shown with quantity on the horizontal axis. Which description identifies the correct demand curve?
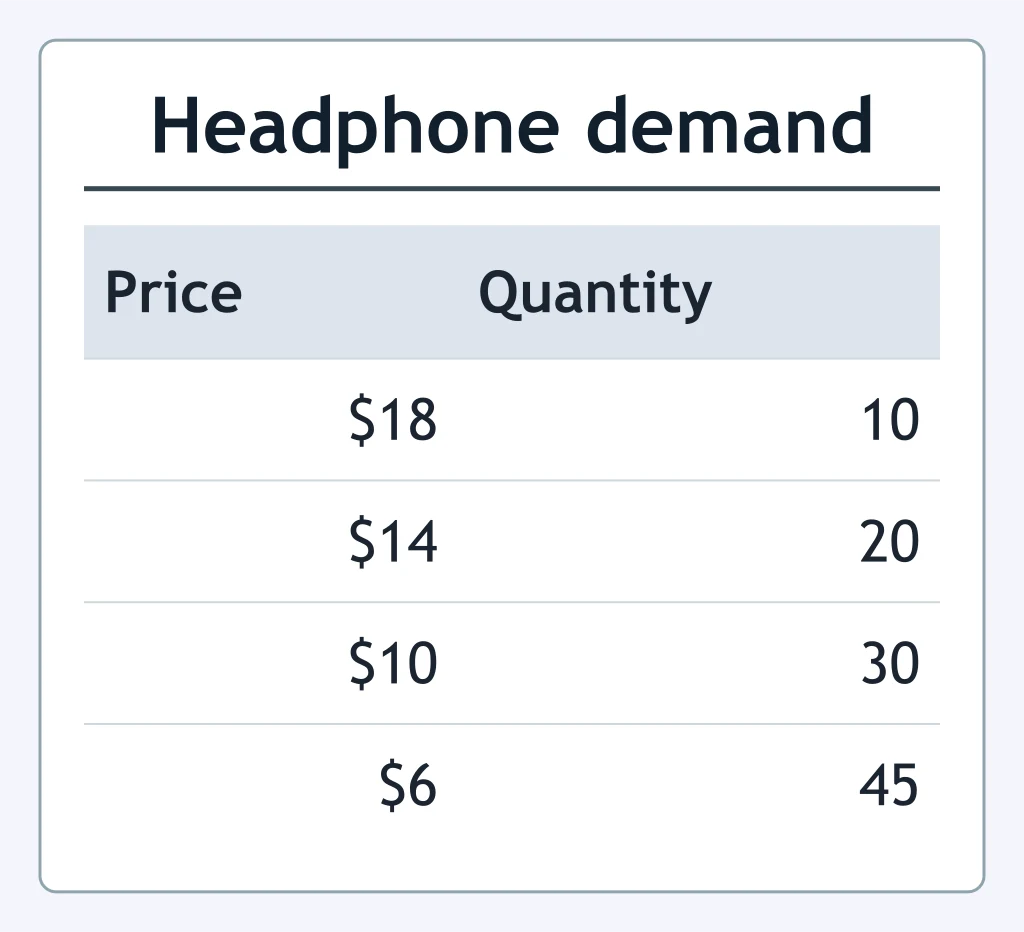
Use the demand schedule shown. How much more do buyers spend in total at $9 than at $12?
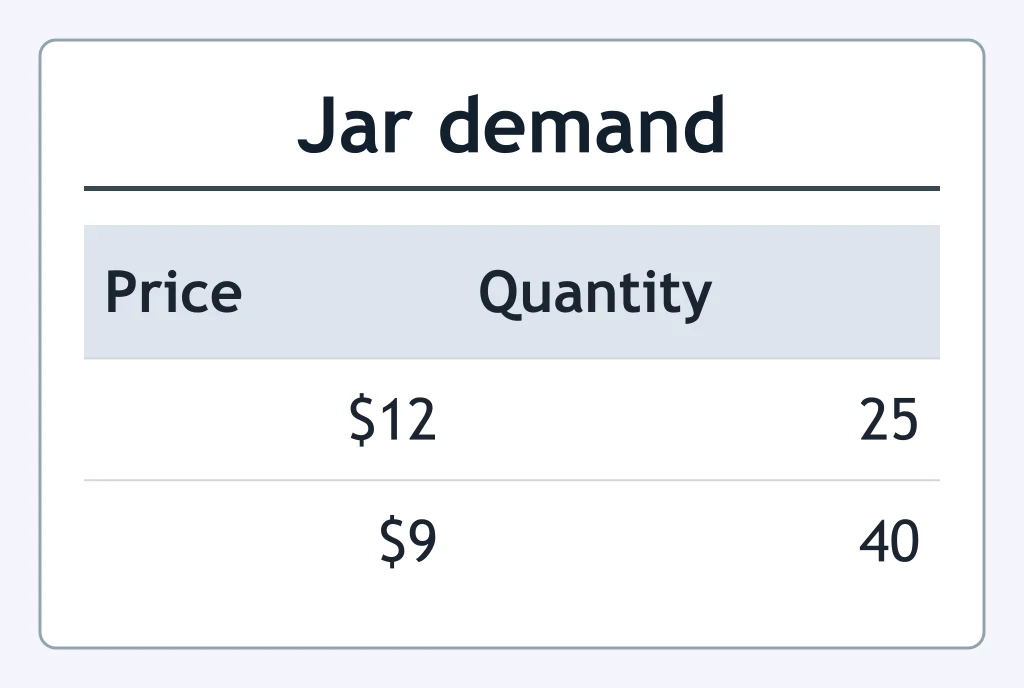
At $8, buyers demand 30 mugs; at $6, they demand 45 mugs. How much more do buyers spend in total at $6 than at $8?
A demand schedule shows 20 chargers demanded at $10 and 50 demanded at $5. How much more do buyers spend in total at $5?
At $4, consumers demand 60 sandwiches; at $3, they demand 75 sandwiches. How does total spending change when price falls to $3?
When a book costs $7, quantity demanded is 35; when it costs $5, quantity demanded is 45. What is the change in total spending?
Crack the passcode before the zombies get in.
Answer, then swat bugs for bonus points.
Race through questions at your own speed.
Same question on every screen. Fastest wins.

Pick a tile, answer, hit bonuses and steals.
Substitutes, Complements, Normal and Inferior Goods
25 questions