Loading
by BlastRoom
Finding the mean and standard error of a statistic, and predicting what a larger sample does to each.
#probability_and_statistics

40 questions
One question set, multiple game modes. Tap any game to see it in action. Not sure which to pick?
Answer to place stones and capture territory.

Pick a tile, answer, hit bonuses and steals.

Battleship. Sink every enemy ship to win.
Pass the potato before the fuse runs out.
Buy low, sell high, before the news breaks.
Take the wages, or take the whole vault.
Answer, then shoot for the top corner
In a large school district, the population proportion of students who ride a bus is 0.38. Random samples of 250 students are drawn, and p-hat is recorded. What is the mean of the sampling distribution of p-hat?
A farm packs apples with population mean mass 180 grams and population standard deviation 24 grams. For random samples of 36 apples, x-bar is recorded. What is the mean of the sampling distribution of x-bar?
At a city recycling center, the population proportion of plastic bottles that are clear is 0.72. Samples of 400 bottles are taken, and p-hat is recorded. What is the mean of the sampling distribution of p-hat?
Clinic waiting times have population mean 18 minutes and population standard deviation 6 minutes. Random samples of 49 visits are drawn, and x-bar is recorded. What is the mean of the sampling distribution of x-bar?
A factory knows the population proportion of scratched tablet screens is 0.15. Random samples of 100 tablets are inspected, and p-hat is recorded. What is the mean of the sampling distribution of p-hat?
Seedling heights in a greenhouse have population mean 42 centimeters and population standard deviation 10 centimeters. Samples of 25 seedlings are drawn, and x-bar is recorded. What is the mean of the sampling distribution of x-bar?
In a school survey population, the proportion who support uniforms is 0.60. Random samples of 64 students are drawn, and p-hat is recorded. What is the mean of the sampling distribution of p-hat?
Phone battery life has population mean 9.5 hours and population standard deviation 1.2 hours. Random samples of 16 phones are tested, and x-bar is recorded. What is the mean of the sampling distribution of x-bar?
Adult resting heart rates have population standard deviation 12 beats per minute. Random samples of 36 adults are drawn, and x-bar is recorded. What is the standard deviation of the sampling distribution of x-bar?
A bottling line has population standard deviation 30 milliliters for fill volume. Random samples of 25 bottles are drawn, and x-bar is recorded. What is the standard deviation of the sampling distribution of x-bar?
Commute times for hospital workers have population standard deviation 18 minutes. Random samples of 81 workers are drawn, and x-bar is recorded. What is the standard deviation of the sampling distribution of x-bar?
Textbook masses have population standard deviation 120 grams. Random samples of 16 textbooks are drawn, and x-bar is recorded. What is the standard deviation of the sampling distribution of x-bar?
Trout lengths in a lake have population standard deviation 8 centimeters. Random samples of 64 trout are measured, and x-bar is recorded. What is the standard deviation of the sampling distribution of x-bar?
Daily cafeteria purchases have population standard deviation $3.60. Random samples of 36 purchases are drawn, and x-bar is recorded. What is the standard deviation of the sampling distribution of x-bar?
Soil nitrogen readings have population standard deviation 0.45 grams per kilogram. Random samples of 9 fields are tested, and x-bar is recorded. What is the standard deviation of the sampling distribution of x-bar?
A statewide exam score has population standard deviation 14 points. Random samples of 49 students are drawn, and x-bar is recorded. What is the standard deviation of the sampling distribution of x-bar?
A manufacturer knows the population proportion of switches rated for outdoor use is 0.40. Random samples of 100 switches are drawn, and p-hat is recorded. To three decimals, what is the standard deviation of p-hat?
At a clinic, the population proportion of appointments that start late is 0.25. Random samples of 400 appointments are drawn, and p-hat is recorded. To three decimals, what is the standard deviation of p-hat?
In a warehouse, the population proportion of orders shipped the same day is 0.64. Random samples of 225 orders are drawn, and p-hat is recorded. To three decimals, what is the standard deviation of p-hat?
A seed company finds the population proportion of packets that fail inspection is 0.10. Random samples of 100 packets are drawn, and p-hat is recorded. To three decimals, what is the standard deviation of p-hat?
In a town, the population proportion of households with a garden is 0.55. Random samples of 121 households are drawn, and p-hat is recorded. To three decimals, what is the standard deviation of p-hat?
A library knows the population proportion of checked-out books that are fiction is 0.80. Random samples of 256 checked-out books are drawn, and p-hat is recorded. To three decimals, what is the standard deviation of p-hat?
A transit agency reports the population proportion of buses arriving early is 0.18. Random samples of 900 buses are drawn, and p-hat is recorded. To three decimals, what is the standard deviation of p-hat?
For random samples of 25 cereal boxes from a population with standard deviation 40 grams, the sampling distribution of x-bar has standard deviation 8 grams. The sample size increases to 100. What is the new standard deviation?
For a population proportion 0.30, p-hat from samples of 100 has standard deviation about 0.046. If samples of 400 are used instead, what is the new standard deviation of p-hat, to three decimals?
Luggage masses have population standard deviation 15 kilograms. For samples of 9 bags, the standard error of x-bar is 5.00 kilograms. If the sample size increases to 81, what is the new standard error?
A plant study uses sample mean leaf length. When the sample size is 50, the standard error is 3.2 centimeters. If the sample size increases to 200, what is the new standard error?
For machine run times, samples of 64 parts give a standard error of 0.750 minute for x-bar. Samples of 256 parts are used instead. What is the new standard error?
In a survey, p-hat has standard error 0.060 when the sample size is 100. The researcher wants the standard error to be 0.030 with the same population proportion. How must the sample size change?
For a population proportion 0.20, samples of 100 voters are replaced by samples of 900 voters. What happens to the standard error of p-hat?
Bottle fill amounts have population standard deviation 24 milliliters. Samples of 36 bottles give a standard error of 4 milliliters for x-bar. If the sample size increases to 144, what is the new standard error?
The figure shows the sampling distribution of x-bar for tomato masses when the population mean is 150 grams, population standard deviation is 16 grams, and sample size is 64. What are the center and standard deviation?
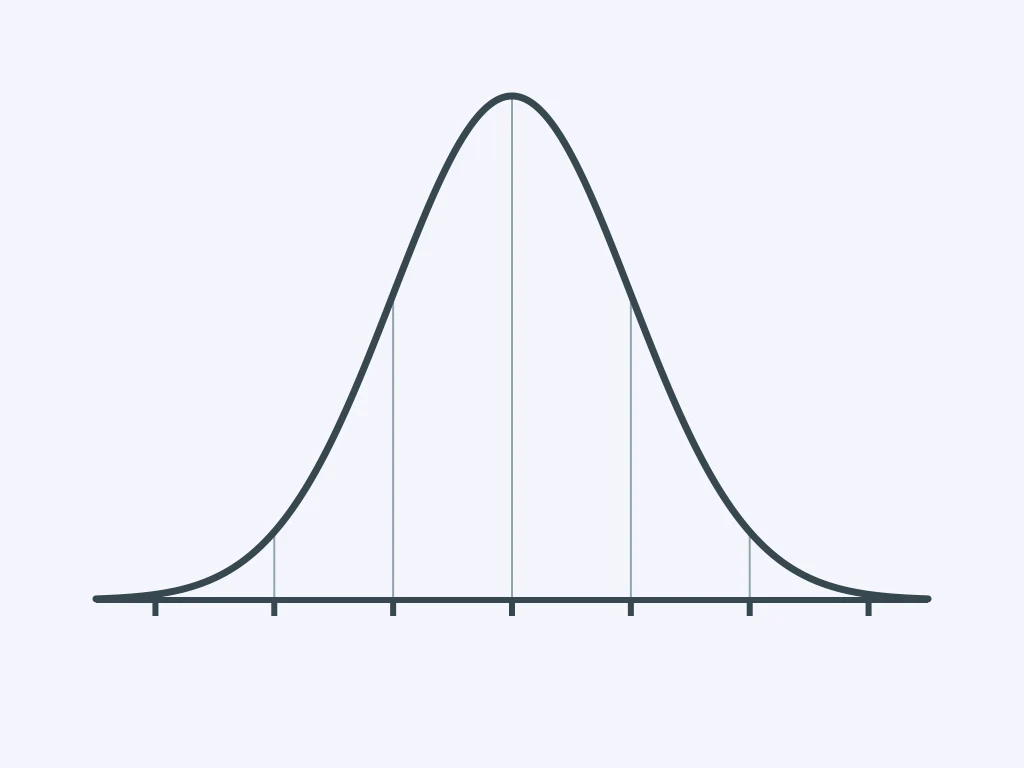
The figure shows the sampling distribution of x-bar for water bottle volumes when the population mean is 500 milliliters, population standard deviation is 20 milliliters, and sample size is 25. What are the center and standard deviation?
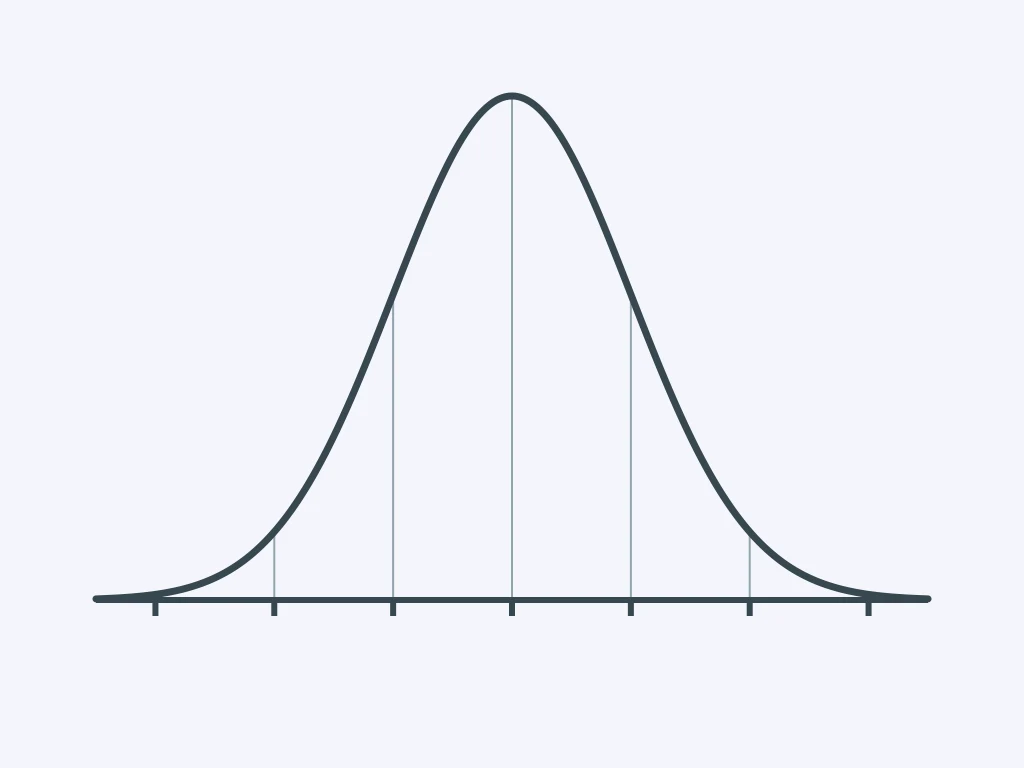
The figure shows the sampling distribution of p-hat for a survey where the population proportion is 0.60 and the sample size is 150. What are the center and standard deviation of the curve?
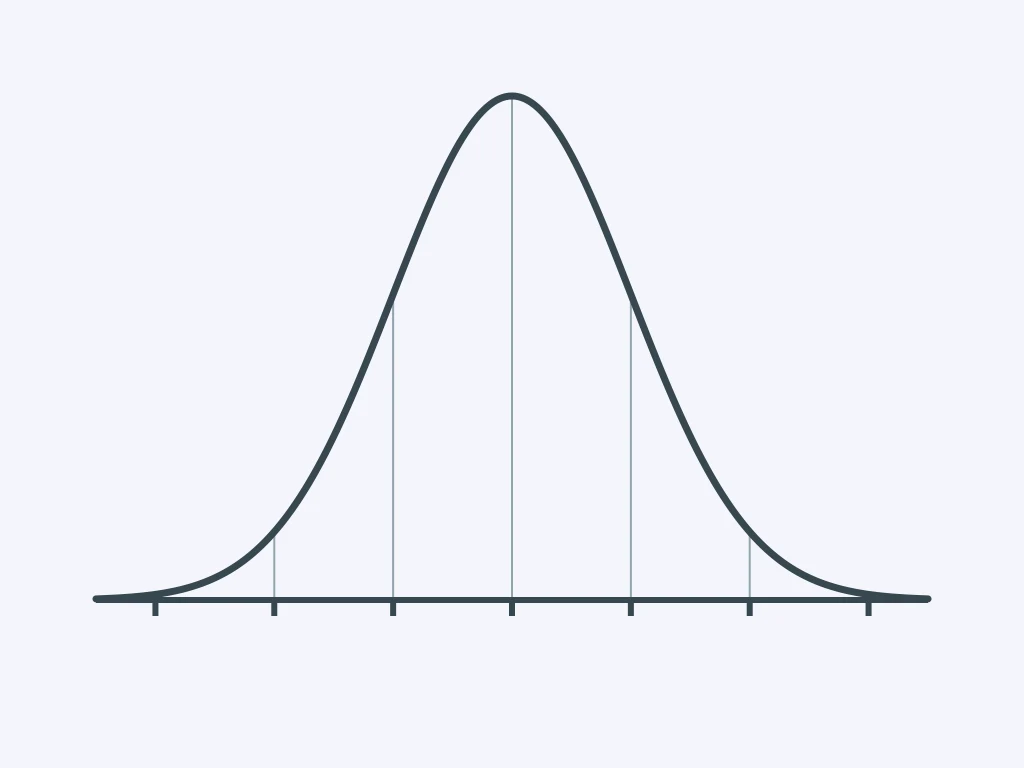
The figure shows the sampling distribution of x-bar for egg masses when the population mean is 62 grams, population standard deviation is 10 grams, and sample size is 100. What are the center and standard deviation?
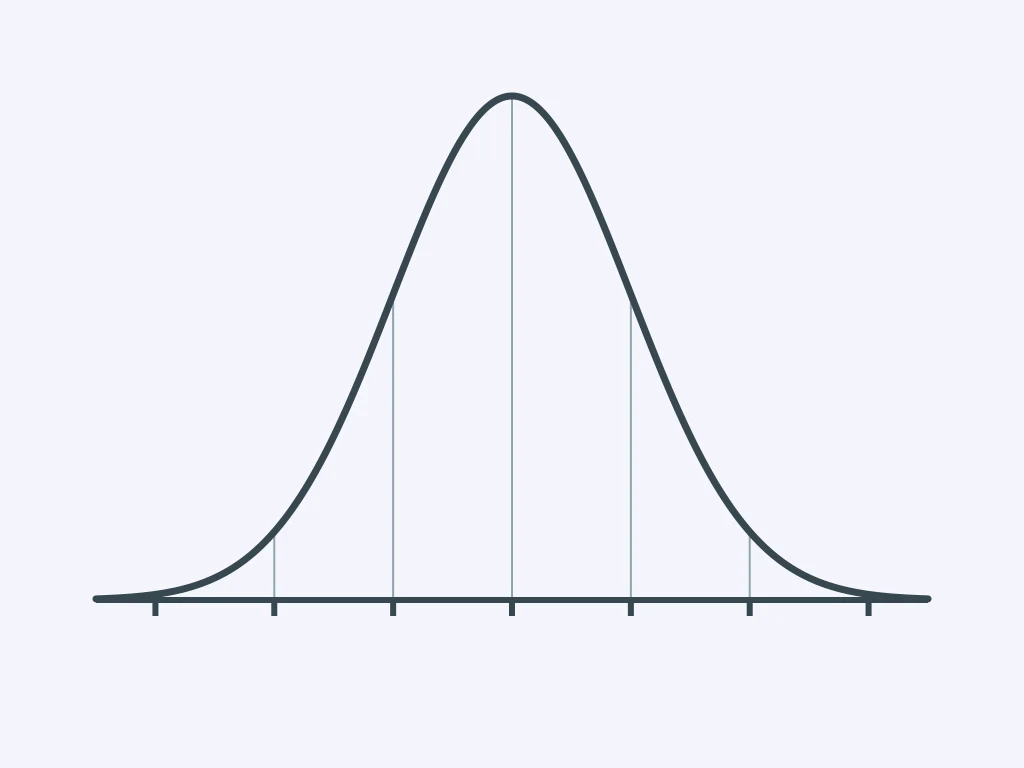
The figure shows the sampling distribution of p-hat for attendance surveys where the population proportion is 0.75 and the sample size is 300. What are the center and standard deviation?
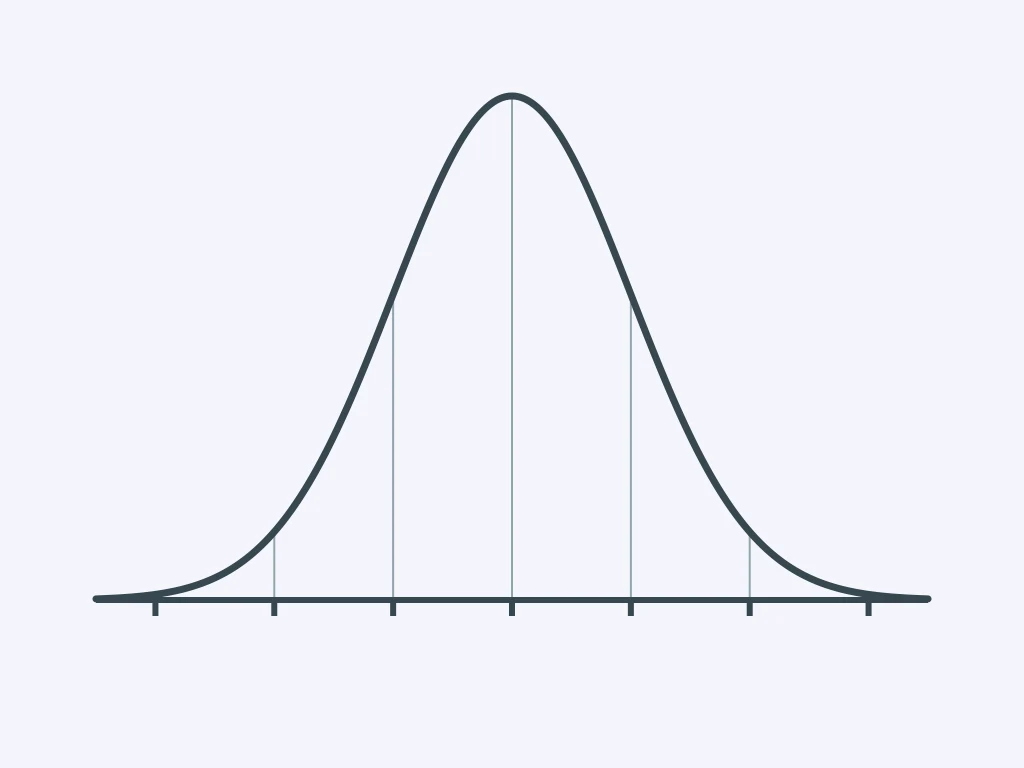
Carton filling times are strongly right-skewed, with population mean 8.0 seconds and standard deviation 2.4 seconds. Random samples of 64 cartons are drawn, and x-bar is recorded. What is the shape of the sampling distribution of x-bar?
Maple leaf lengths have an approximately normal population distribution with mean 7 centimeters and standard deviation 1.5 centimeters. Random samples of 9 leaves are drawn, and x-bar is recorded. What is the shape of the sampling distribution of x-bar?
Repair costs have a strongly left-skewed population distribution with mean $90 and standard deviation $25. Random samples of 4 repairs are drawn, and x-bar is recorded. What is the best description of the sampling distribution's shape?
In a city, the population proportion of eligible voters who favor a transit plan is 0.52. Random samples of 400 voters are drawn, and p-hat is recorded. What is the shape of the sampling distribution of p-hat?

Mean and Standard Deviation of a Binomial
20 questions

The Geometric Distribution
20 questions

What a Sampling Distribution Is
20 questions
The Central Limit Theorem
20 questions

Sampling Distribution of a Sample Proportion
20 questions

Sampling Distribution of a Sample Mean
20 questions

What a Confidence Interval Means
24 questions

Margin of Error: What Changes It
40 questions

Average Rate of Change
50 questions
Keep the tile or give it to a rival team.
Answer correctly to move your piece.
Texas Hold'em. Answer to draw better cards.
Pick a chest. Big bonus, or lose it all.
Catapult a rival castle or repair your own.
Climb the mountain, or push a rival off it.




