Loading
by BlastRoom
Read charts, maps, timelines, and diagrams alongside text to understand what each adds.
#us_grade_8_english
20 questions
One question set, multiple game modes. Tap any game to see it in action. Not sure which to pick?
Answer to place stones and capture territory.
Outrun the snow together.
Earn blasts, then hunt the other team.
Answer to earn energy, then climb.

The class blasts through walls together.
Bid on mystery lots. Most money wins.
Sell tours. Nice, standard, or a total scam.

Answer, restock, and serve the rush.
More correct answers pulls the rope your way.
Answer, then shoot down the alien wave.
Answer, then tap to leap the frozen ridge.
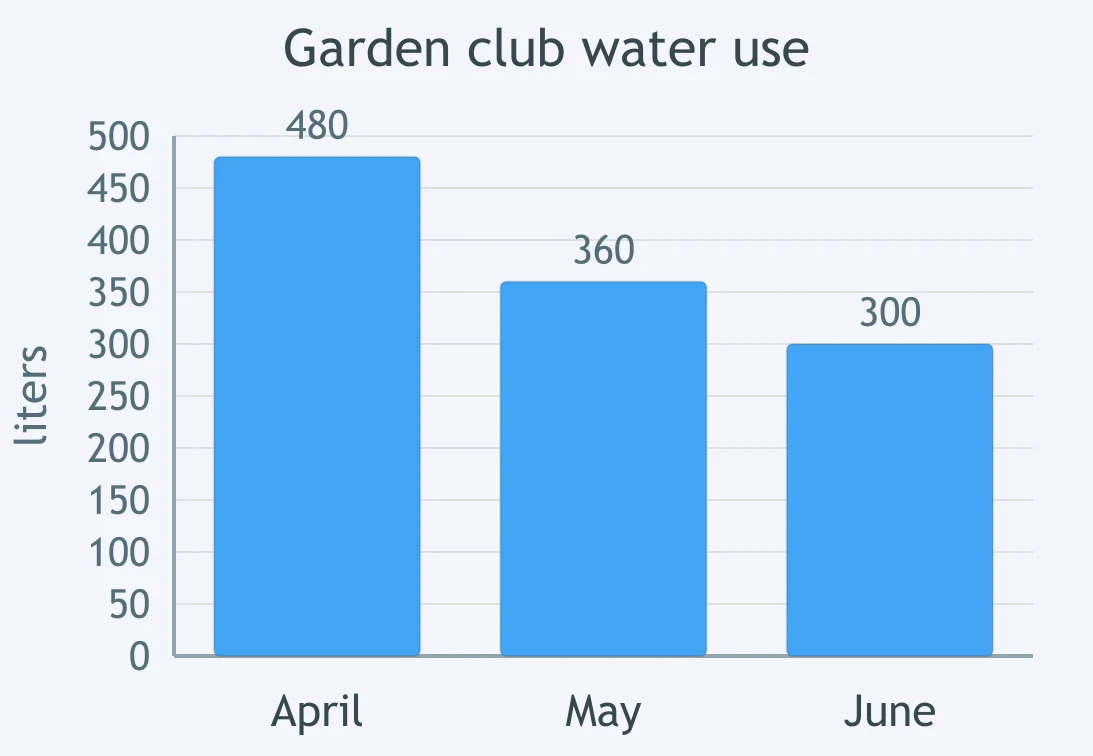
Passage: The garden club says water use fell through spring. This bar chart accompanies it. What does the chart show?
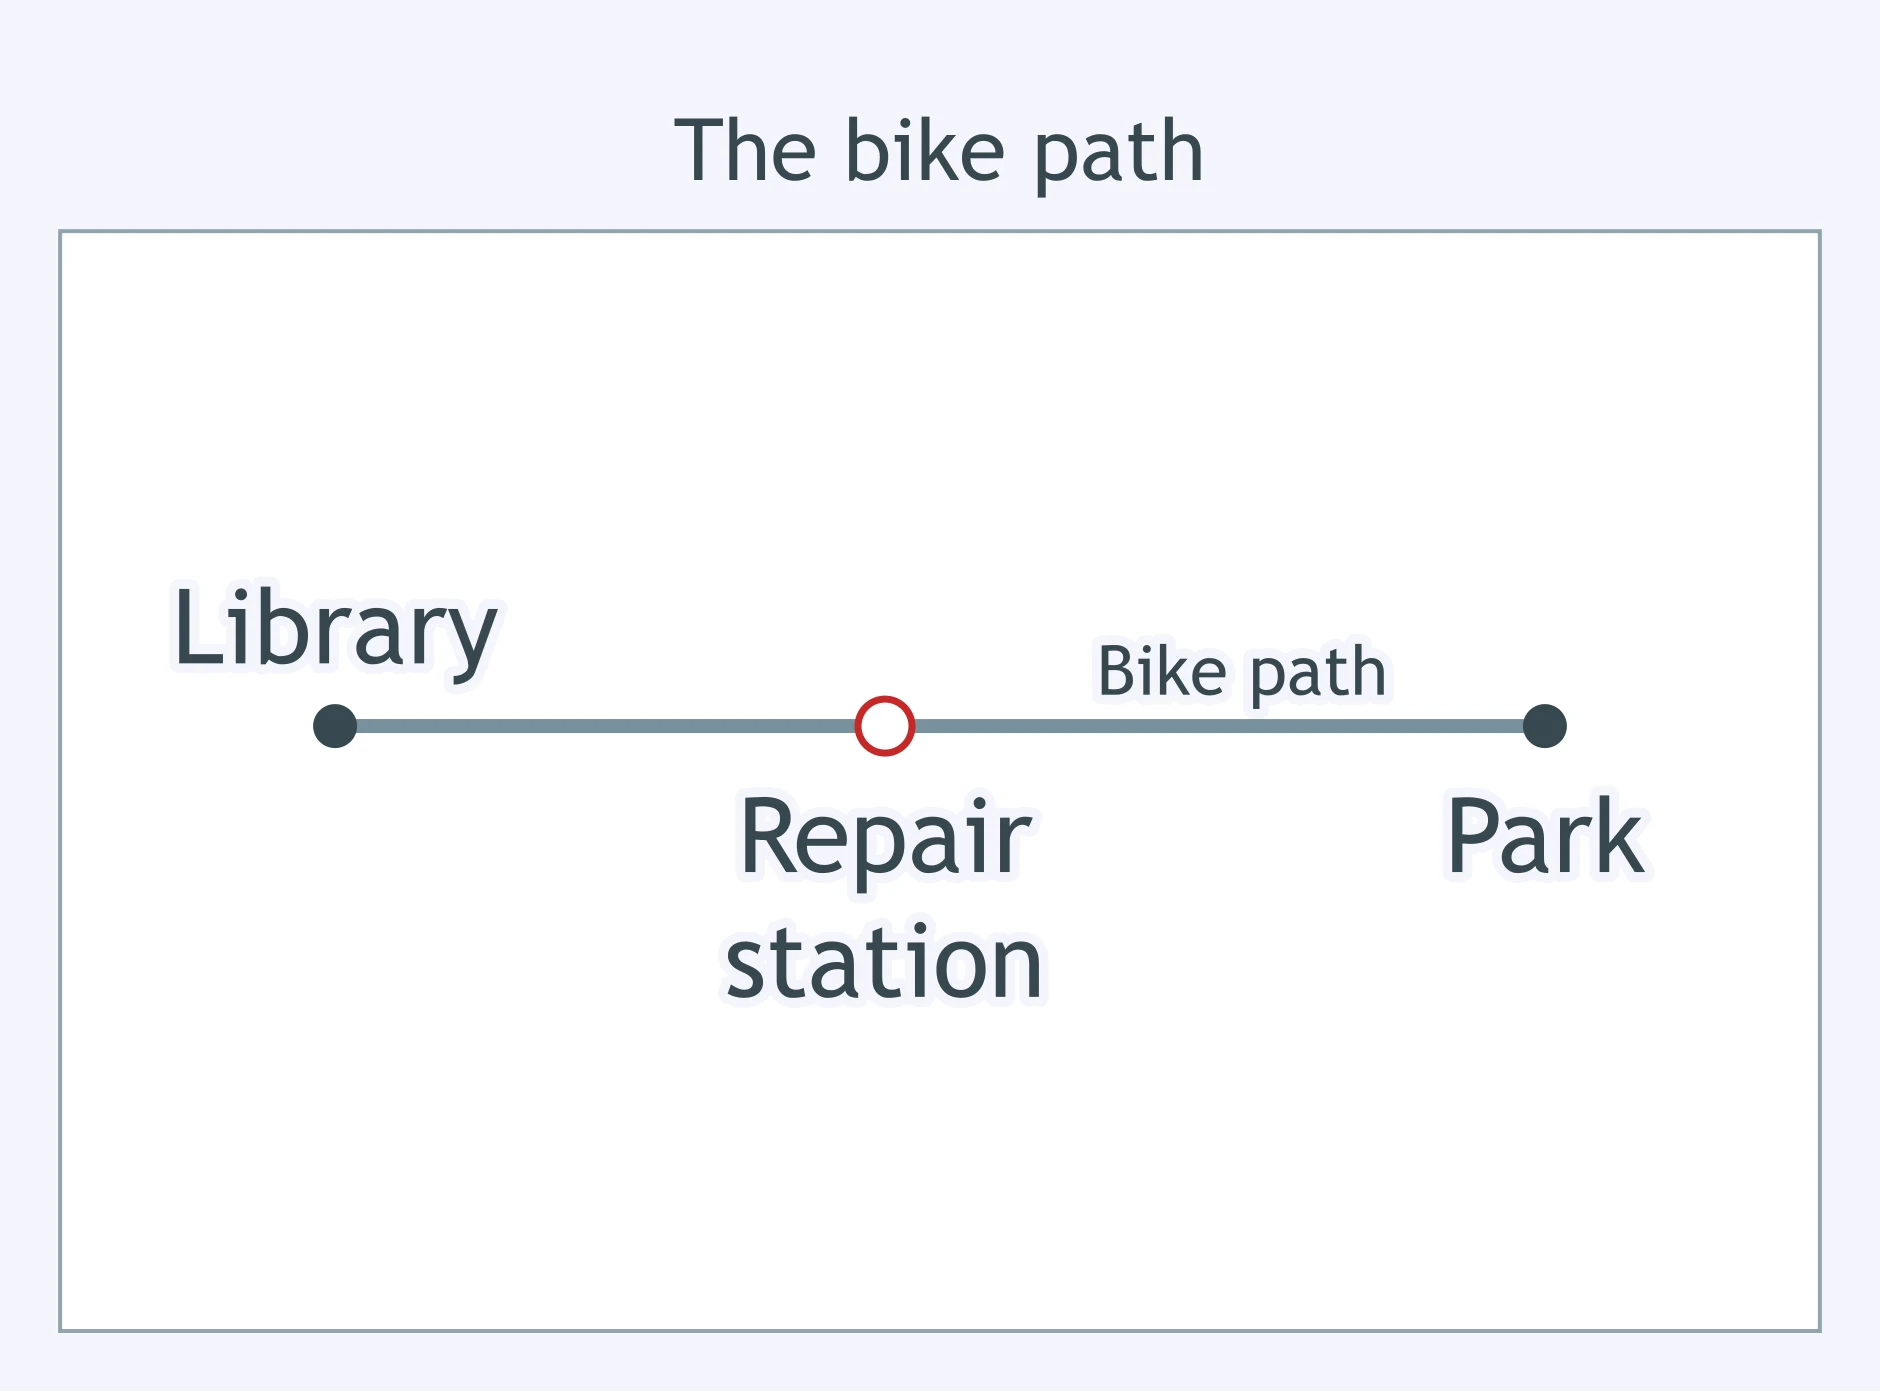
Text: A bike path links the library and park. This map accompanies it. What does the map show?
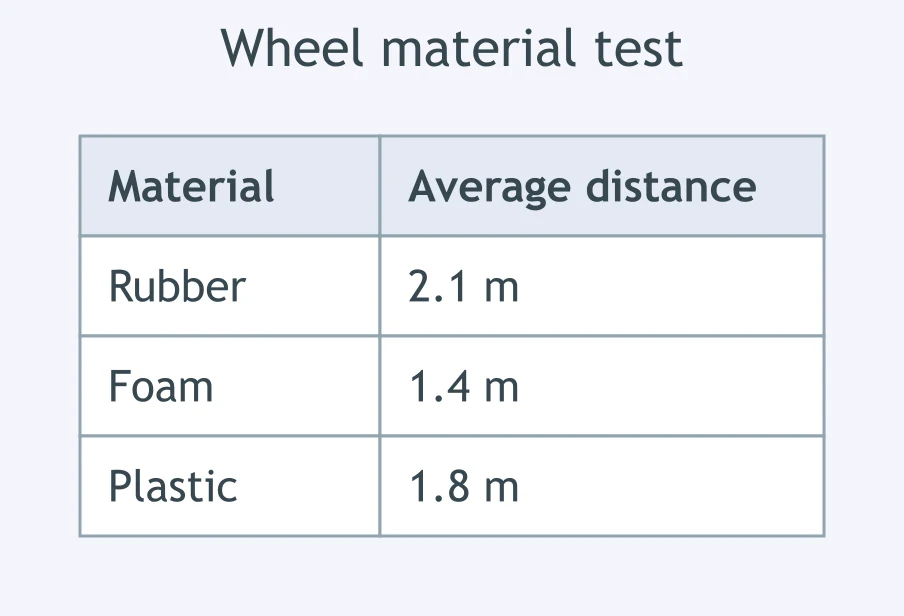
Article: A robotics team tested three wheel materials. This table gives the results. What result does the table show?
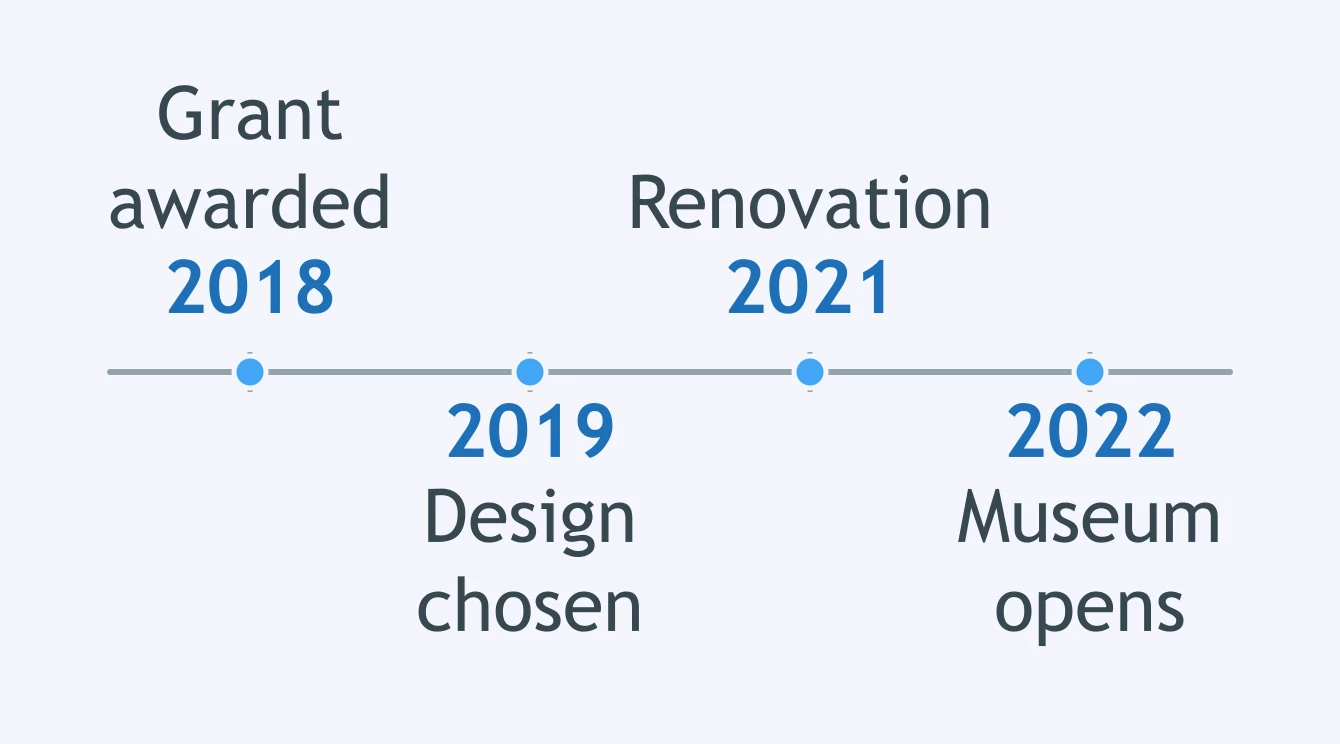
Passage: The town opened a museum after years of planning. This timeline accompanies it. What pattern does the timeline show?
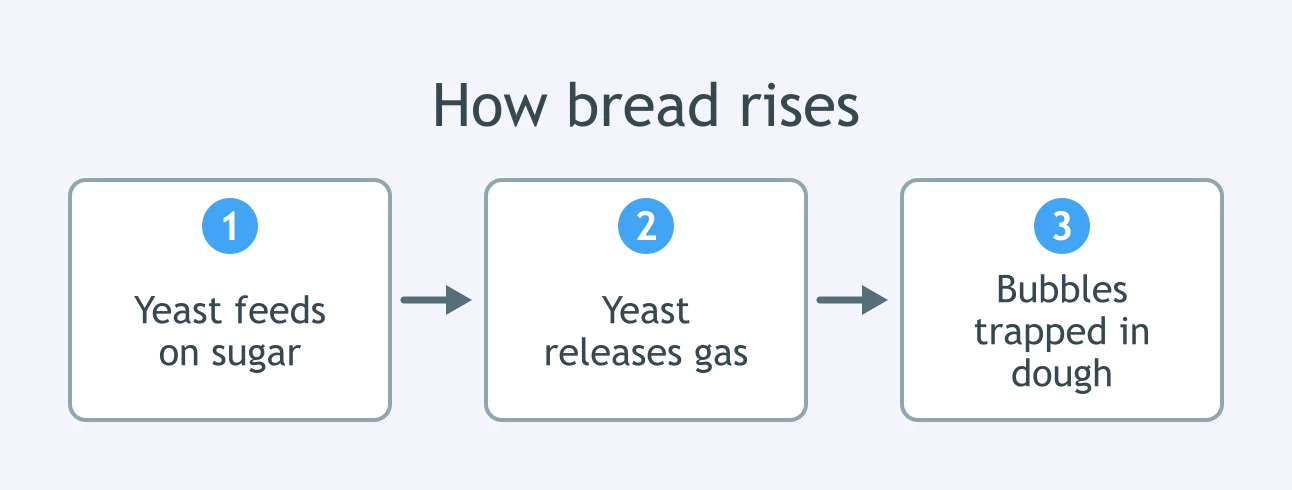
Text: A recipe explains how bread rises. This diagram accompanies it. What process does the diagram show?
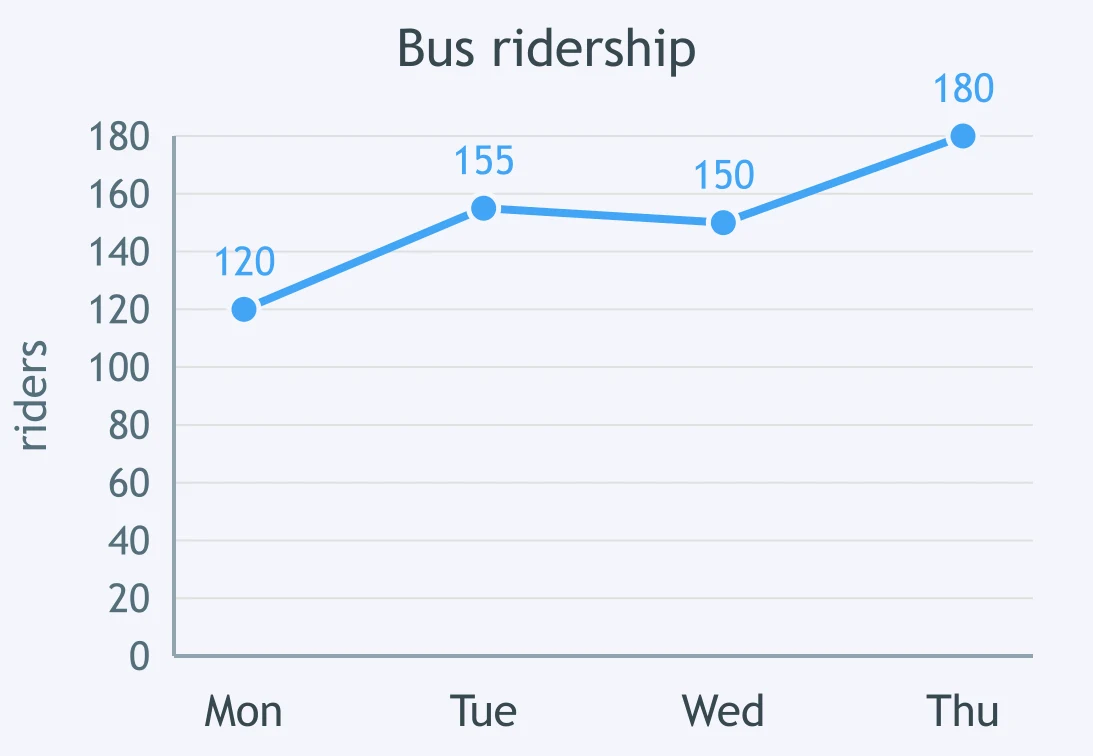
Report: Bus ridership changed after a new schedule. This line graph accompanies it. What trend does the graph show?
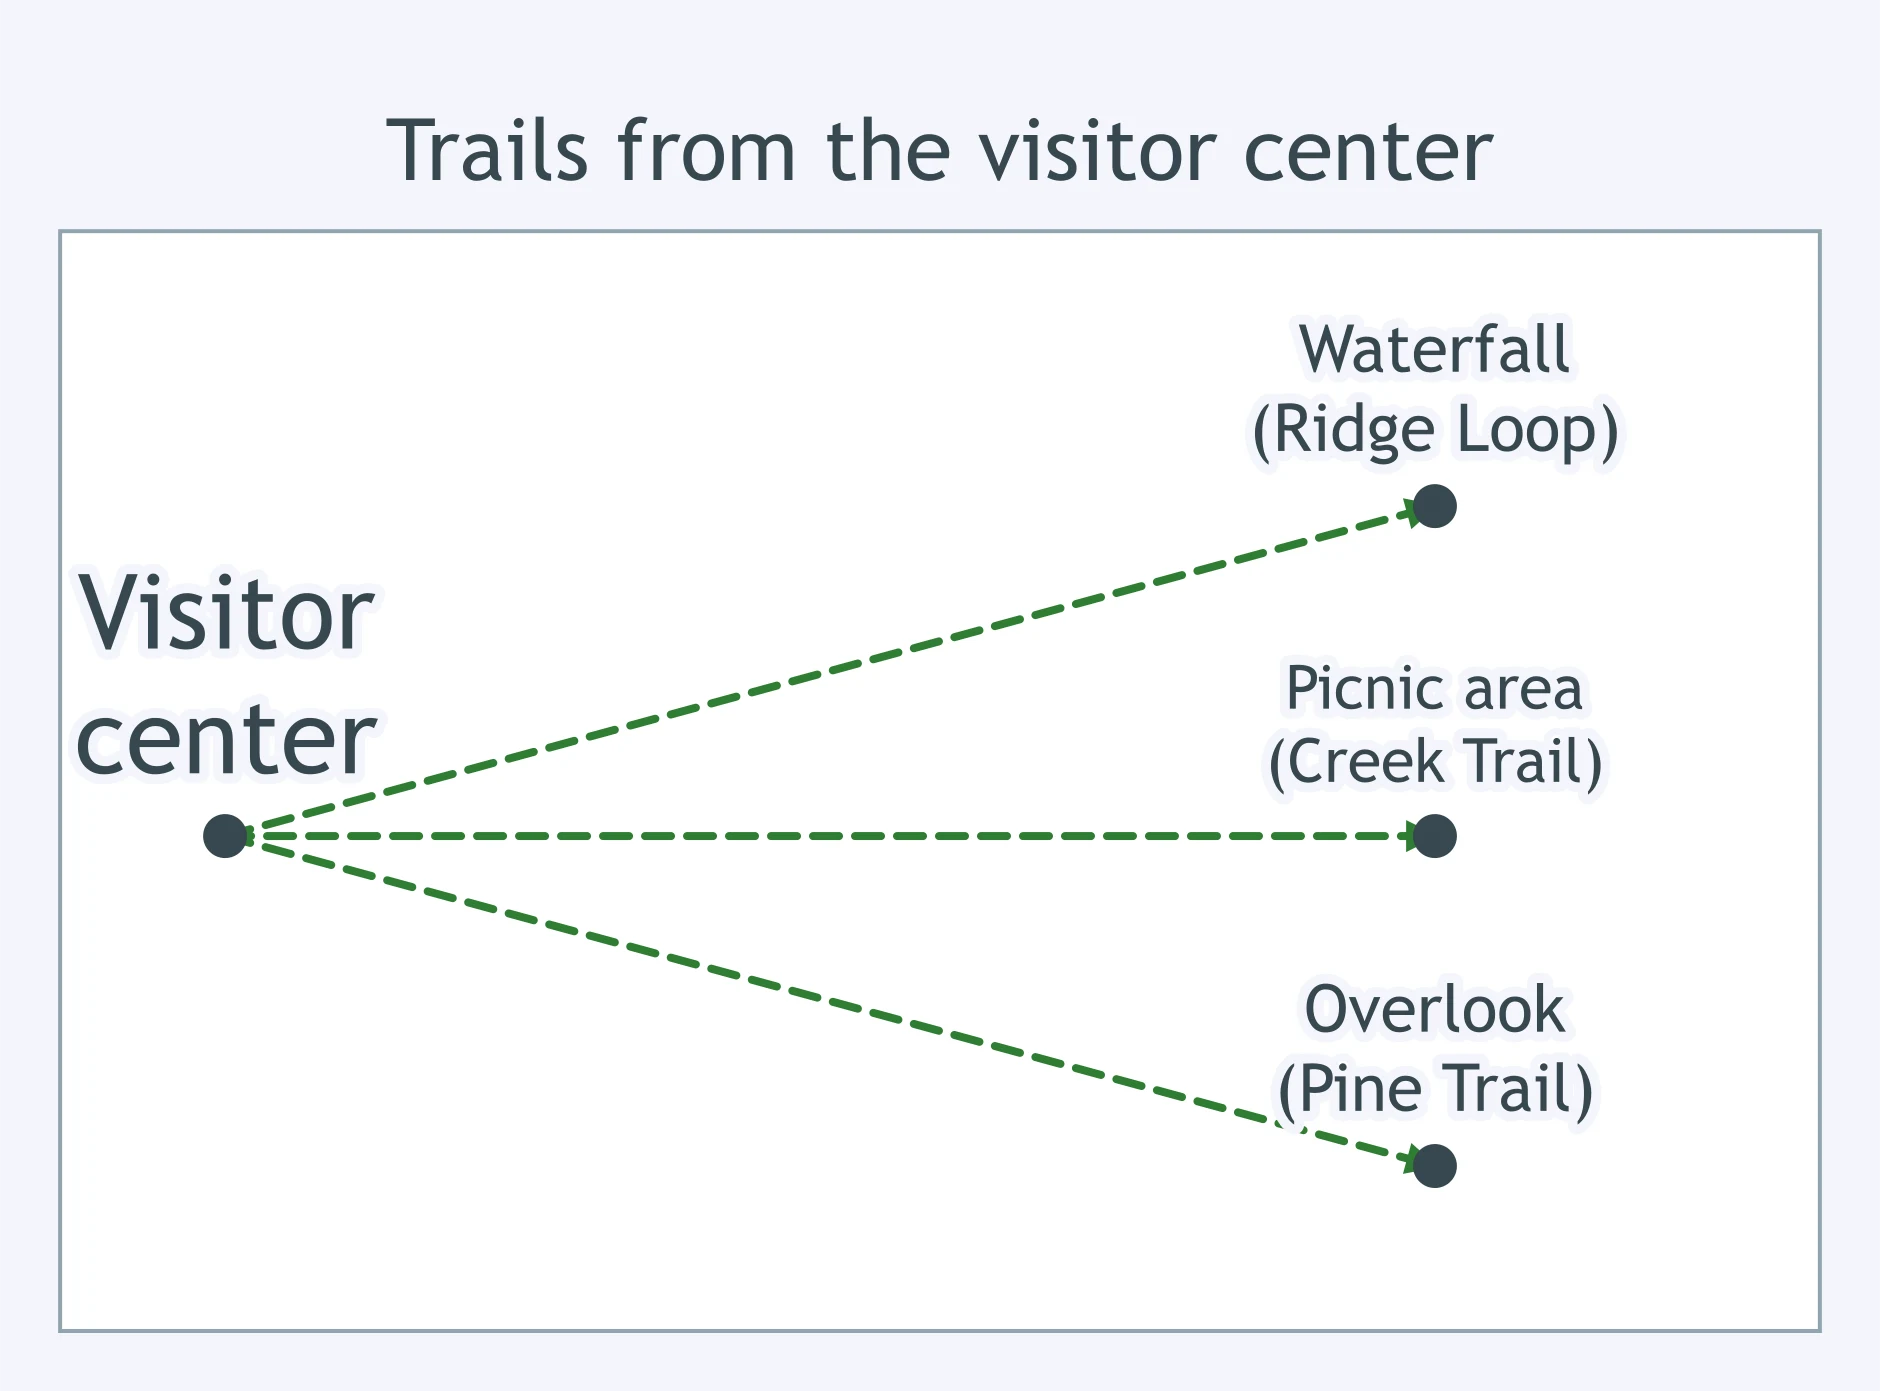
Text: The guide says three trails start at the visitor center. This map accompanies it. What does the map add?
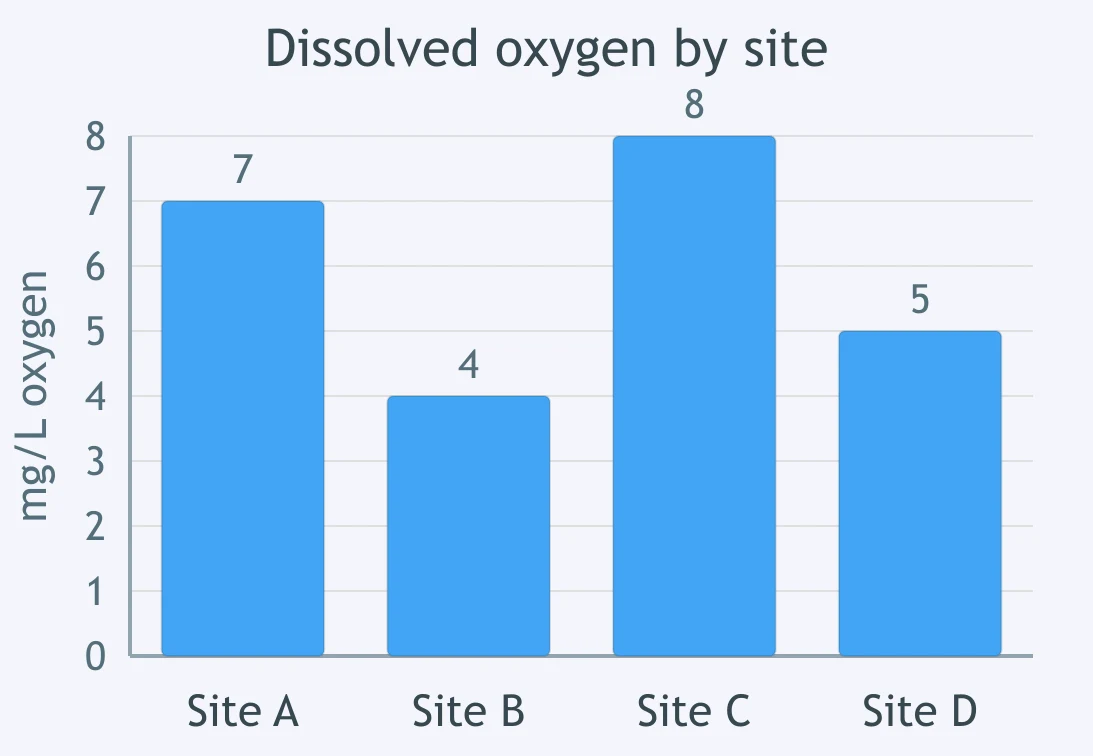
Passage: The lab tested water at four sites. This bar chart gives the results. What information does the chart add?
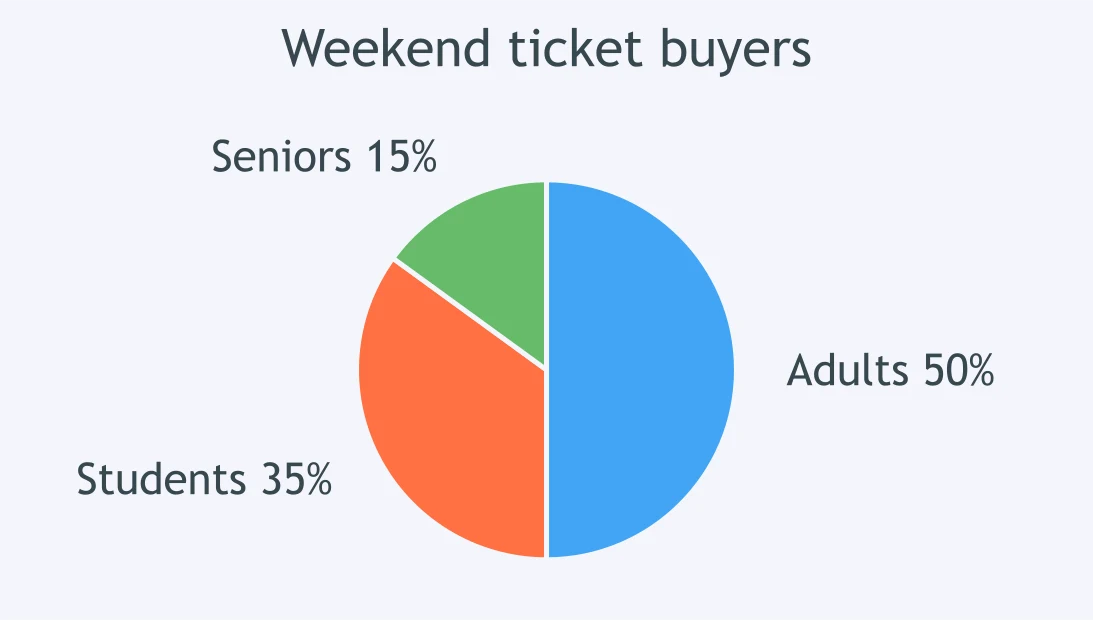
Text: The theater sold tickets for a weekend play. This chart shows the buyers. What does the chart add to the text?
Article: A phone app helps users track homework. Screenshot description: calendar tab, checklist tab, timer tab. What extra information does this visual provide?
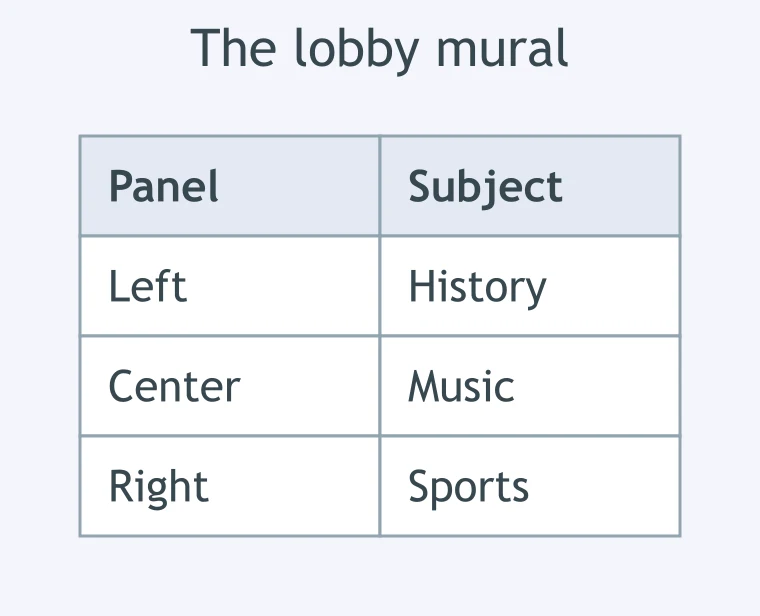
Text: A caption says a mural covers the school lobby wall. This table lists the mural's panels. What does the table add?
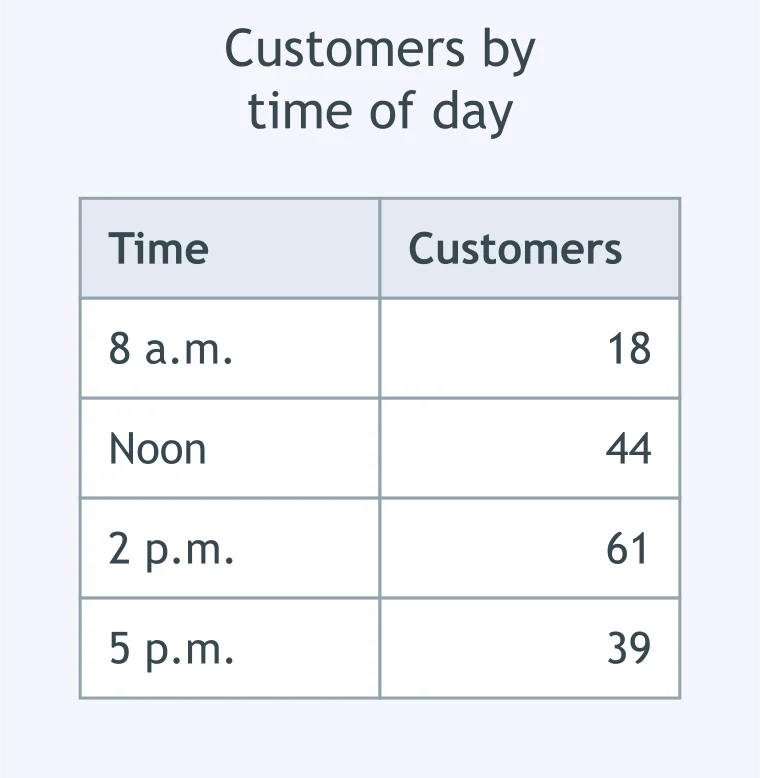
Claim: The café was busiest after lunch. This table gives the counts. How does the table relate to the claim?
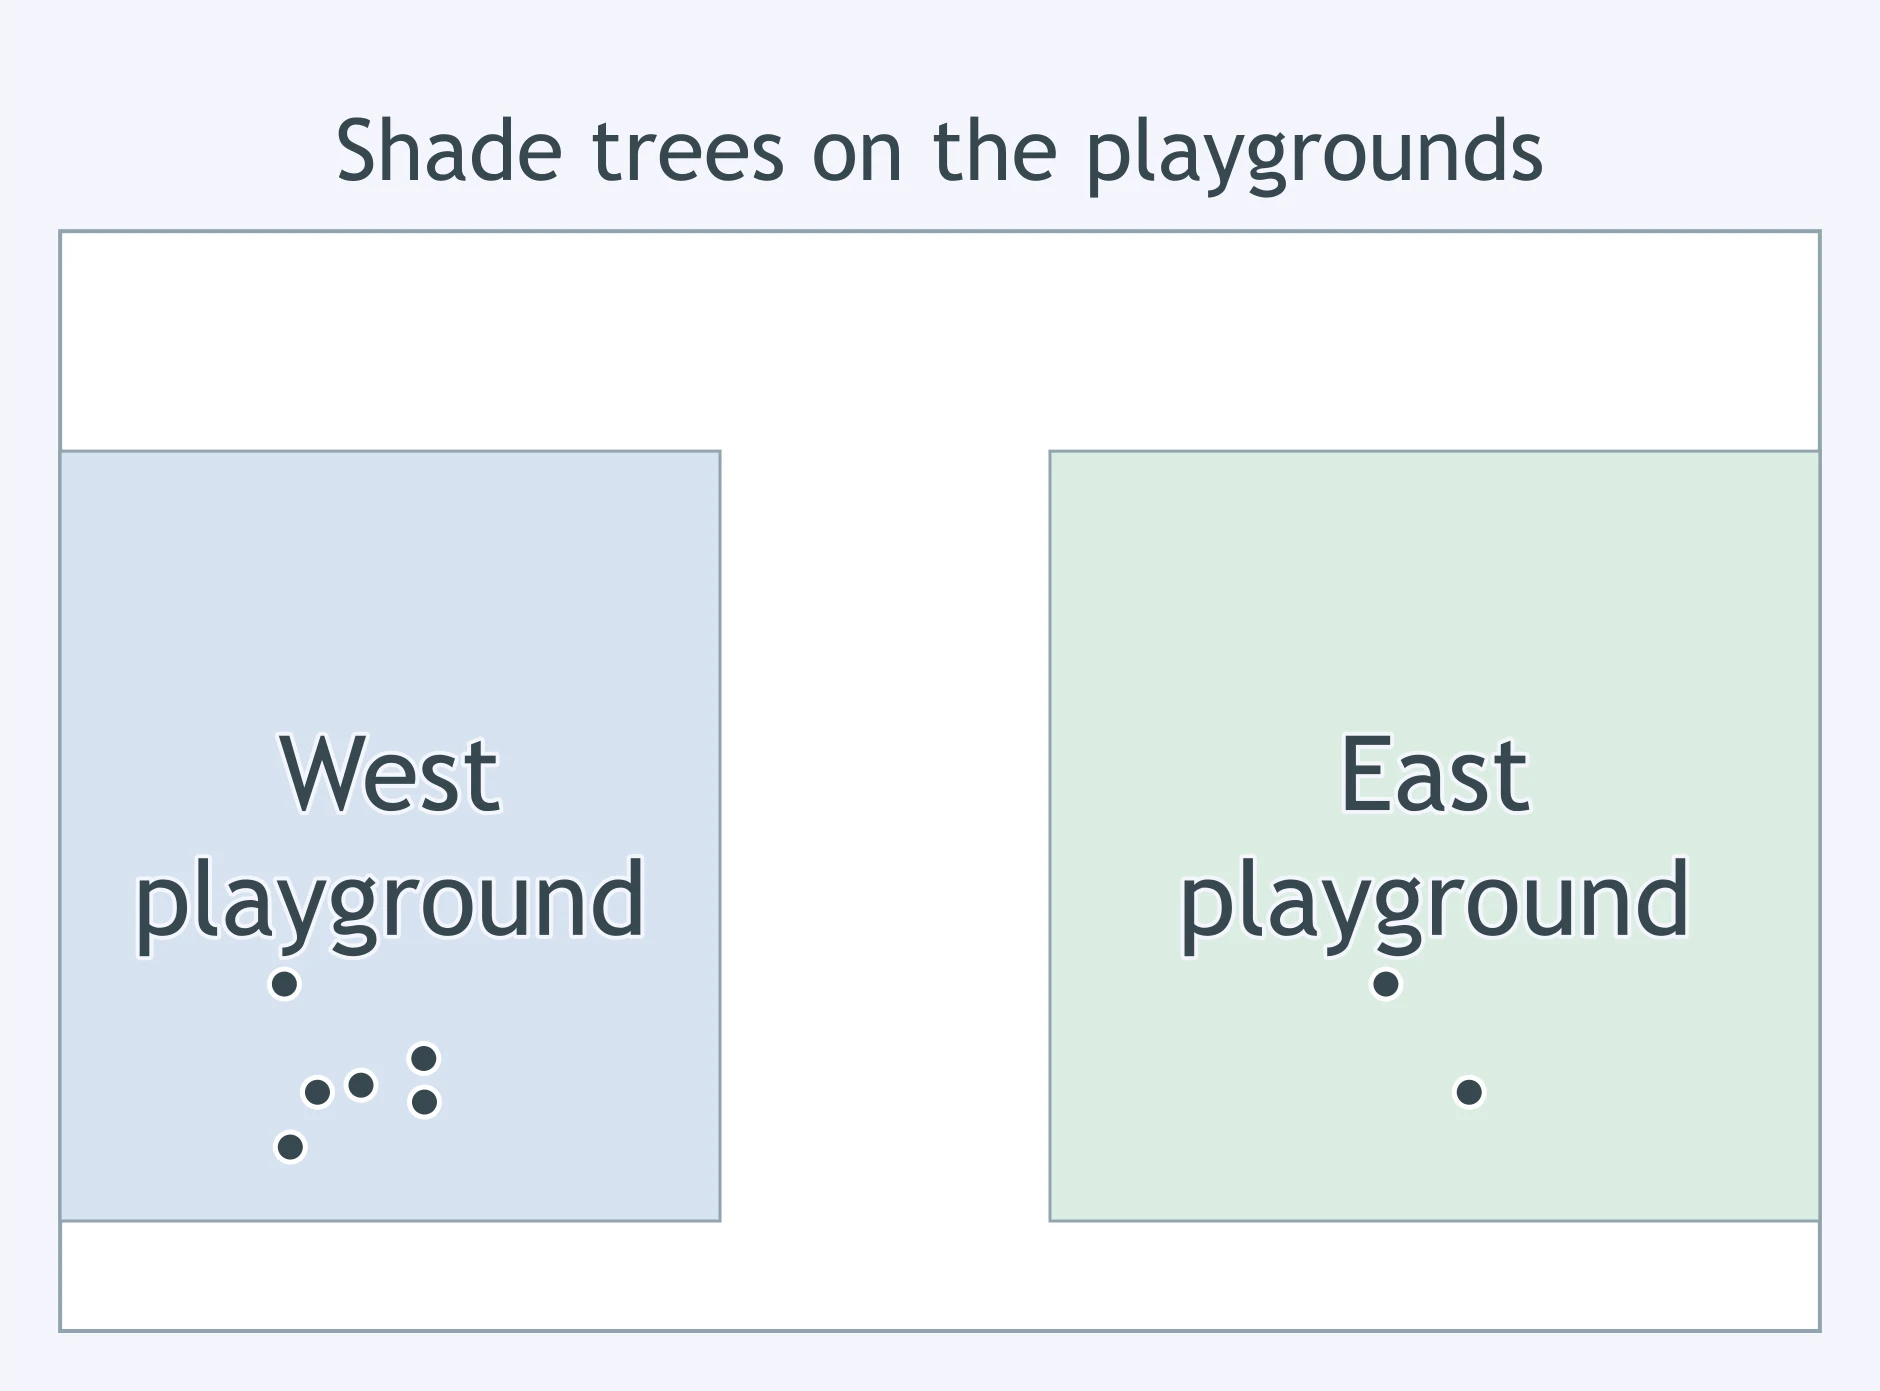
Claim: The east playground gets more shade than the west playground. This map marks each shade tree. What does the map show?
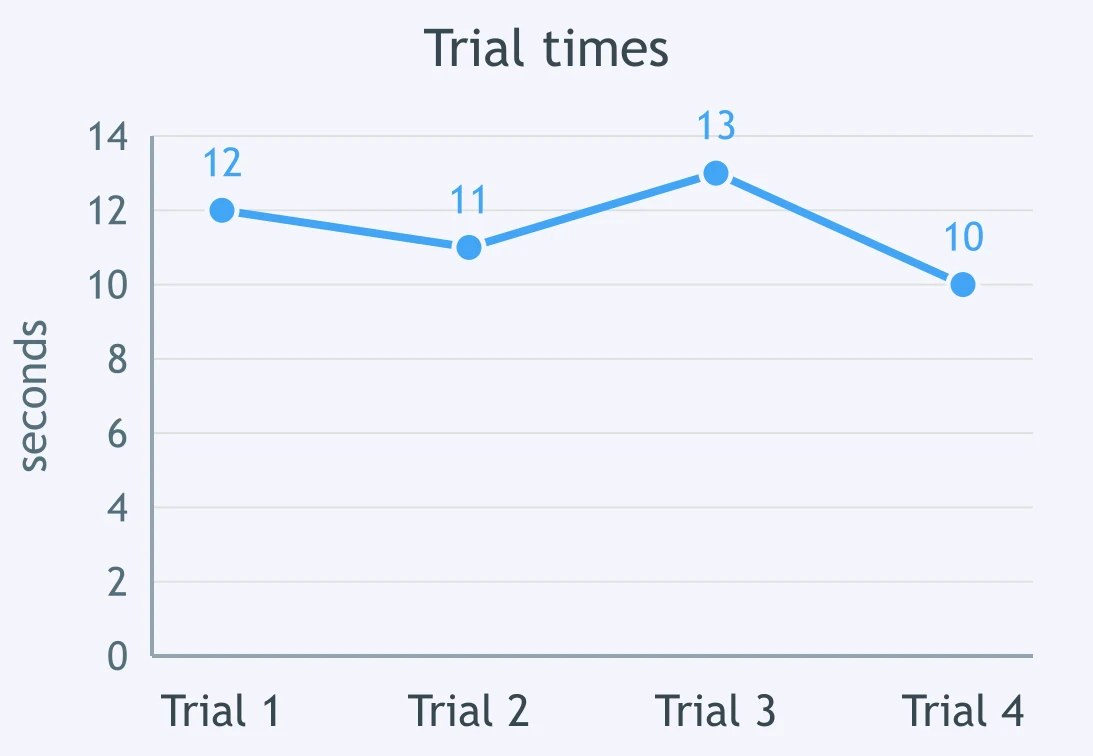
Claim: The team's speed improved every trial. This line graph gives the times. Does the graph support the claim?
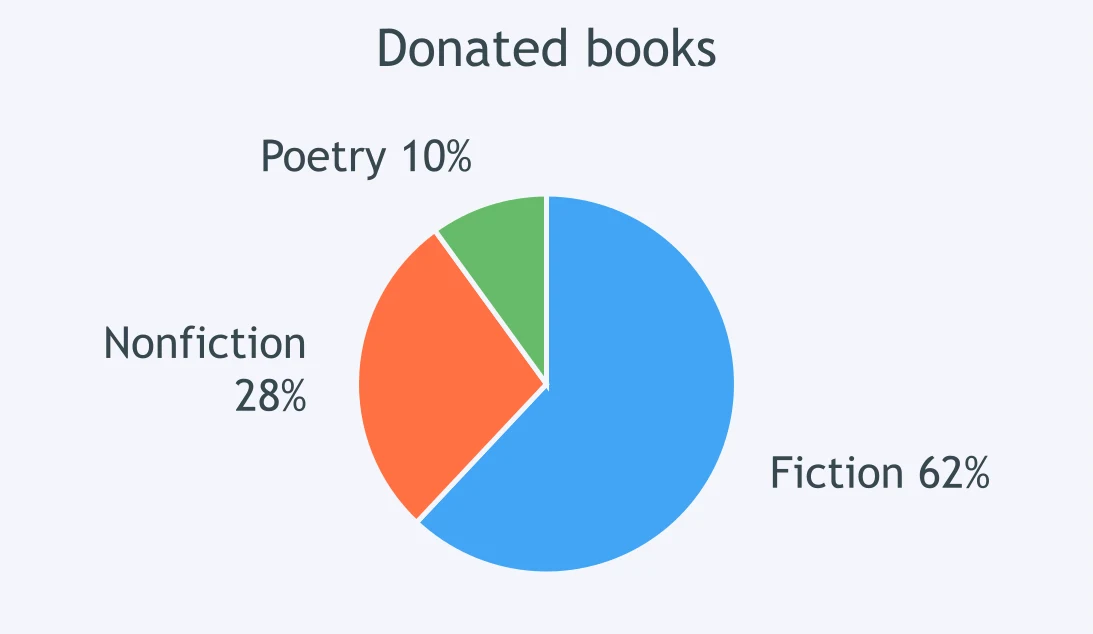
Claim: Most donated books were fiction. This chart shows the donations. How does the chart connect to the claim?
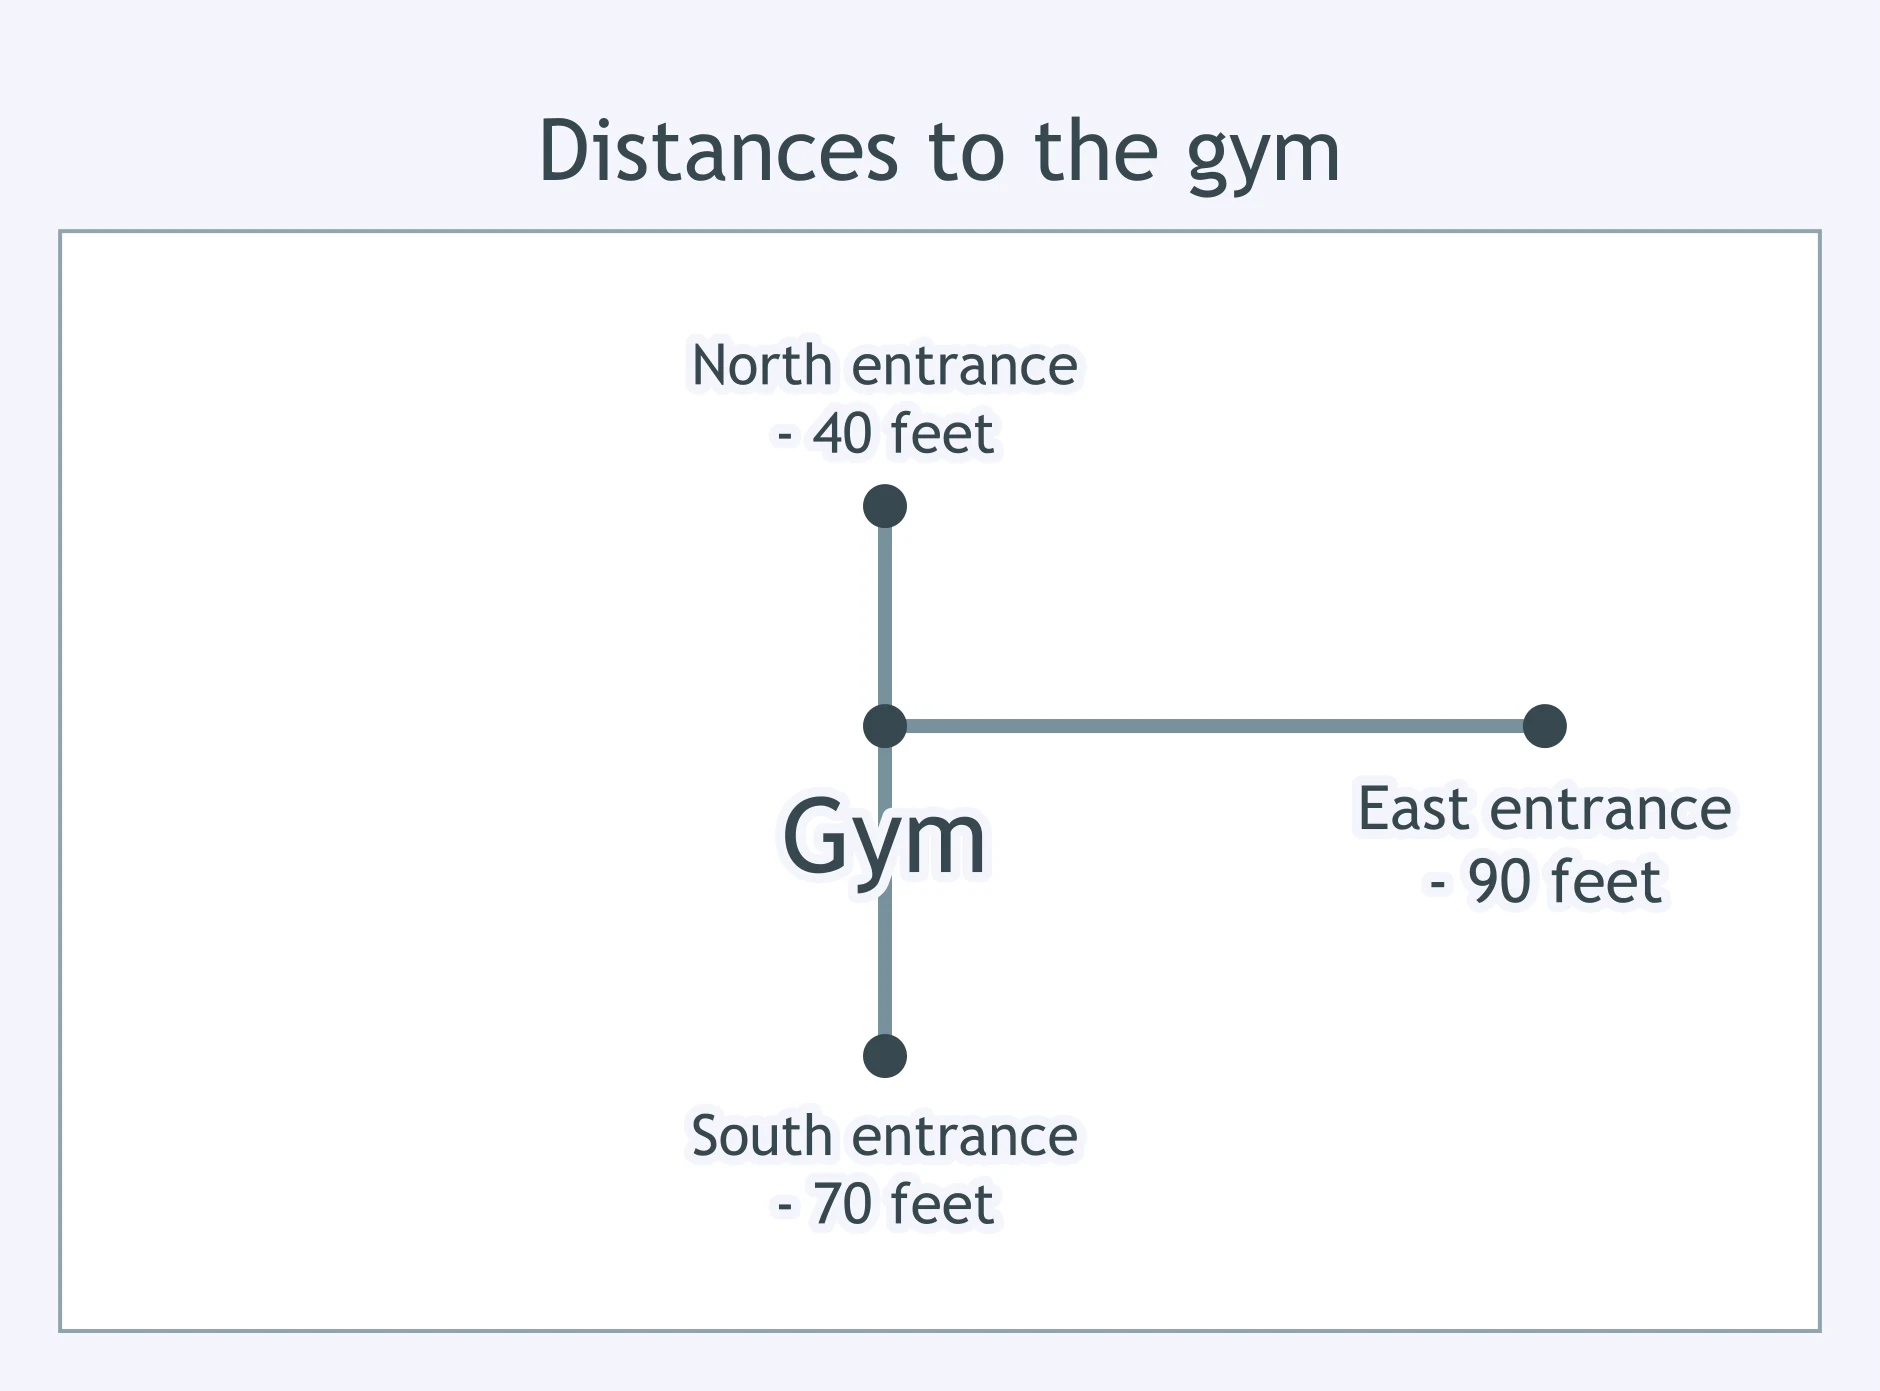
Claim: The north entrance is closest to the gym. This map gives the distances. What is the best conclusion?
A paragraph describes five steps in building a birdhouse, from cutting wood to hanging it. Which visual would best present the order?
A report compares rainfall in four cities during July. Which visual would best show the amounts side by side?
An article explains how water moves through a school filtration tank: gravel layer, sand layer, charcoal layer, then outlet pipe. Which visual fits best?
A school newsletter needs to show the bus route from the school to the pool, with turns at Pine Street and Lake Avenue. Which visual would work best?
Crack the passcode before the zombies get in.
Answer, then swat bugs for bonus points.
Race through questions at your own speed.
Same question on every screen. Fastest wins.

Pick a tile, answer, hit bonuses and steals.
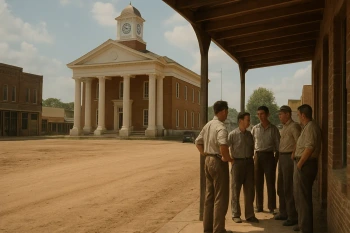
To Kill a Mockingbird: How Maycomb Shapes Its People
20 questions