Loading
by BlastRoom
Deciding which of two results is better relative to its own group by standardizing both.
#probability_and_statistics
20 questions
One question set, multiple game modes. Tap any game to see it in action. Not sure which to pick?
Answer to place stones and capture territory.
Outrun the snow together.
Earn blasts, then hunt the other team.
Answer to earn energy, then climb.

The class blasts through walls together.
Bid on mystery lots. Most money wins.
Sell tours. Nice, standard, or a total scam.

Answer, restock, and serve the rush.
More correct answers pulls the rope your way.
Answer, then shoot down the alien wave.
Answer, then tap to leap the frozen ridge.
Biology test mean 72 points, standard deviation 8; chemistry mean 65, standard deviation 5. Dana scored 84 in biology and 74 in chemistry. Higher is better. Which result was stronger?
For a school showcase, math quiz mean 68 points, standard deviation 10; science fair mean 42, standard deviation 6. Lina scored 83 in math and 51 in science. Higher is better. Which result was stronger?
Kim earned 83 in debate, where the mean was 75 and standard deviation 4. Lee earned 74 in writing, where the mean was 62 and standard deviation 8. Higher is better. Who stood out more?
A coach compares keyboarding speed and coding scores. Keyboarding mean 48 words per minute, standard deviation 6; coding mean 70 points, standard deviation 10. Nora typed 60; Omar scored 85. Higher is better. Who did better?
At a club, fundraising mean 120 dollars, standard deviation 30; reading fluency mean 150 words per minute, standard deviation 20. Pia raised 165; Quinn read 184. Higher is better. Who did better relative to the group?
Two athletes compare soccer points and basketball rebounds. Soccer mean 14 points, standard deviation 4; rebounds mean 8, standard deviation 2. Raul scored 20 points; Sara had 12 rebounds. Higher is better. Who had the stronger result?
Tia's art portfolio score was 95; art mean 81, standard deviation 7. Uri's music audition score was 86; music mean 76, standard deviation 5. Higher is better. Which result was stronger?
During academic bees, spelling scores had mean 32 and standard deviation 5; geography scores had mean 45 and standard deviation 9. Vera scored 41 in spelling; Wes scored 58 in geography. Higher is better. Which stands out more?
In track, the 800 m field mean time was 132 s, standard deviation 6; the 1500 m field mean was 280 s, standard deviation 15. Ana ran 123 s; Bea ran 259 s. Lower time is better. Who stood out more?
A robotics league times courses. Robot course mean 52 s, standard deviation 4; drone course mean 90 s, standard deviation 10. Max finished in 44 s; Nina in 76 s. Lower time is better. Who was stronger?
Clinic A wait times have mean 38 min and standard deviation 5; Clinic B wait times have mean 65 min and standard deviation 12. Omar waited 29 min at A; Priya waited 47 min at B. Lower wait is better. Who did better?
In swim meets, 50 m times have mean 35 s and standard deviation 2; 100 m times have mean 78 s and standard deviation 6. Rosa swam 32 s; Sam swam 69 s. Lower time is better. Which result was stronger?
At a factory, Line A averages 4.8 defects per 100 packages, standard deviation 1.2; Line B averages 7.5, standard deviation 2.0. Tran's line had 3.0 defects; Uma's had 4.7. Fewer defects are better. Who did better?
Laptop charging time has mean 70 min and standard deviation 8; tablet charging time has mean 110 min and standard deviation 20. Val's laptop charged in 58 min; Will's tablet in 82 min. Lower time is better. Who did better?
The normal curve shows Test P scores, with ticks at the mean and at each standard deviation. Test Q is normal with mean 500 and standard deviation 100. If matched by z-score, what Test Q score is equivalent to 310 on Test P?
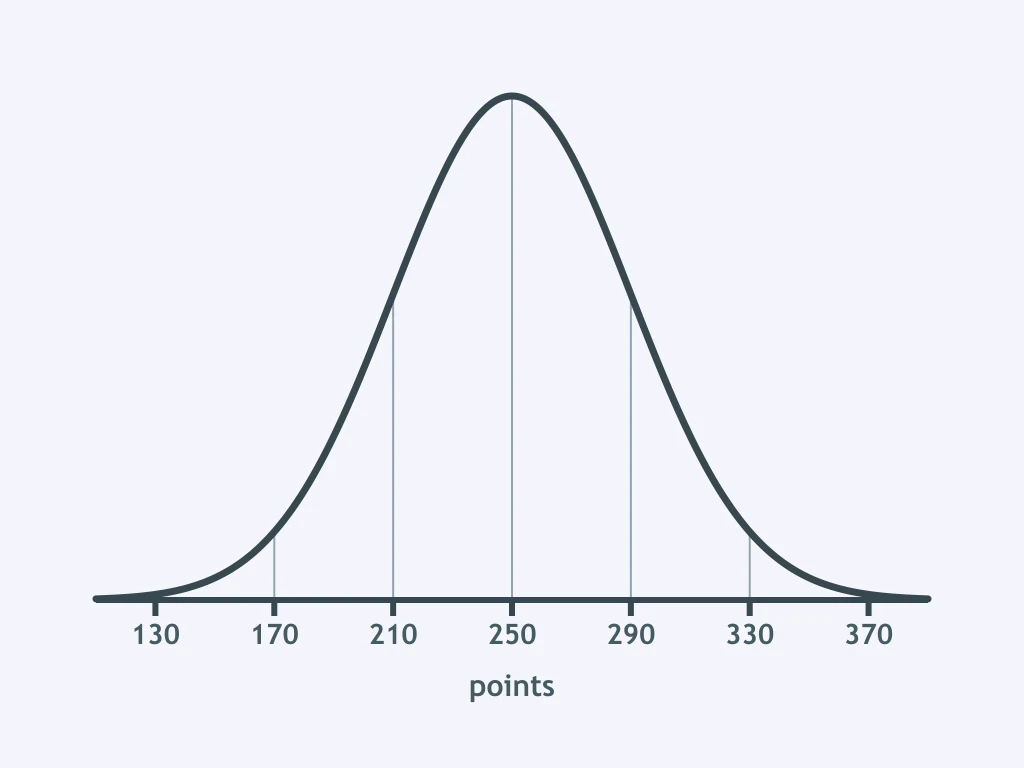
The normal curve shows times on treadmill Test A, with ticks at the mean and at each standard deviation. Cycling Test B is normal with mean 42 min and standard deviation 6. If matched by z-score, 24 min on A equals what time on B?
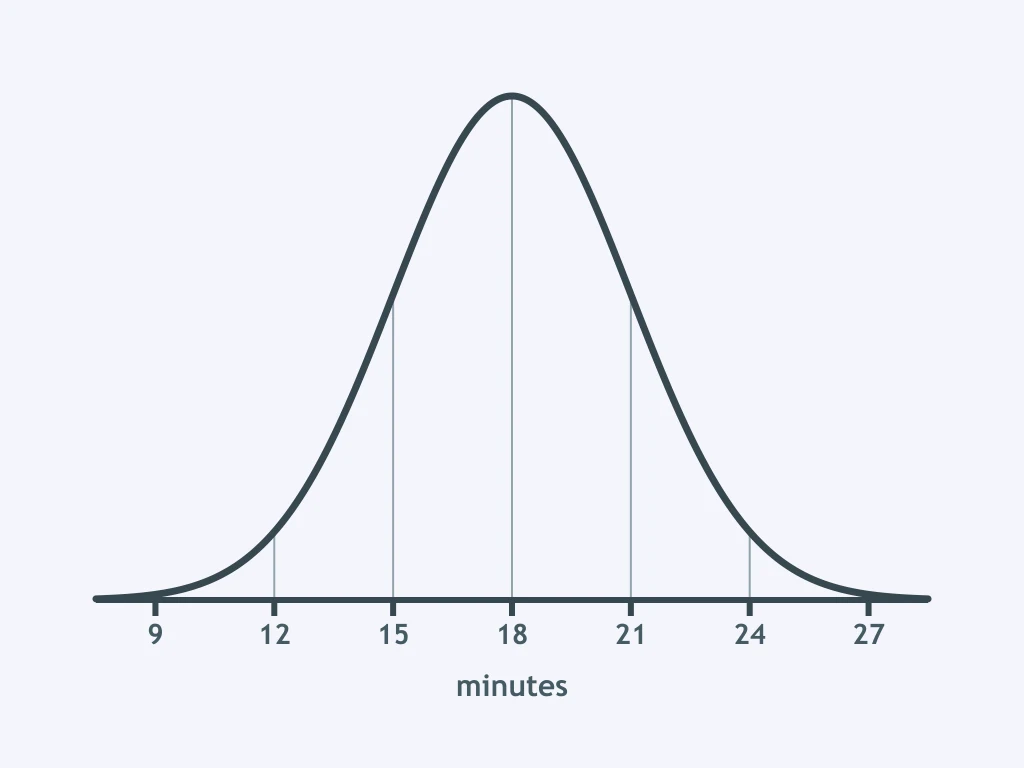
The normal curve shows scores on language screening X, with ticks at the mean and at each standard deviation. Screening Y is normal with mean 60 and standard deviation 8. If scores are matched by z-score, a 65 on X matches what score on Y?
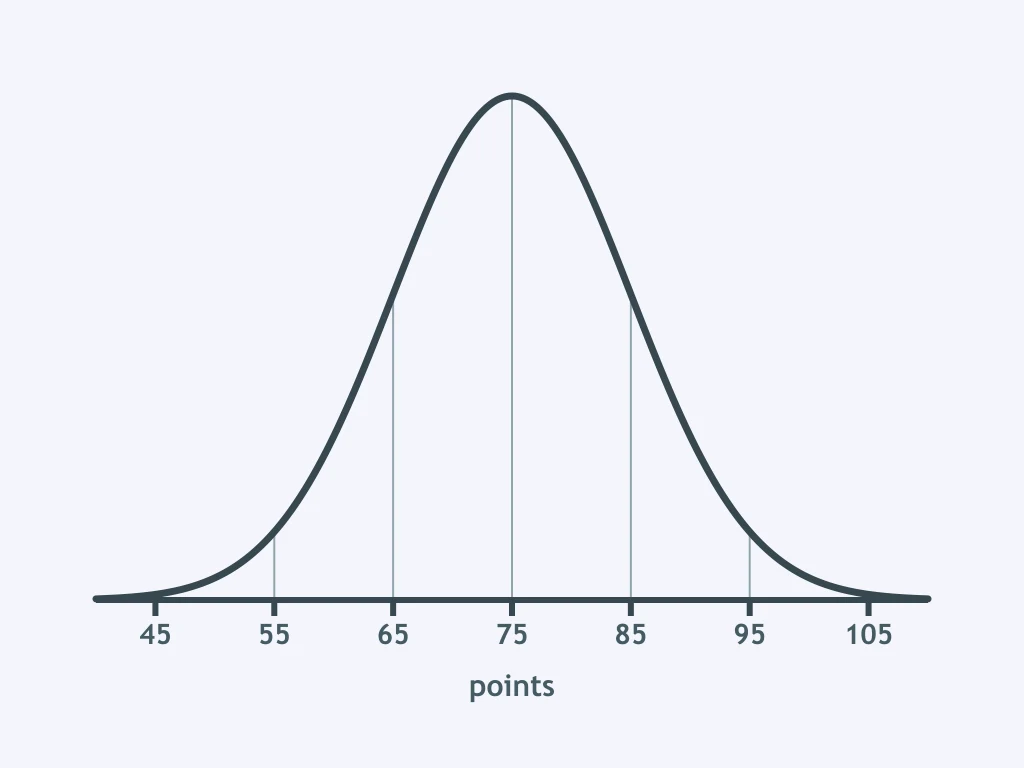
The normal curve shows times on Balance Test D, with ticks at the mean and at each standard deviation. Balance Test C is normal with mean 40 s and standard deviation 5. If matched by z-score, 38 s on D equals what result on C?
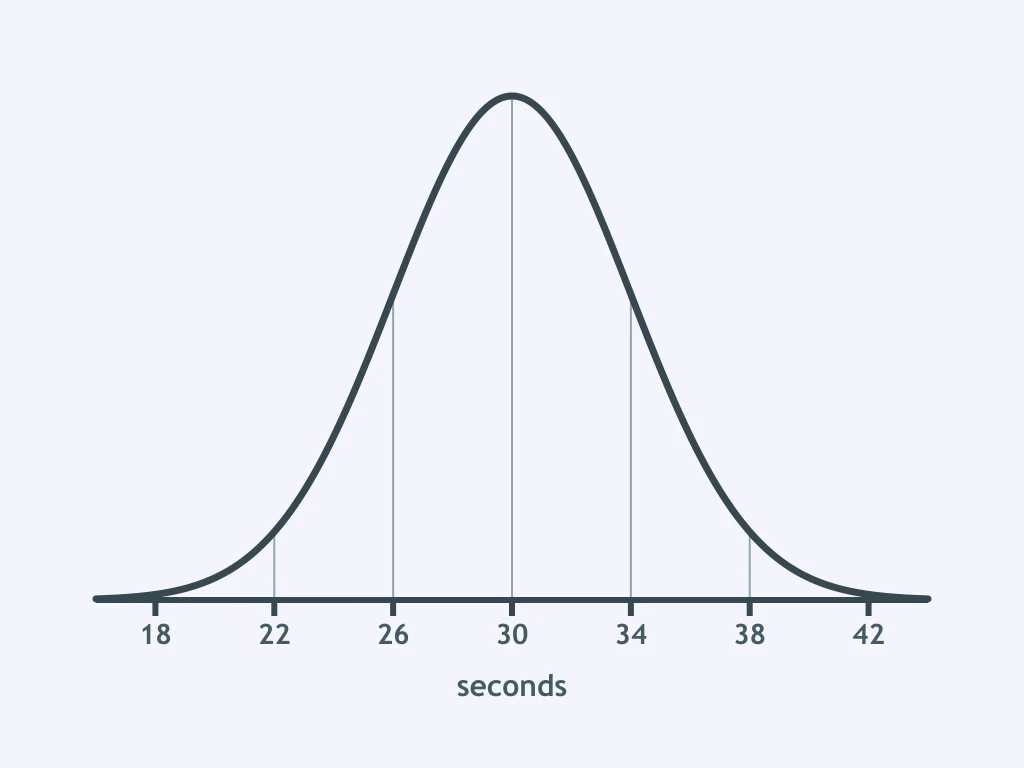
The normal curve shows essay scores on rubric B, with ticks at the mean and at each standard deviation. Rubric A is normal with mean 70 and standard deviation 12. If matched by z-score, a 95 on rubric B equals what score on rubric A?
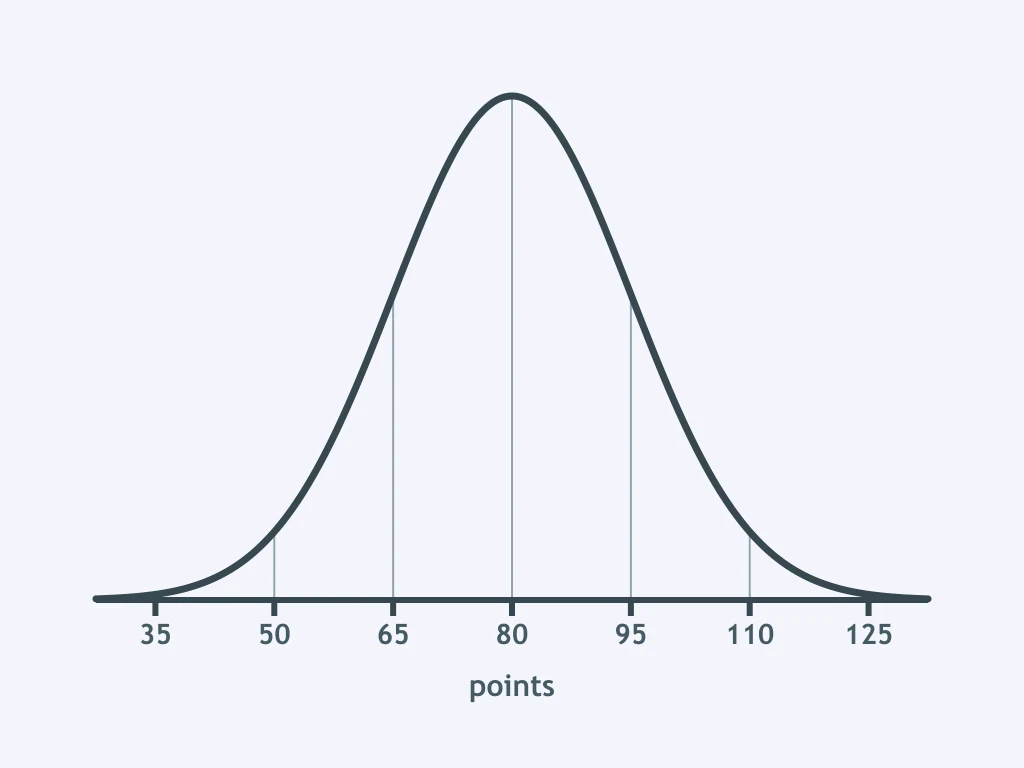
The normal curve shows reaction times on Level 1, with ticks at the mean and at each standard deviation. Level 2 is normal with mean 520 ms and standard deviation 80. If matched by z-score, 350 ms on Level 1 equals what time on Level 2?
Crack the passcode before the zombies get in.
Answer, then swat bugs for bonus points.
Race through questions at your own speed.
Same question on every screen. Fastest wins.

Pick a tile, answer, hit bonuses and steals.
Normal Probabilities with normalcdf
40 questions