Loading
by BlastRoom
Computing a percentage within a row or a column, and deciding whether the two variables are associated.
#probability_and_statistics
20 questions
One question set, multiple game modes. Tap any game to see it in action. Not sure which to pick?
Answer to place stones and capture territory.
Outrun the snow together.
Earn blasts, then hunt the other team.
Answer to earn energy, then climb.

The class blasts through walls together.
Bid on mystery lots. Most money wins.
Sell tours. Nice, standard, or a total scam.

Answer, restock, and serve the rush.
More correct answers pulls the rope your way.
Answer, then shoot down the alien wave.
Answer, then tap to leap the frozen ridge.
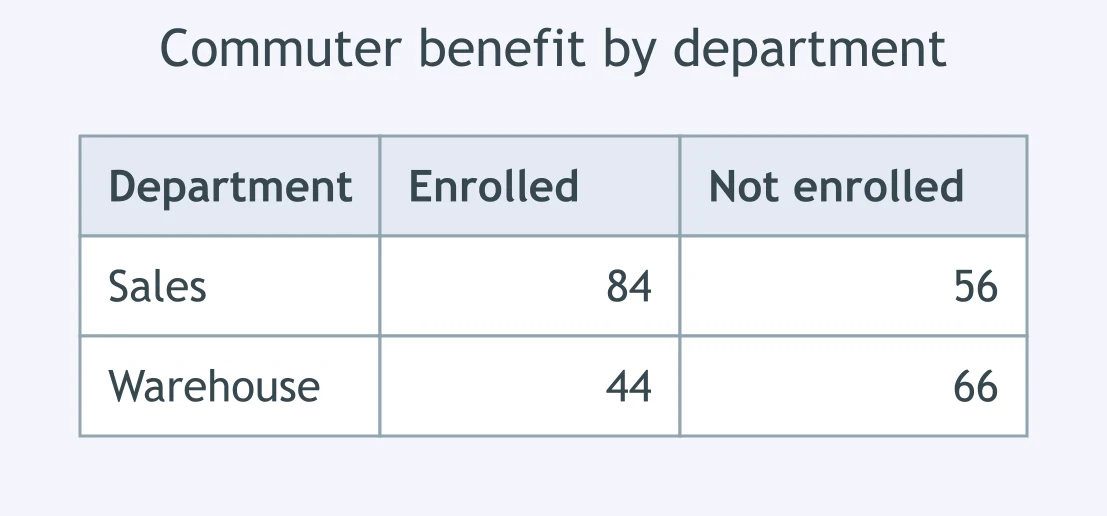
A company table classifies employees by department and commuter benefit. Of sales employees, what percent enrolled? Round to the nearest whole percent.
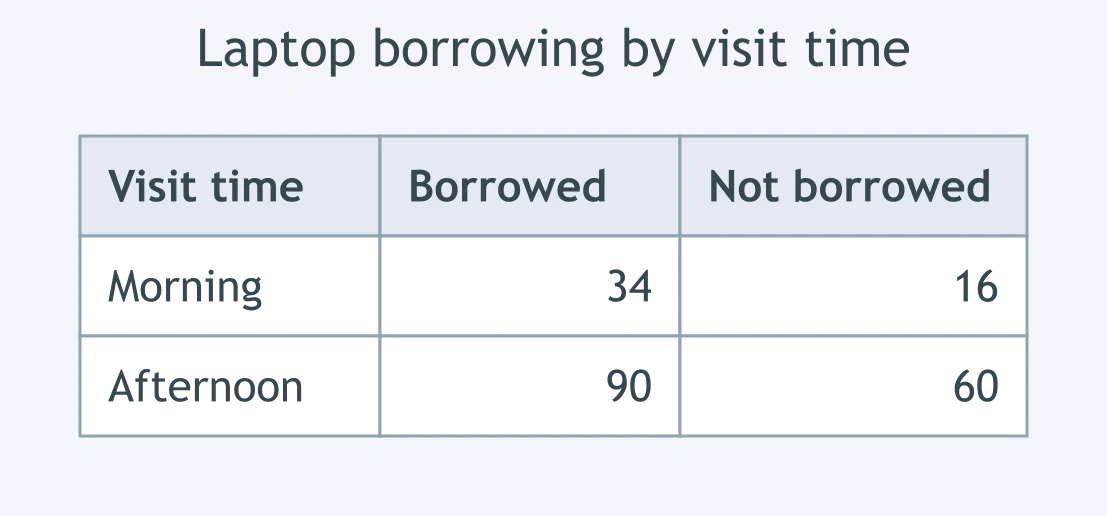
The library table classifies 200 visitors by visit time and laptop borrowing. Of morning visitors, what percent borrowed a laptop? Round to the nearest whole percent.
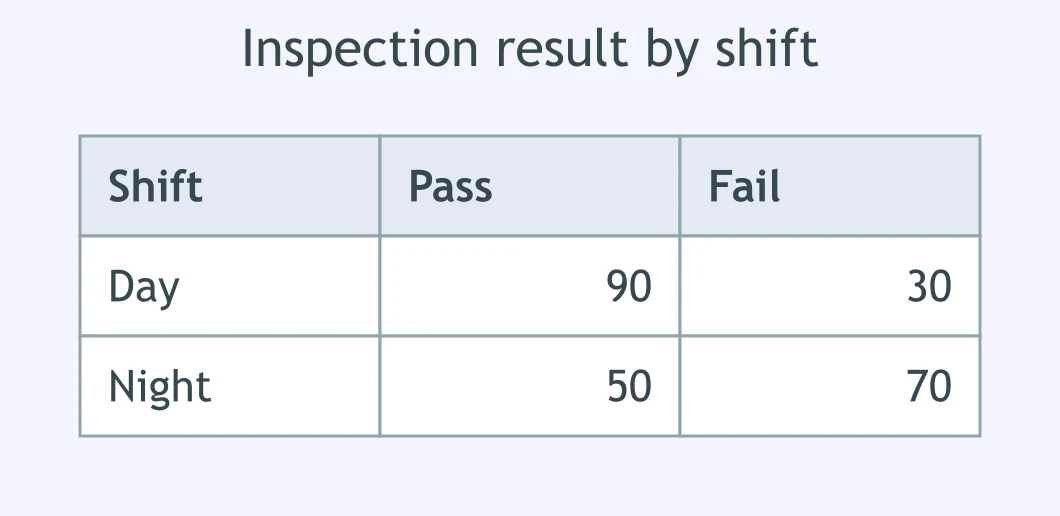
A factory table shows products grouped by shift and inspection result. Of night-shift products, what percent passed? Round to the nearest whole percent.
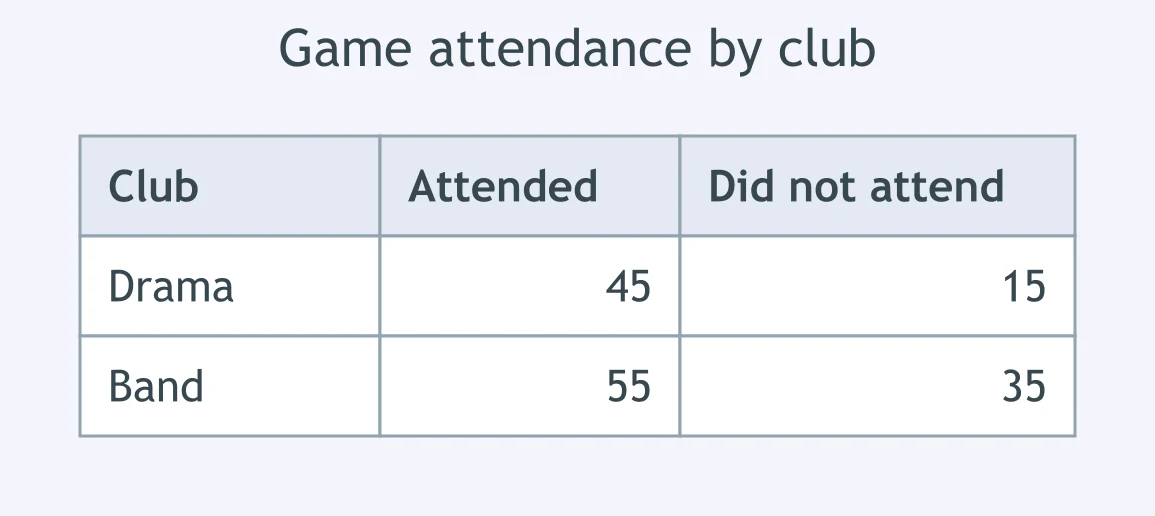
A school table classifies students by club and game attendance. Of drama students, what percent attended the game? Round to the nearest whole percent.
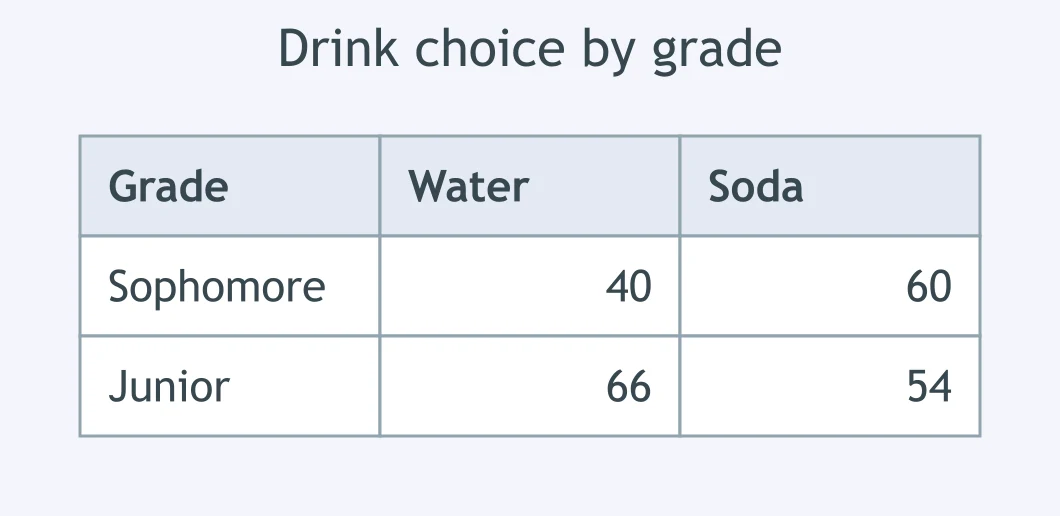
The cafeteria table sorts students by grade and drink choice. Of juniors, what percent chose water? Round to the nearest whole percent.
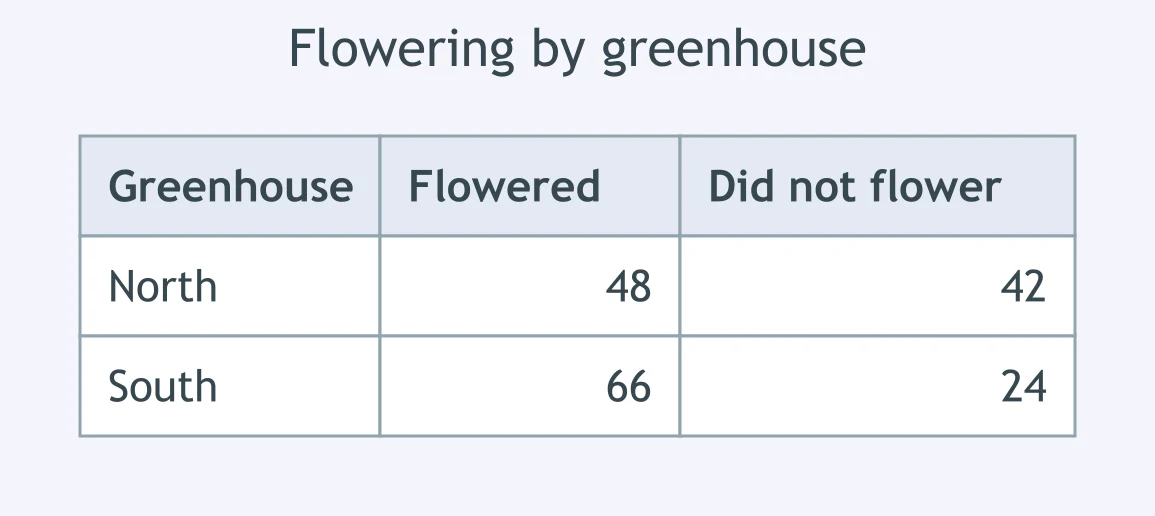
A greenhouse table classifies seedlings by greenhouse and flowering. Of the seedlings that flowered, what percent were grown in the south greenhouse? Round to the nearest whole.
A phone survey table classifies users by phone type and display mode. Of dark-mode users, what percent used Android? Round to the nearest whole percent.
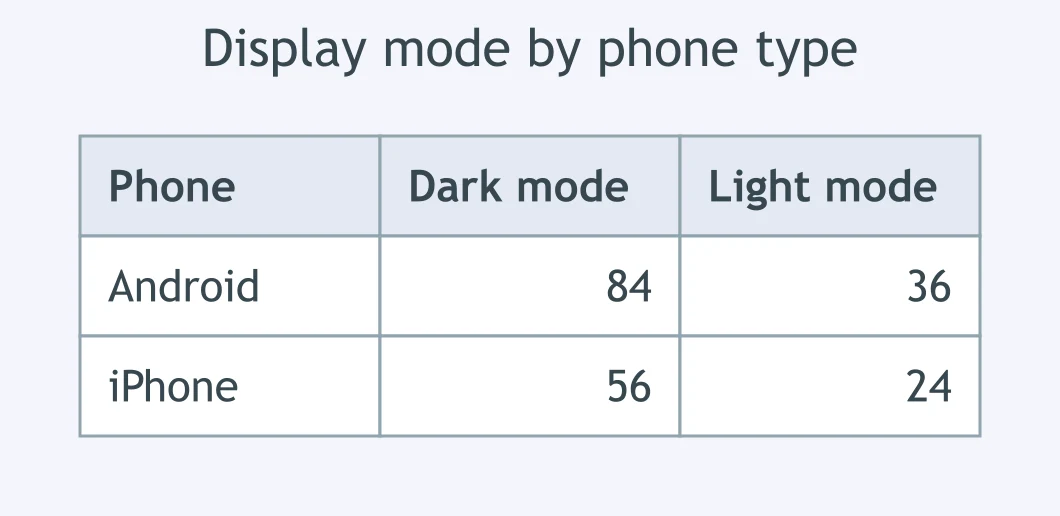
A lunch table classifies students by grade and lunch type. Of students with packed lunches, what percent were in grade 10? Round to the nearest whole percent.
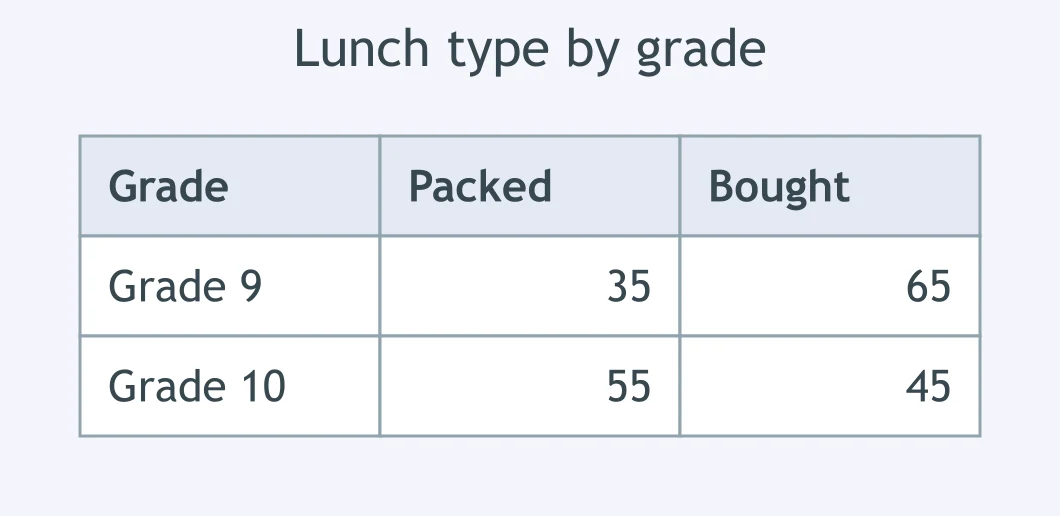
The clinic table classifies appointments by patient type and booking method. Of online bookings, what percent were returning patients? Round to the nearest whole.
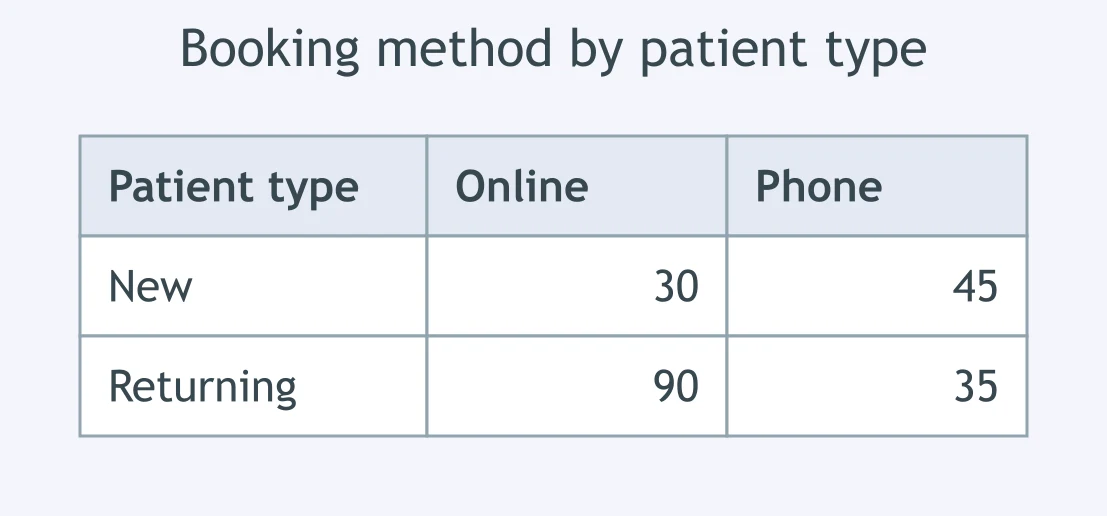
A store table classifies customers by membership and return visit. What do conditional relative frequencies show about membership and returning?
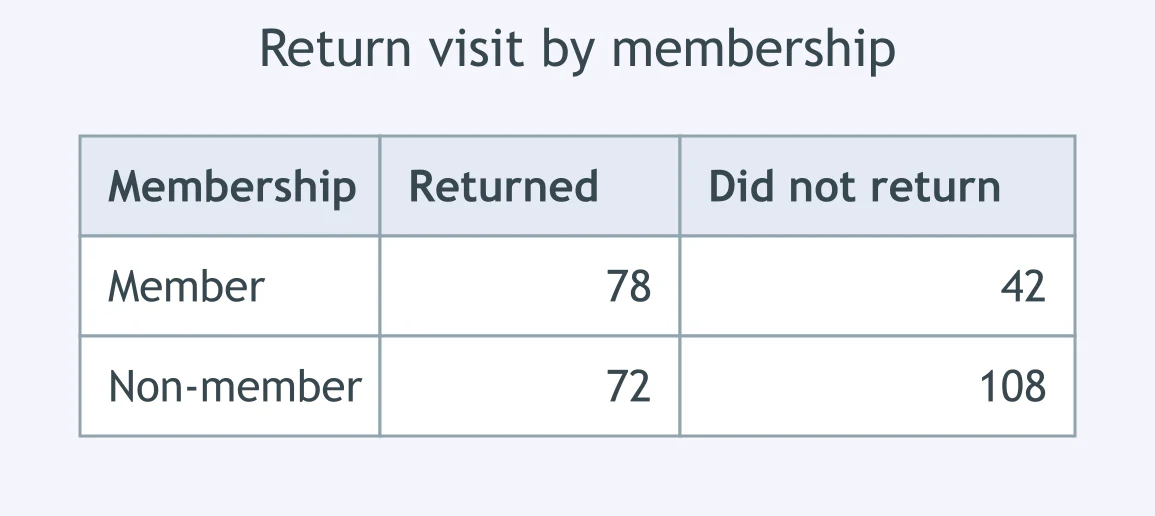
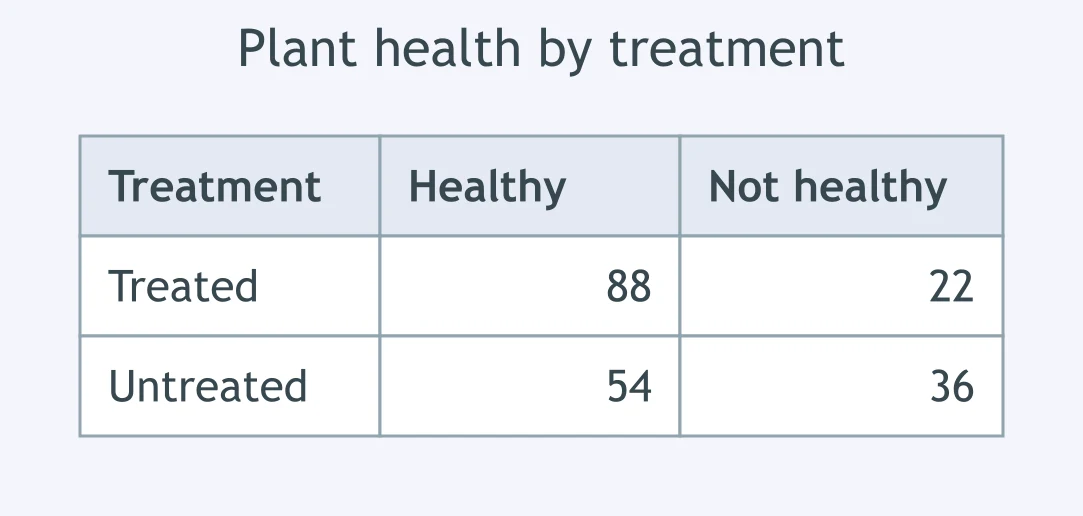
A farm table classifies plants by treatment and health. What do conditional relative frequencies show about treatment and plant health?
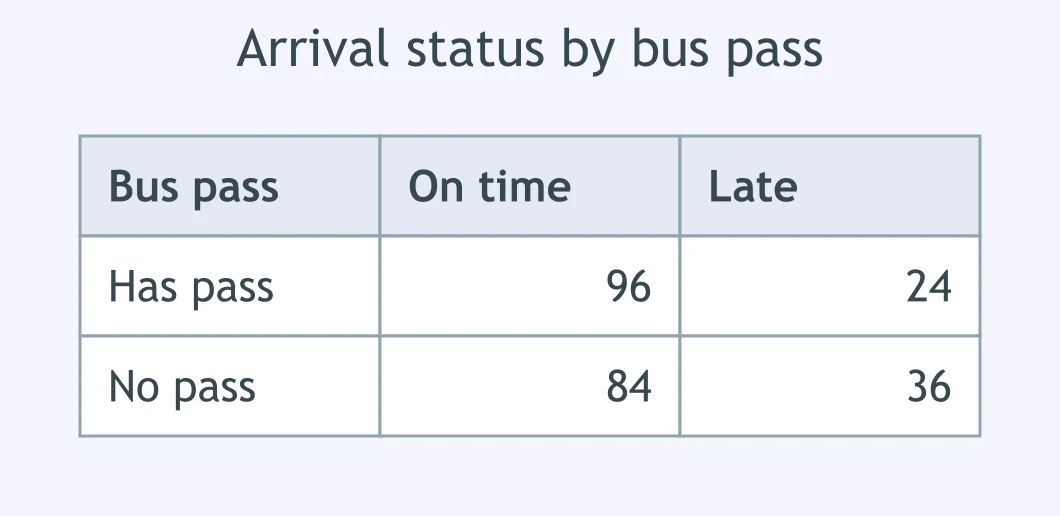
A transit table groups students by bus pass and arrival status. What do the conditional rates show?
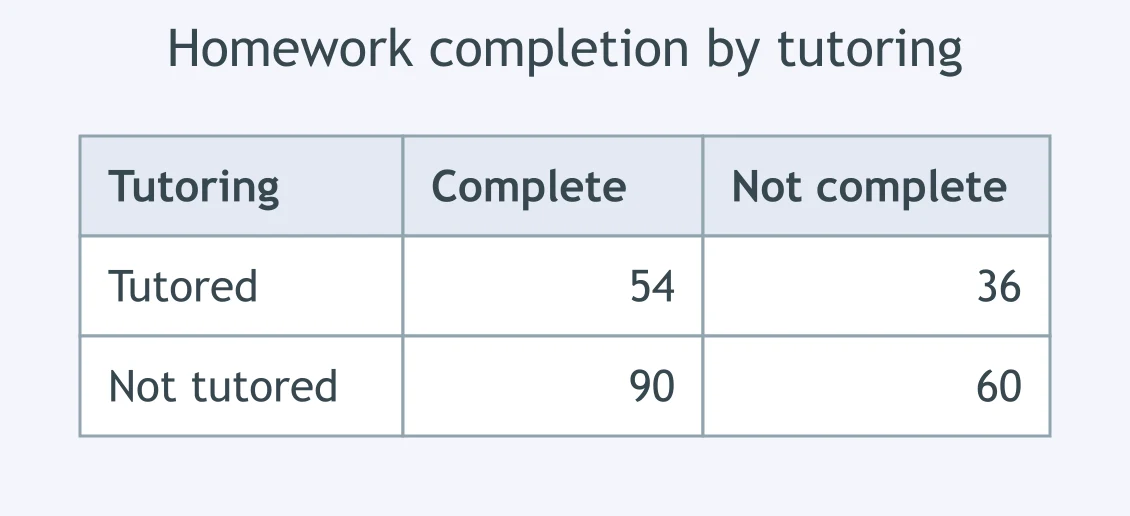
A homework table classifies students by tutoring and completion. What association do the conditional relative frequencies suggest?
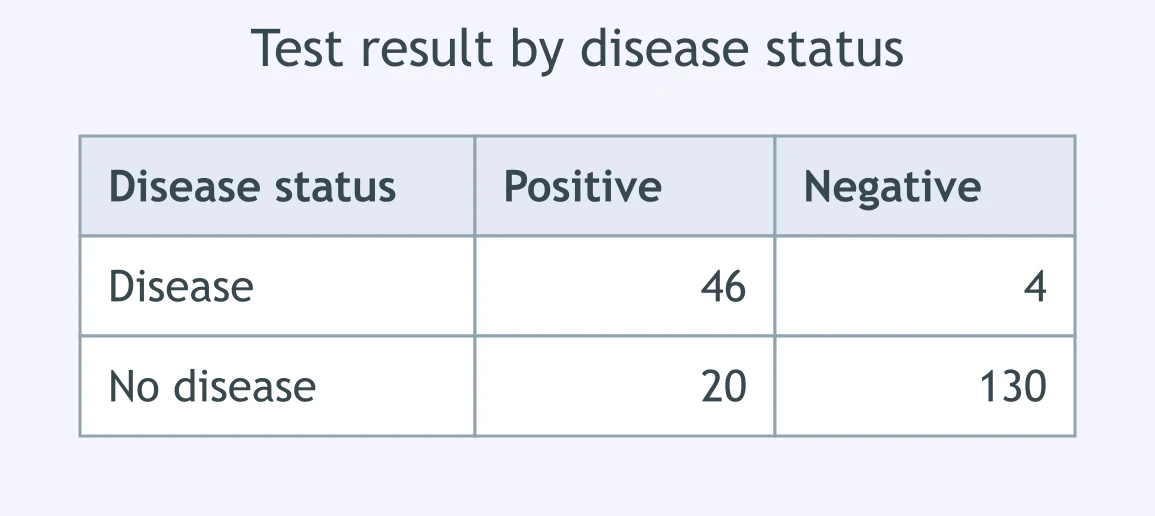
A clinic table classifies 200 patients by disease status and test result. A student says 92% of positive tests had the disease. What was read backward?
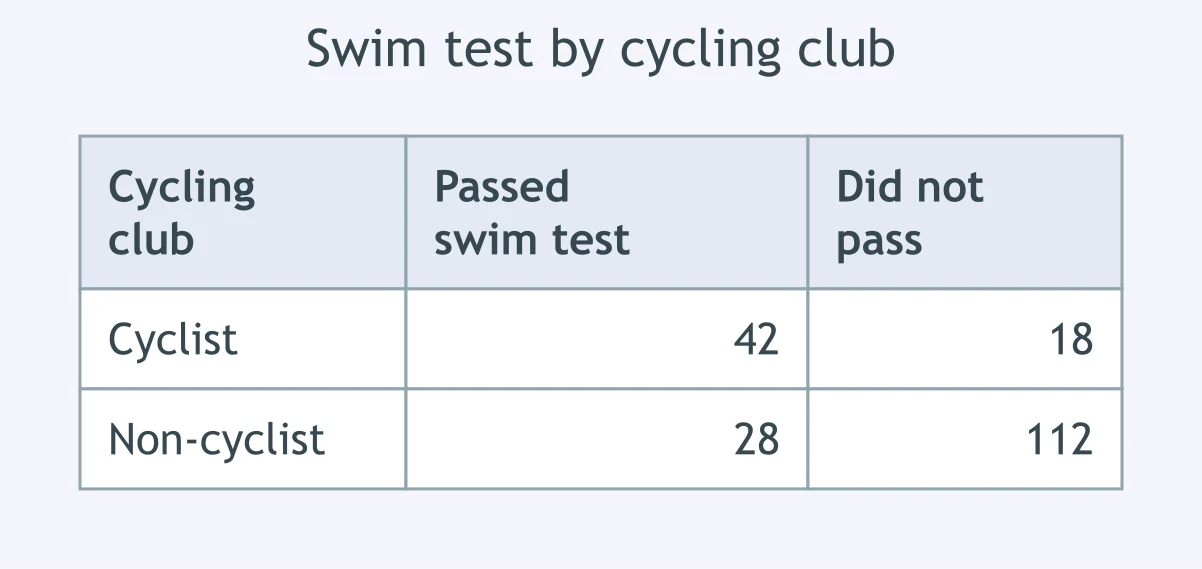
A camp table classifies 200 campers by cycling club and swim test. A student says 70% of swim-test passers were cyclists. What is wrong?
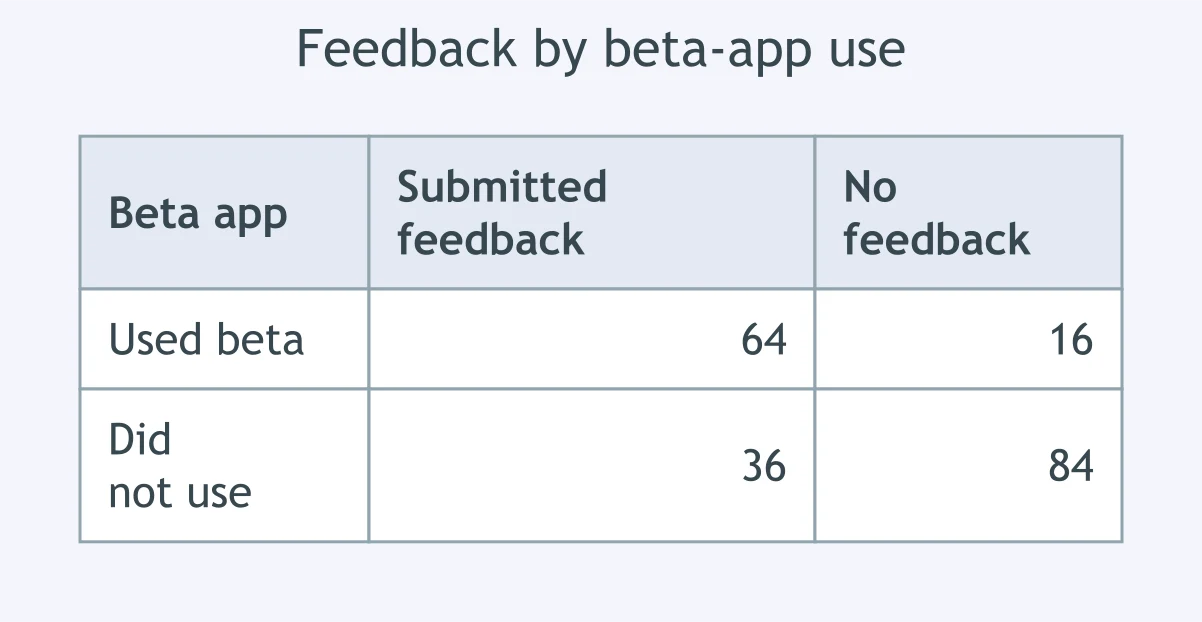
A school table classifies students by beta-app use and feedback. A student says 80% of feedback submitters used the beta app. What is wrong?
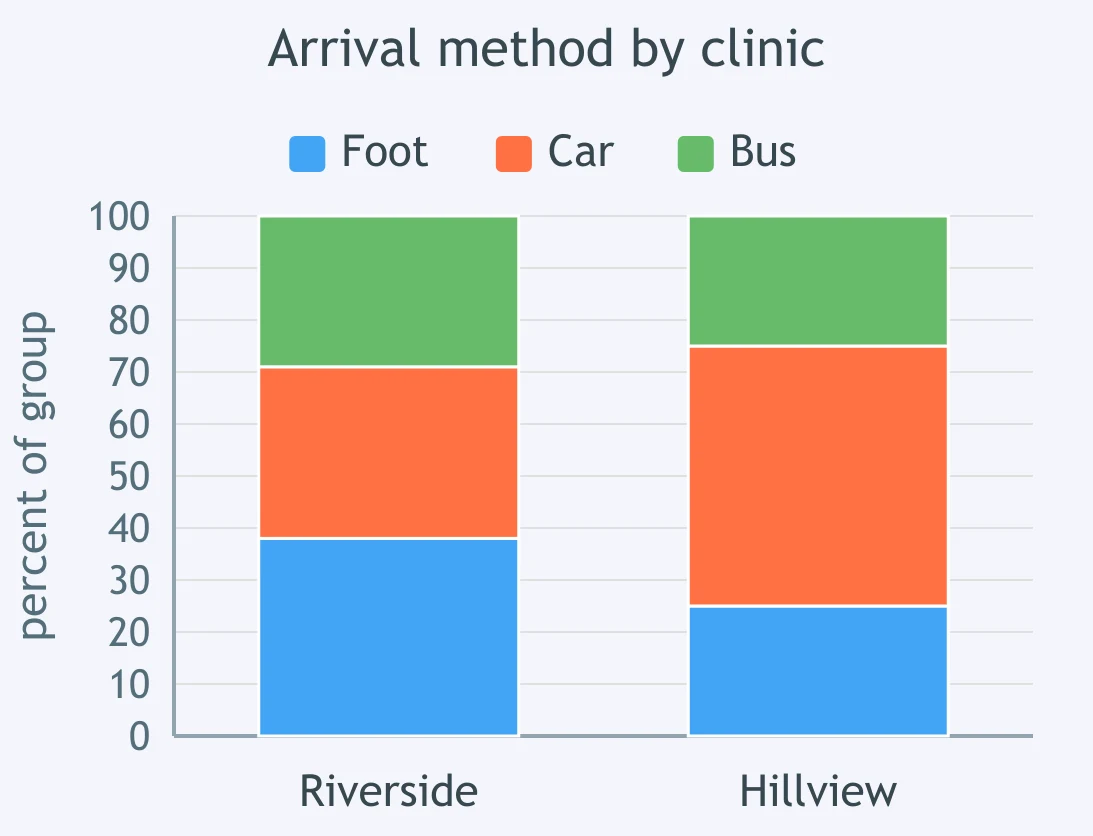
A segmented bar graph compares clinics by arrival method, with each clinic bar totaling 100%. For Riverside patients, what percent arrived by car?
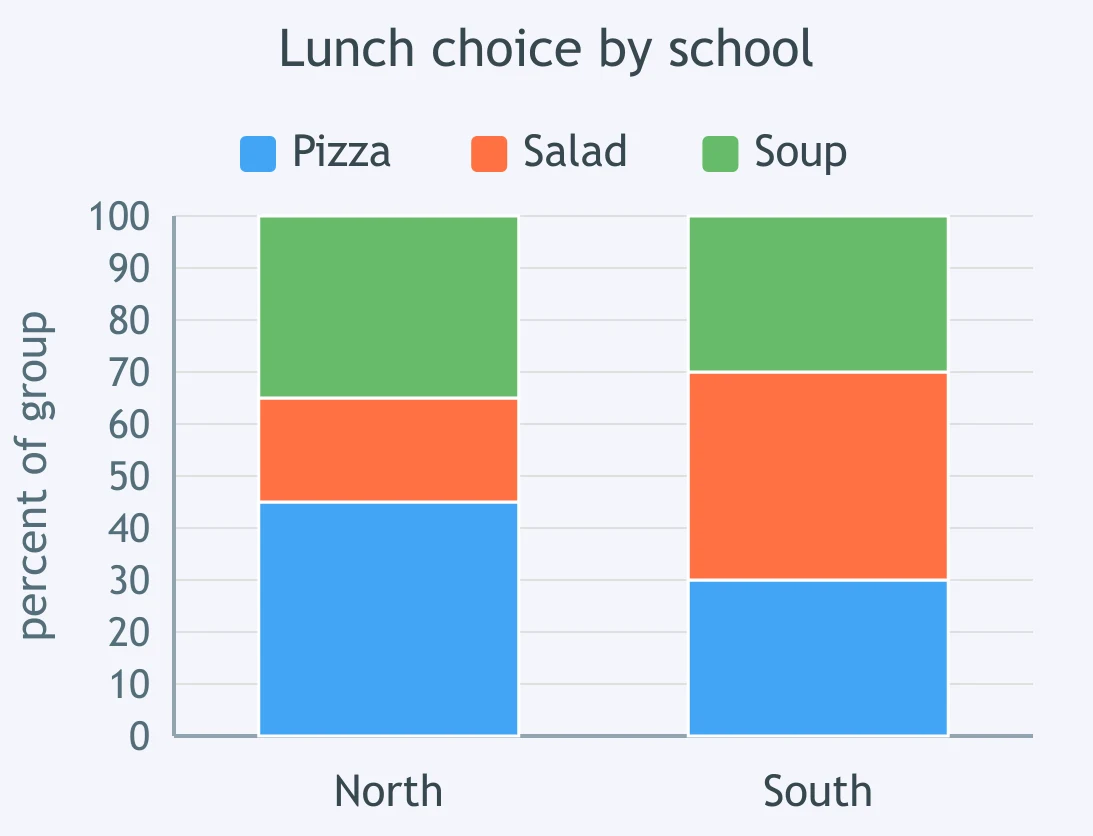
A segmented bar graph compares schools by lunch choice, with each school bar totaling 100%. For South School students, what percent chose salad?
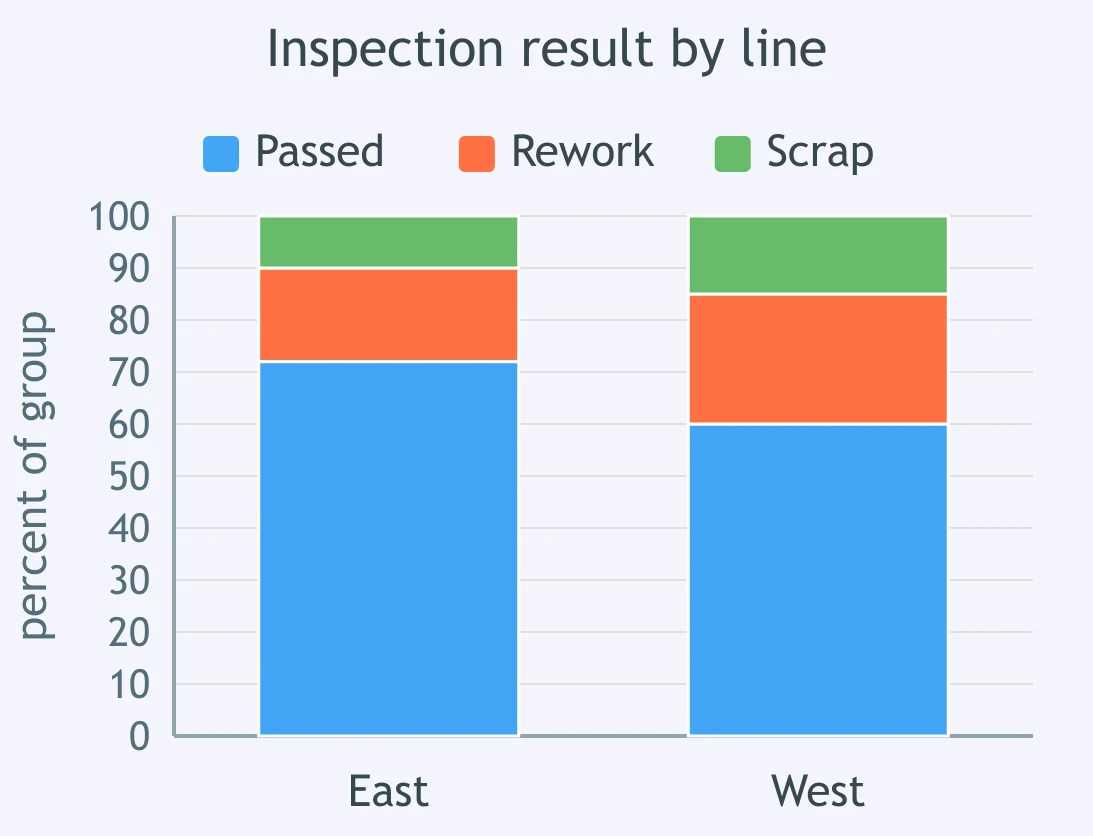
A segmented bar graph compares factory lines by inspection result, with each line bar totaling 100%. For East Line items, what percent needed rework?
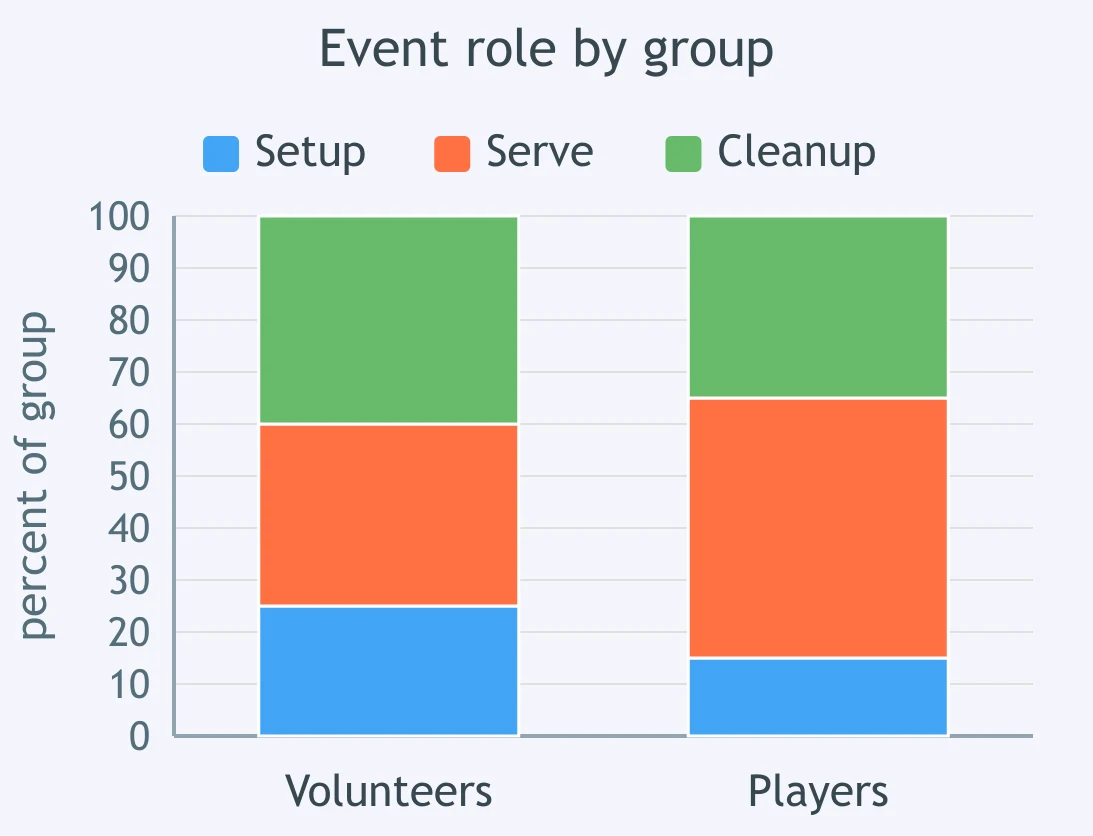
A segmented bar graph compares event roles by group, with each group bar totaling 100%. For volunteers, what percent worked cleanup?
Crack the passcode before the zombies get in.
Answer, then swat bugs for bonus points.
Race through questions at your own speed.
Same question on every screen. Fastest wins.

Pick a tile, answer, hit bonuses and steals.
The Correlation Coefficient
40 questions