Loading
by BlastRoom
Use price indexes and population to interpret economic output accurately.
#us_hs_economics

20 questions
One question set, multiple game modes. Tap any game to see it in action. Not sure which to pick?
Answer to place stones and capture territory.
Outrun the snow together.
Earn blasts, then hunt the other team.
Answer to earn energy, then climb.

The class blasts through walls together.
Bid on mystery lots. Most money wins.
Sell tours. Nice, standard, or a total scam.

Answer, restock, and serve the rush.
More correct answers pulls the rope your way.
Answer, then shoot down the alien wave.
Answer, then tap to leap the frozen ridge.
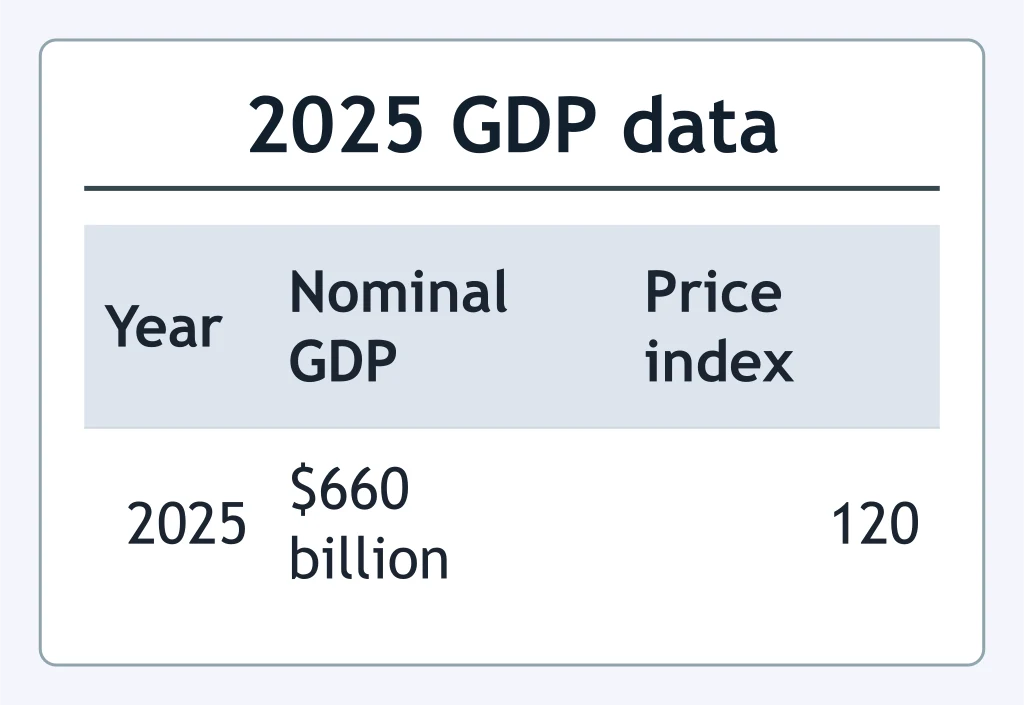
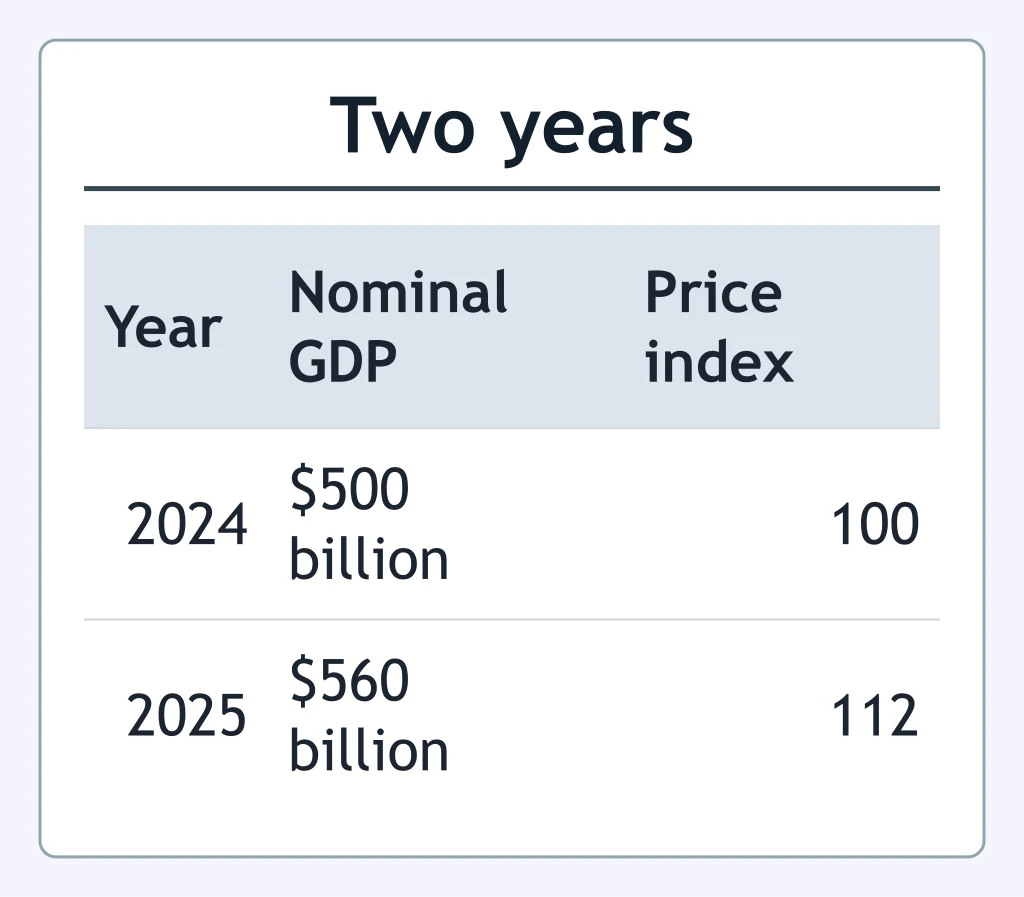
Use the table. With a base-year price index of 100, what is 2025 real GDP?
A nation reports nominal GDP of $840 billion and a price index of 105, with the base year index equal to 100. What is real GDP?
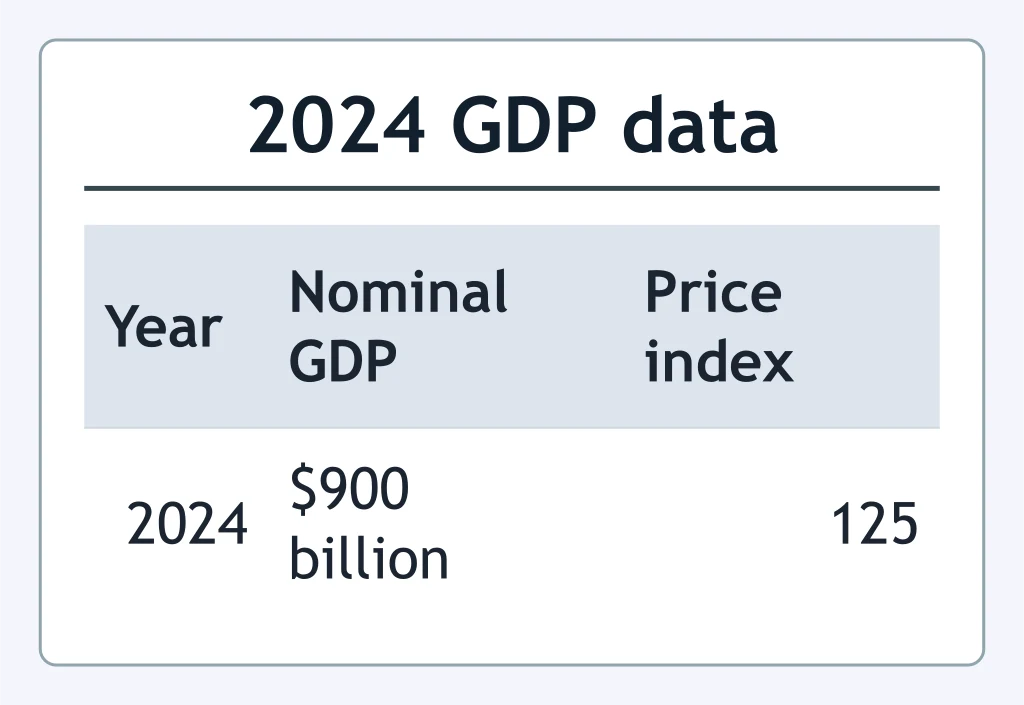
Use the table. The base-year price index is 100. What is real GDP for 2024?
Nominal GDP rises from $500 billion to $575 billion while the price index rises from 100 to 115. What happens to real GDP?
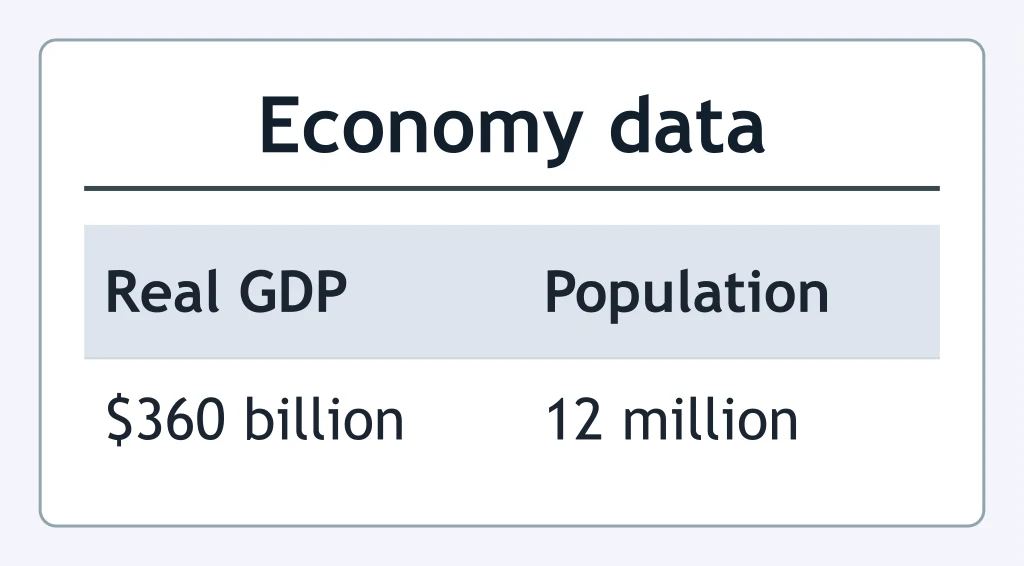
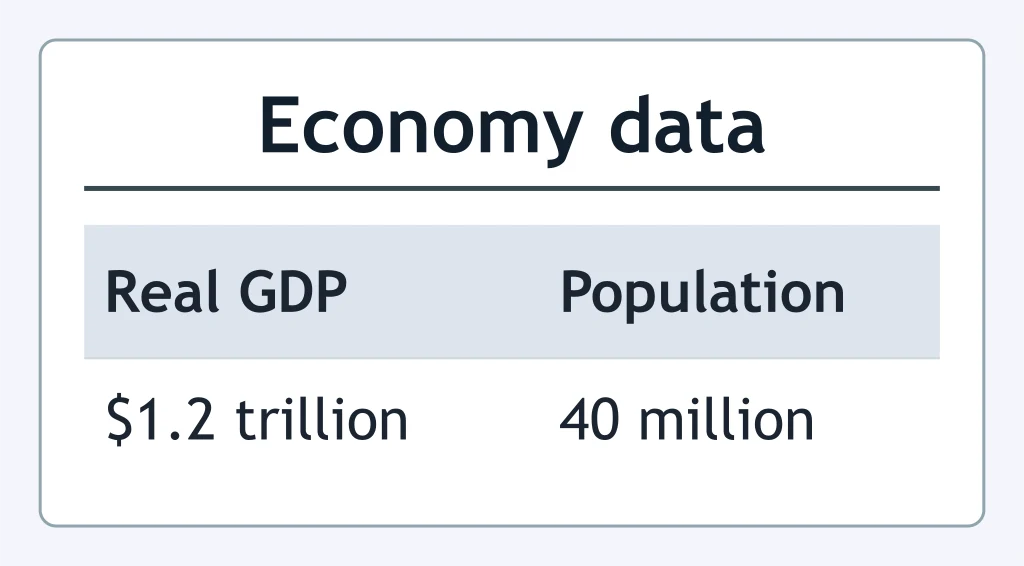
Use the table. What is this economy's real GDP per capita?
A country has real GDP of $525 billion and a population of 15 million. What is its real GDP per capita?
Real GDP rises from $400 billion to $440 billion, while population rises from 10 million to 12 million. What happens to real GDP per capita?
Use the table. What is real GDP per capita?
The quantity of every final good is unchanged, but all prices are 8 percent higher than last year. Which statement is correct?
From one year to the next, production rises by 10 percent and prices are unchanged. How do nominal GDP and real GDP change?
Use the table. After adjusting for inflation, what happened to real GDP from 2024 to 2025?
Physical output falls by 4 percent, but prices rise by 10 percent. Which outcome is possible?
Output is unchanged, but the overall price level falls by 5 percent. What happens to GDP measures?
Two countries have the same real GDP per capita, but one has income concentrated among a small group. What does GDP per capita fail to show?
A country's real GDP per capita rises from $40,000 to $42,000. What conclusion is justified?
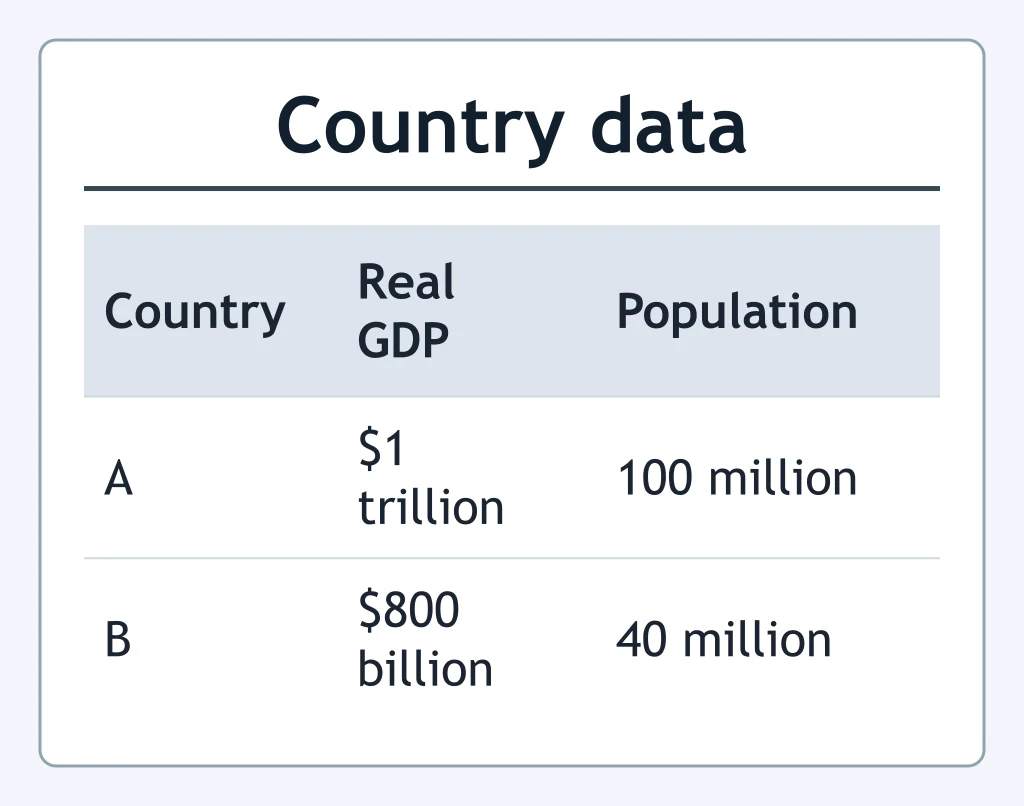
Use the table. Which country has the higher real GDP per capita?
A parent provides child care at home rather than paying a daycare business. What limitation of GDP does this example show?
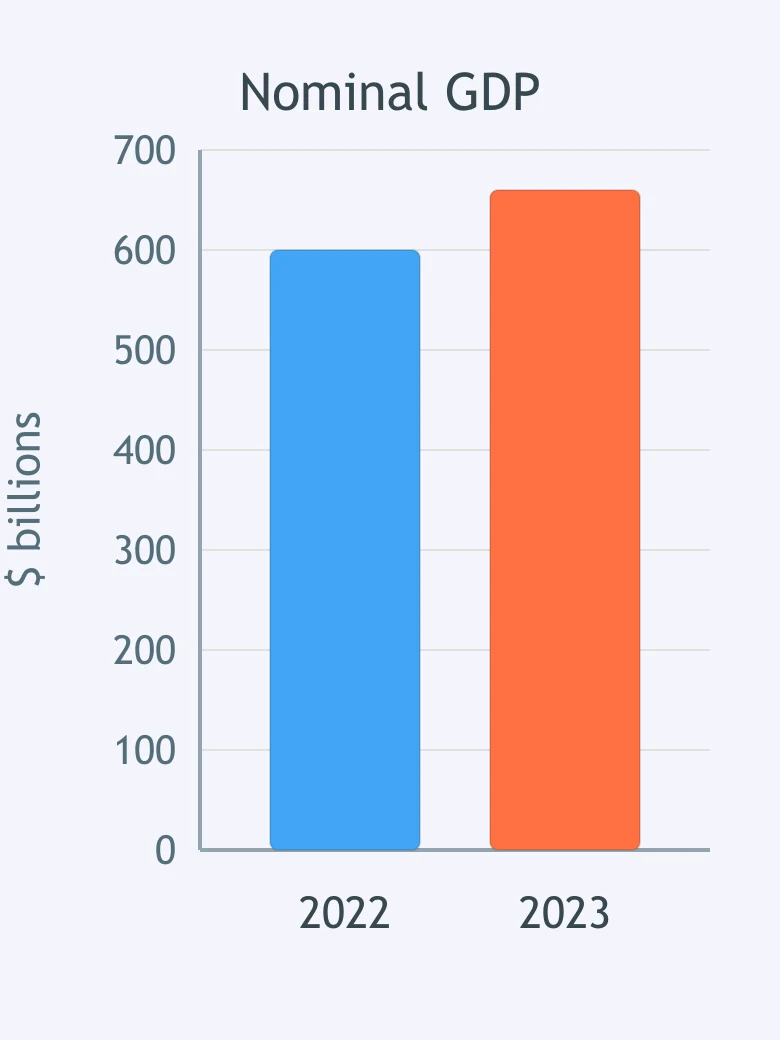
The graph plots nominal GDP. Real GDP was $600 billion in both years, measured in 2022 dollars. What explains the graph's increase?
Use the labeled graph of real GDP. Nominal GDP rose from $500 billion in the first year shown to $525 billion in the second year shown. What happened to the price level?
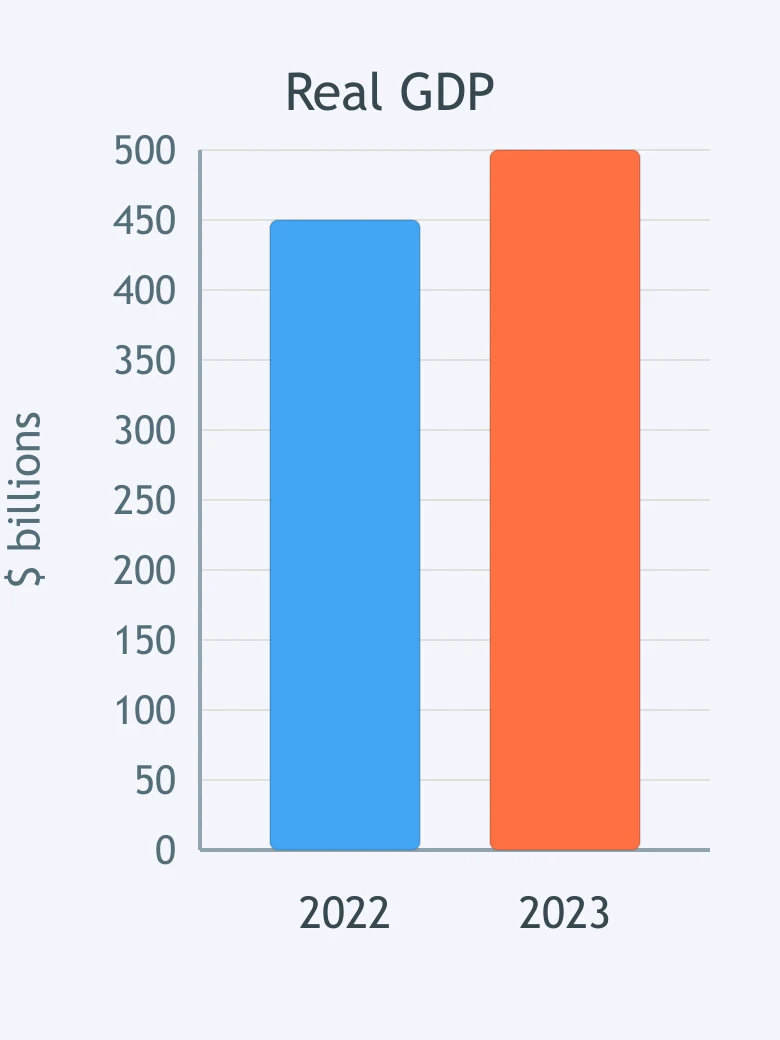
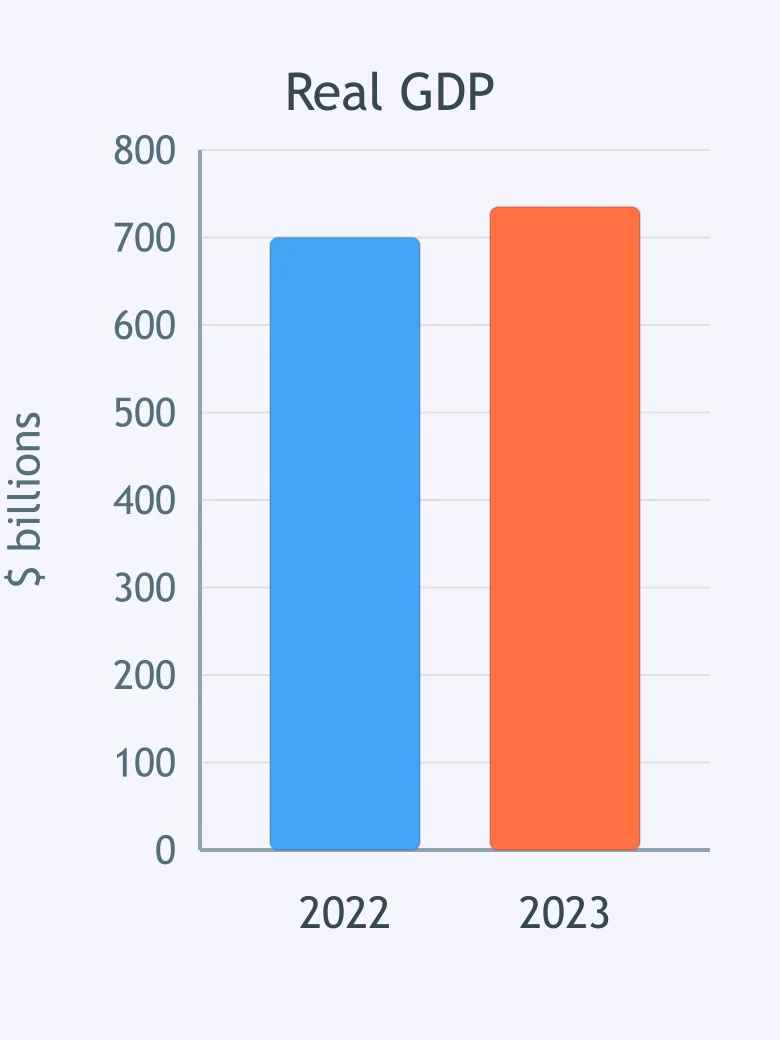
The graph plots real GDP. Nominal GDP rises from $700 billion to $770 billion over the same years. What does the larger nominal increase suggest?
Crack the passcode before the zombies get in.
Answer, then swat bugs for bonus points.
Race through questions at your own speed.
Same question on every screen. Fastest wins.

Pick a tile, answer, hit bonuses and steals.
Unemployment and Its Types
25 questions